
Definition
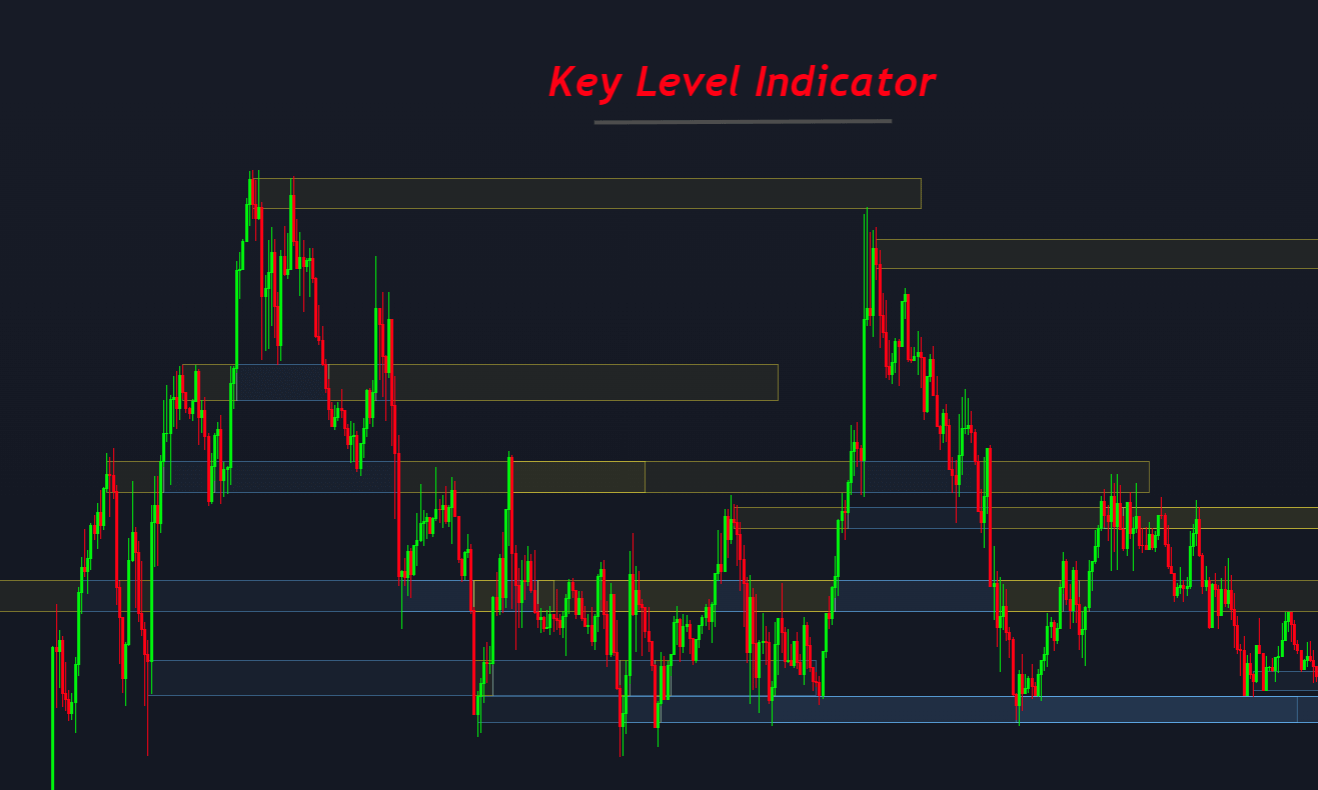
The key level indicator is a technical indicator that draws primary market key levels on the price chart. These levels help in trading effectively.
Every technical trader uses zones or levels on the price chart to determine high probability buy or sell levels. These key levels tell a trader that more traders are buying or selling from a particular price level on the currency/stock chart.
In this article, you will learn to trade with key levels, and at the end of the article, you will get a link to key level indicator free.
How does key level indicator work in trading?
This indicator identifies levels based on three price action patterns on the chart.
- Breakout
- False breakout
- Price retest
When one of the above three phenomena happens on the chart, the key level indicator draws a level on the chart. That level can be used to trade in the future.
Let me explain each topic briefly
Price breakout level
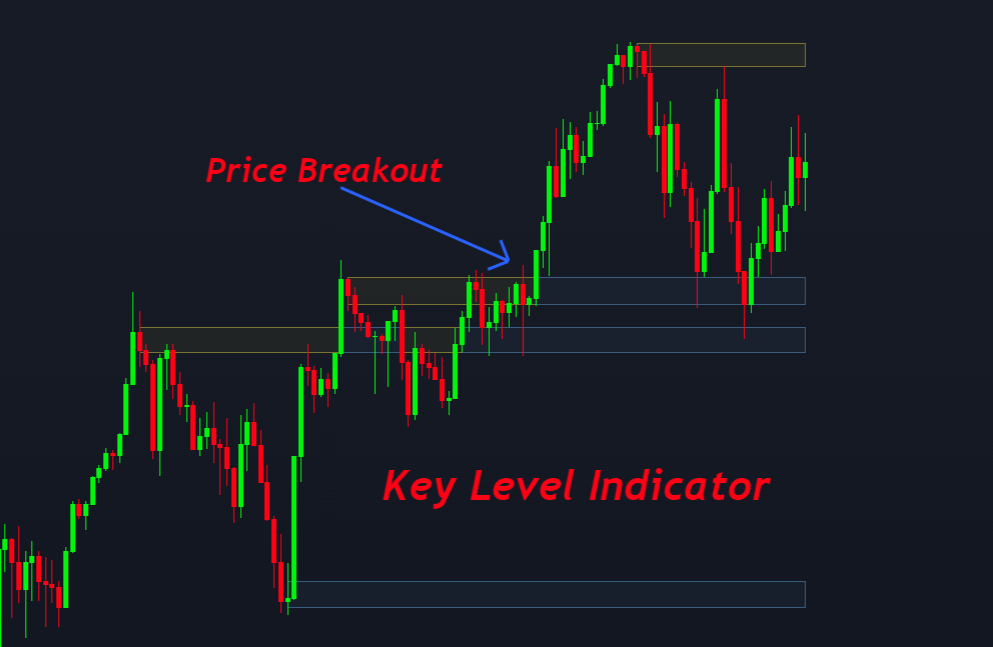
There is symmetry in the price structure. That’s why technical analysis works excellent. These symmetrical patterns repeat with time. When a strong support or resistance zone forms on the chart, impulsive price moves occur.
Tip: A strong support zone always has three or more price tests. And a strong resistance zone also has three or more price tests.
For example, the image price has made a pattern with a strong resistance zone. When resistance breaks, then a bullish price trend starts. This key level indicator will highlight that zone with a horizontal rectangle on the price chart to make it easy to identify the level.
False price breakout
False breakouts are an excellent source to draw key levels on the chart. Because a false breakout represents institutional trading activity from a certain level. So later, that level becomes interesting for traders. So many retail traders expect reversal from the false breakout level.
This indicator will draw a horizontal rectangle at that level by identifying the false breakout of a major S/R level. This becomes a ley level for future price trend reversals.
Price retest
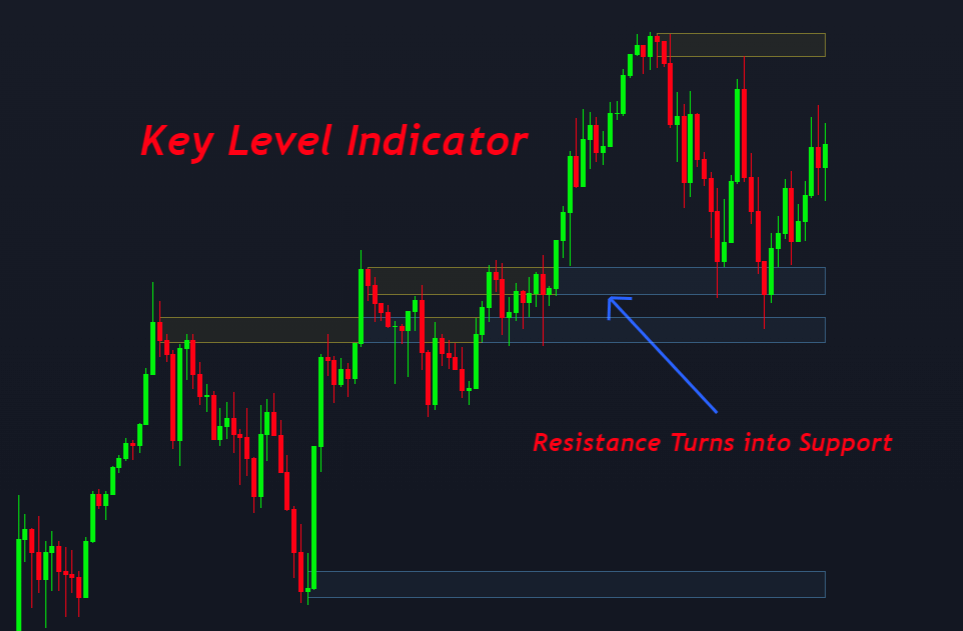
In trading retest, the market checks the validity/importance of a certain price level on the chart with a bounce.
Look at the image below for a better understanding of the price retest.
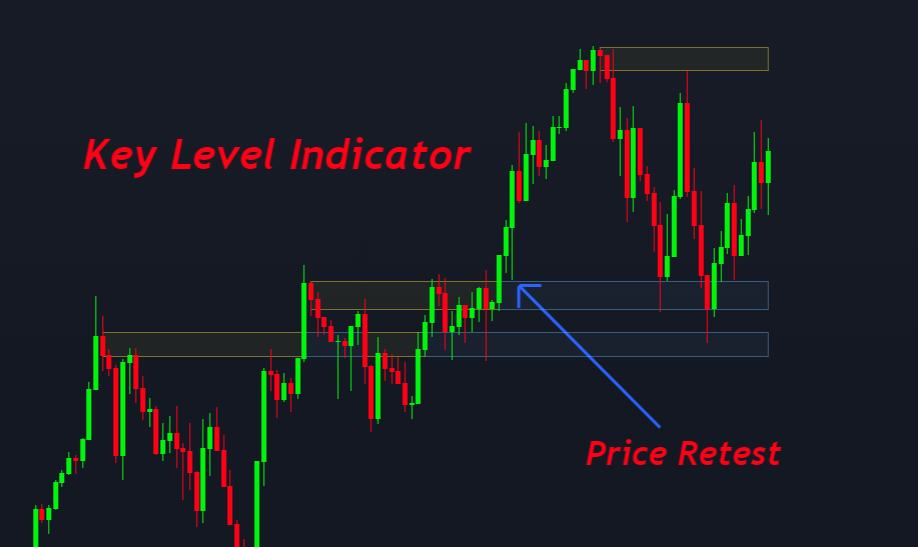
It is a major rule in technical trading that when a support zone breaks, that zone turns from support into a resistance zone. On the other hand, when a resistance zone breaks, then resistance turns into a support zone.
So, this indicator will also draw a zone for price retest. It will help you to trade with the trend and with big institutions.
How to trade with the Key Level Indicator?
As discussed above, this indicator draws zones based on three methods. So, there are three methods to trade with this indicator.
You don’t need to trade with these three methods only. This is just a practical example for you. It would be best to always make your strategy by using confluences.
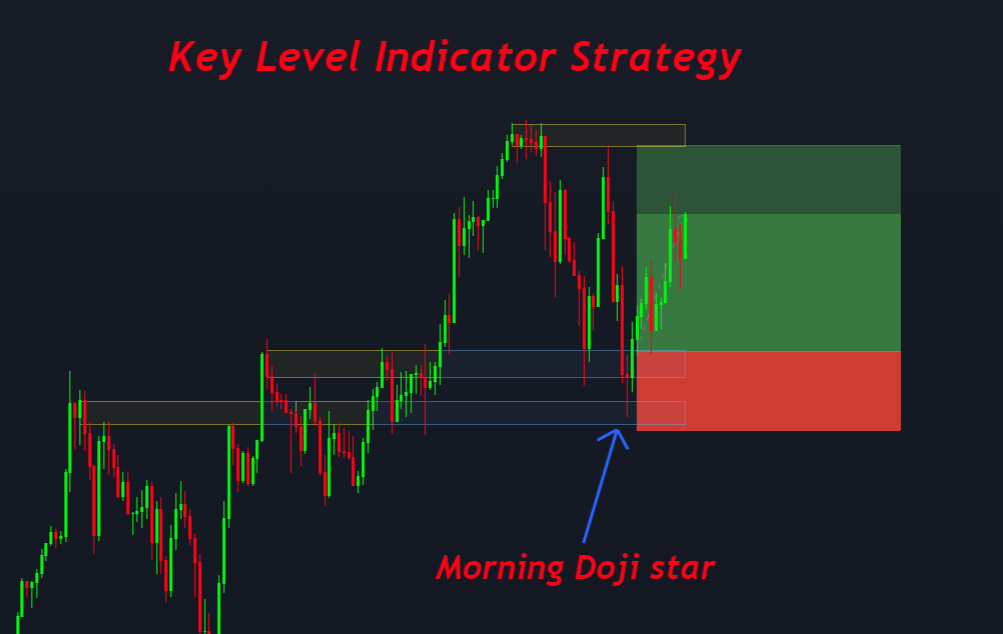
The confluence of candlestick pattern
This is an important step to get a high winning ratio in a trading strategy. Here I have added a confluence of candlestick patterns. For example, the indicator has made a key level for buy position. Then it would be best if you did not blindly open a buy trade. Instead, it would be best to wait for a bullish pattern formation at that key level. Like a bullish engulfing candlestick or any other bullish candlestick will increase the probability of bullish trend reversal.
Key Level indicator trading strategy
Here are a few steps of trading strategy:
- Wait for the formation of key levels on the chart
- Identify the direction of the trend and then align it with the key zone. Like both zone and higher TF trend should be in the same direction.
- Look for the formation of a candlestick pattern at the zone. For the buy zone, you should look for bullish candlesticks, whereas for the sell zone, you should wait for the formation of bearish candlesticks.
- Open a sell/buy trade using the candlestick confluence and place stop loss below/above the zone.
Alert function in the indicator
The beauty of this indicator is that there is an alert function. So, you don’t need to sit in front of the screen all the time waiting for the formation of zones. The key level indicator will alert you as soon as a zone is formed on the chart.
The Bottom line
The conclusion is that a trader should use indicators to increase the probability of winning. If you rely entirely on indicators, then obviously, you will lose. The best method is to increase the probability by adding technical tools.
do you have same Bjorgum indicator for MT4