
Definition
Long-legged Doji candlestick is a type of Doji candlestick that has a long lower and upper wick. All the Doji candlesticks have the same opening and closing price. The high and low make a difference between types of Doji.
Long-legged Doji represents indecision in the market. Because long upper and lower shadow represents that both sellers and buyers are strong and the market is deciding its future direction. It helps a lot in identifying the ranging market structure.
How to identify long-legged Doji?
To find out the long-legged Doji candlestick on the price chart, follow the following steps
- Confirm the doji candlestick with same opening and closing price
- There should be long upper and lower shadows of doji candlestick
- The upper and lower shadows should be approximately equal in size
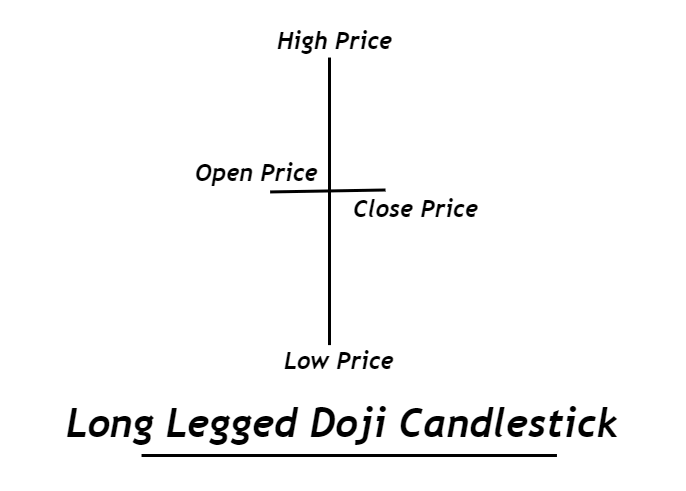
Structure of long-legged Doji candlestick
From the candlestick, we concluded that the candlestick has the same opening and closing price. But the structure of the candlestick shows the ranging period. It means the price moves sideways on the lower timeframe.
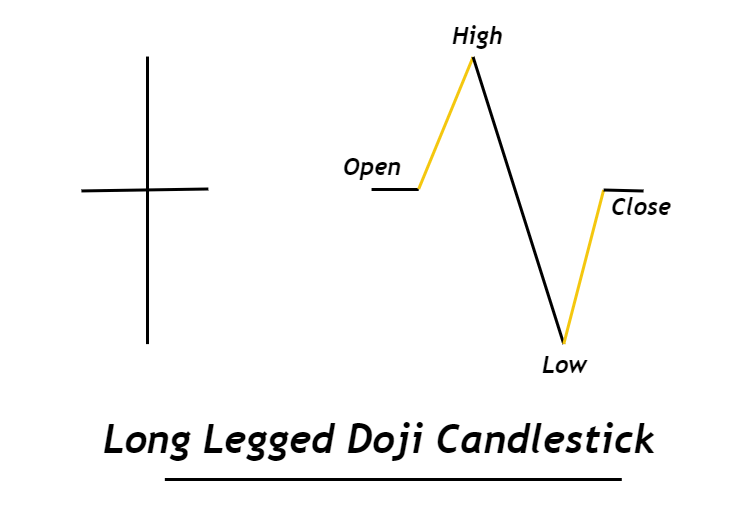
Most of the candlestick patterns give a trend reversal or trend continuation signal but long-legged Doji indicates a pause in the trend. It is the consolidation period after an impulsive period.
In the long-legged Doji, after the candlestick opening, the price will move down from the opening price then it will move up above the opening price. Then at the end, the price will come to the opening price again and then the candlestick will close making a long-legged Doji.
Look at the image below for a better understanding of the candlestick structure
Long Legged Doji: Information Table
| Features | Explanation |
|---|---|
| Number of Candlesticks | 1 |
| Prediction | Indecision in the market |
| Prior Trend | N/A |
| Relevant Pattern | High Wave candlestick |
Long-legged Doji trading psychology
Behind each candlestick, there is a story. You need to learn the method of reading stories of candlesticks to become a price action trader.
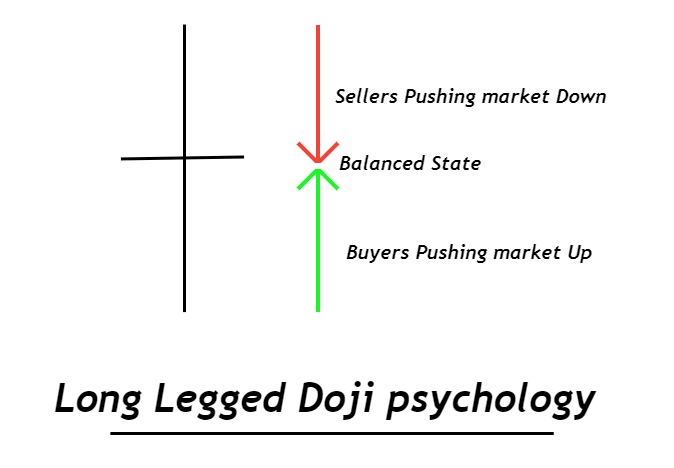
In the case of the long-legged Doji candlestick, both buyers and sellers are equal in power because candlestick has the same opening and closing price. It is the basic concept that price will go up when the number of buyers is great than the number of sellers and vice versa. During long-legged Doji candlestick formation, the number of sellers and number of buyers is almost equal that’s why price moves sideways.
Price is in a balanced state during long-legged Doji candlestick formation. Price will move up/down only during an imbalanced state.
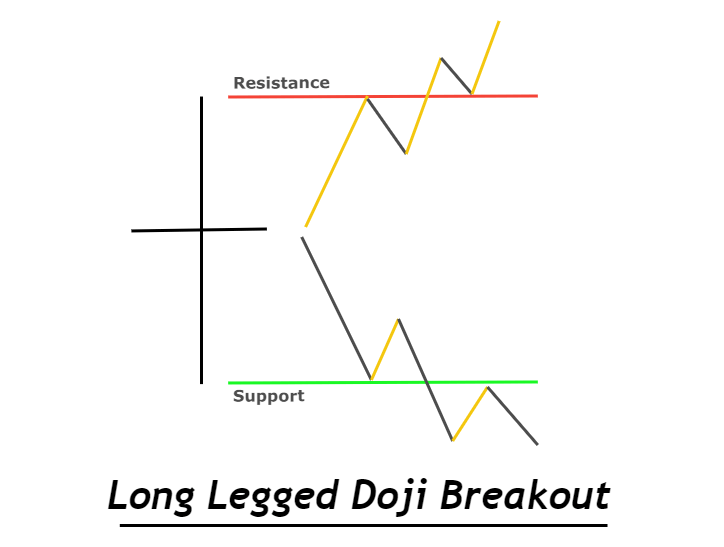
Breakout of Doji candlestick
The high and low of Doji candlestick act as strong resistance and support levels. The breakout of the high of Doji candlestick will generate a bullish price trend on the chart whereas if the price breaks the low of Doji candlestick then a bearish price trend will start.

Find High Probability Trades with this ADVANCED Candlestick Patterns Course
The Ultimate Candlestick Patterns Course That Will Help You To Trade Better
Trading strategy
A long-legged Doji candlestick cannot be traded alone. You need to add confluences with this candlestick to make a perfect trading setup.
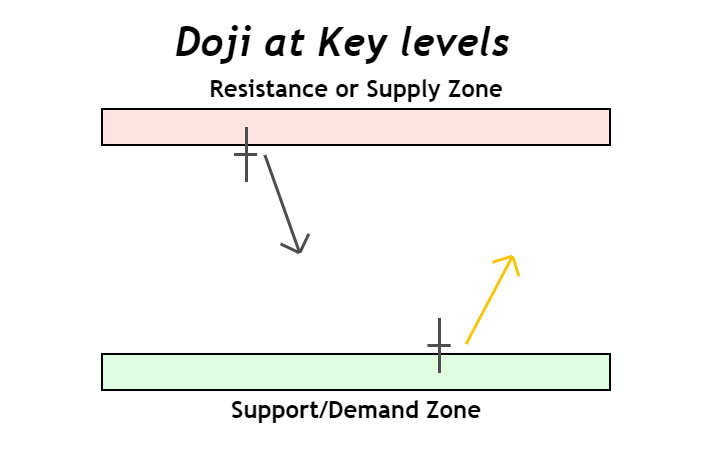
First of all, filter the best working conditions of Doji candlestick. For example, if a long-legged Doji candlestick forms at a key level (support and resistance or supply and demand level), then the probability of trend reversal or trend continuation will increase.
But if the same Doji form within a ranging market structure then the price will continue moving side until breakout.
Confluences to add with strategy
- Key level
- Higher timeframe analysis
- Breakout of high or low of doji candlestick
Key levels
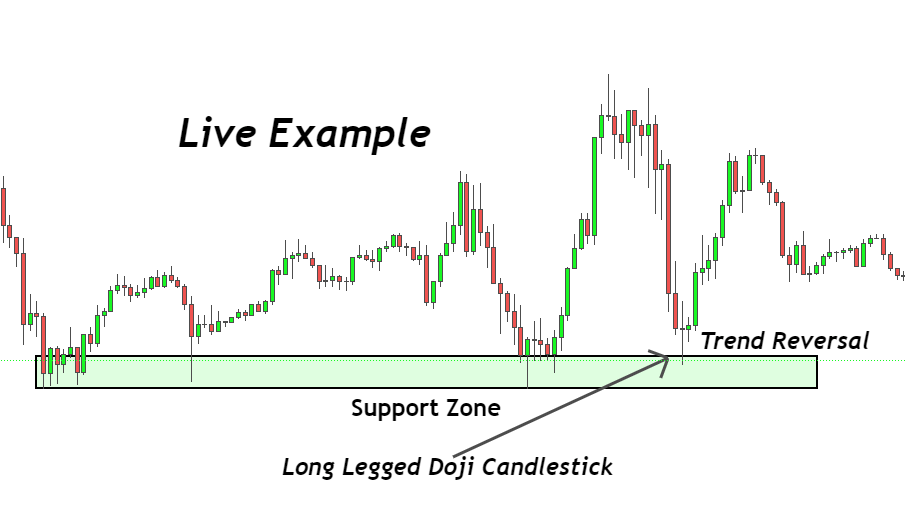
It is very important to use key levels to increase the probability of winning in a trade. For example, if a long-legged Doji candlestick forms at the support zone then the breakout of high of Doji will indicate a bullish trend. Because there are already chances of a bearish trend reversal from a support zone but you have added a confluence of Doji and breakout to increase the probability of trend reversal.
Higher timeframe analysis
Higher timeframe analysis is a mandatory step to follow in each trading strategy. It is simply the method of trading with institutions. Just zoom out of the screen and analyze the trend using the higher high and lower low method. Then match your trade setup direction with the trend.
Breakout of high or low of the candlestick
This step is specifically for long-legged Doji candlesticks. It will make things easier for you while deciding a trade direction. Because if you are looking for a reversal from a support zone then high of the Doji candlestick should break. On the other hand, if you are analyzing a trend reversal from resistance or supply zone then the low of Doji candlestick should break.
It acts as a confirmation for trade entry-level.
Pro tip: Draw horizontal lines on high and low of long-legged Doji candlestick. Then switch to a lower timeframe and wait for a candlestick closing above or below the horizontal lines to confirm a breakout.
These are three methods you should use while trading a long-legged Doji candlestick. Stop-loss and take-profit levels are measured based on the strategy you are using.
The Bottom line
A single candlestick has many secrets within it. You should try to read candlesticks that form at the major key levels to predict the price trend reversals accurately.
Long-legged Doji candlesticks form frequently on the price chart but you should trade the candlesticks that form at the key levels only.
Make sure to backtest the Doji candlestick properly and try to read the market by switching to lower timeframes.
Hi, I am from India and trying to learning chart as I nifty option trader and frequently loosing money.Good to see the details about different patterns in your website.
Thank you