Definition
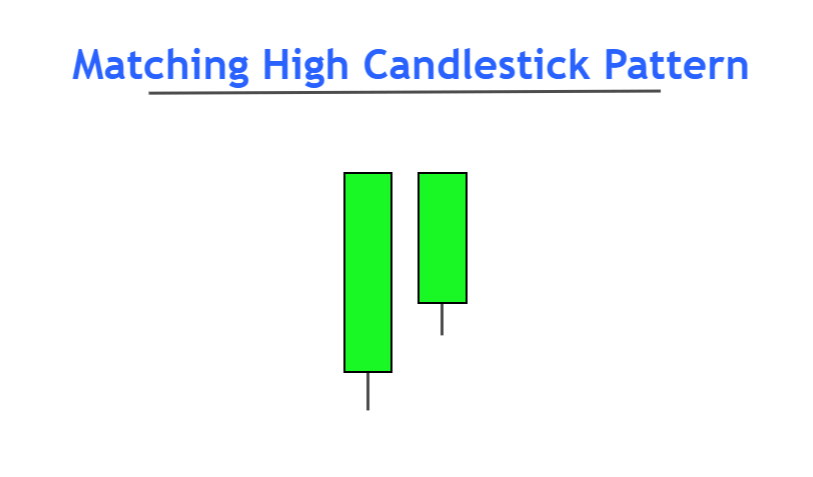
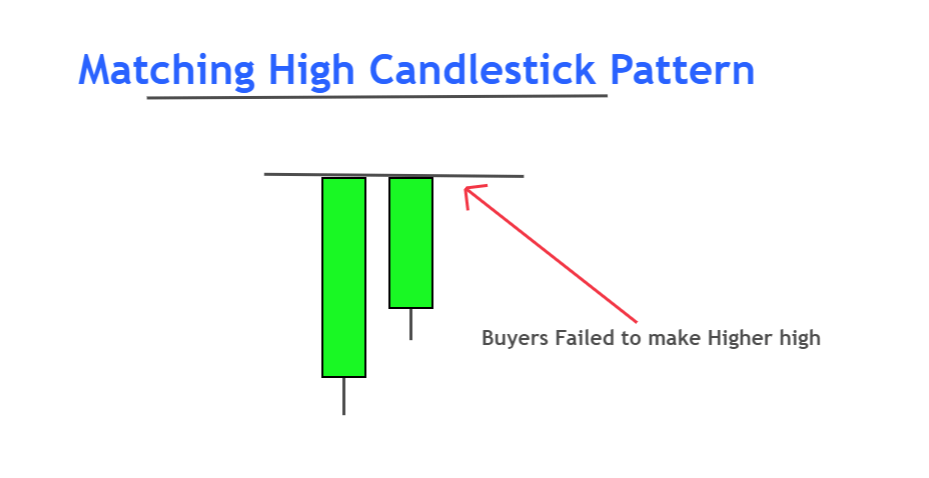
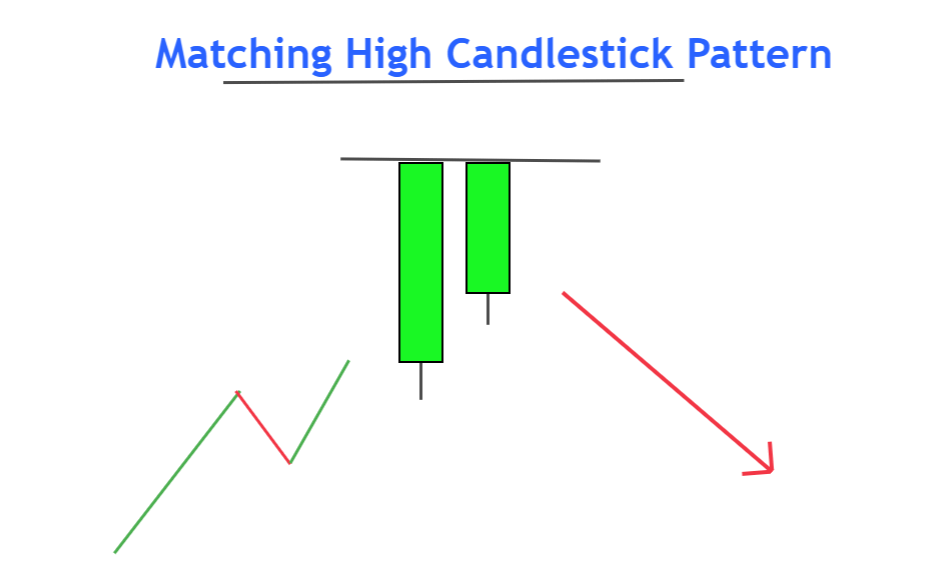
Matching high is a bearish reversal candlestick pattern consisting of two bullish candlesticks with the same high and no shadows on the upper side.
The second candlestick opens with a gap down in this pattern. The Matching high pattern shows that the trend of buyers is about to end, and sellers are preparing to decrease the price of a specific asset/currency.

The opposite of matching high is the matching low candlestick pattern
How to identify matching high candlesticks on the chart?
The matching high pattern consists of two bullish candles with a gap.
Here is the guide to the structure of this pattern
- The first candlestick will be a big bullish candle, forming at the top of the chart.
- The second candle will open, with a gap down and it will close at the same level as the previous candle closed. it will open above the open of previous candlestick.

It has a simple structure, but it isn’t easy to find it on the chart because it is a rare candlestick pattern and will form mostly in stocks and indices.
Matching High Pattern: Information Table
| Features | Explanation |
|---|---|
| Number of Candlesticks | 2 |
| Prediction | Bearish trend reversal |
| Prior Trend | Bullish trend |
| Relevant Pattern | Matching low candlestick |
What does a matching high pattern tell traders?
There’s a psychology behind every candlestick pattern that shows the activity of big traders and institutions.
Let’s read the price action
When a big bullish candlestick forms at the top of the bullish trend, it shows that buyers are stronger than sellers.
After the first bullish candlestick, the next candle will open with a gap down and above the opening price of the previous candle. A sudden gap shows the high momentum of sellers from a key level. When the second candle will fail to make a new higher high then it shows that the buyers are failed to break the fundamental level created by the sellers. Now sellers are controlling the market, and the price will decrease.

Find High Probability Trades with this ADVANCED Candlestick Patterns Course
The Ultimate Candlestick Patterns Course That Will Help You To Trade Better
Best trading conditions for matching high pattern
To increase the probability of winning a candlestick pattern, you should add other technical tools. Here I have added two technical tools.
- Supply zone or Resistance zone
- Overbought conditions

The Bottom Line
In this post, I have explained the matching high pattern with a few strategies used in trading. Reading the price action is the way to success in trading. That’s why you should try to read the price in trading.
It would be best to trade this candlestick pattern on a daily and H4 timeframe for best results.

