
Definition
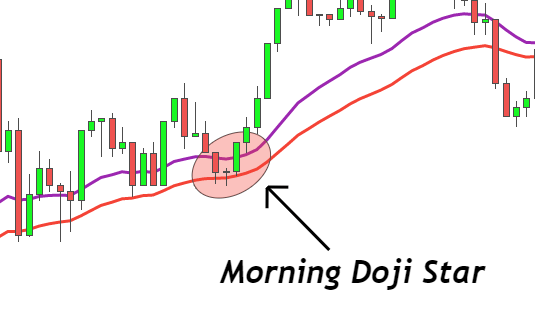
Morning Doji Star is a three candlestick pattern that consists of a bearish candlestick, a Doji candle, and a bullish candlestick in a series. This is a bearish trend reversal candlestick pattern and a bullish candlestick.
It represents that buyers have started controlling the market. It is important to understand the logic behind each candlestick pattern to become a price action trader. Learning to read the market is the best practice of technical analysis in trading.
How to identify the morning Doji star?
Big bearish candlestick, a Doji candlestick, and a big bullish candlestick combine in series to make a morning Doji star. There are certain criteria you need to follow to find a perfect candlestick pattern on the chart.
Follow the following steps
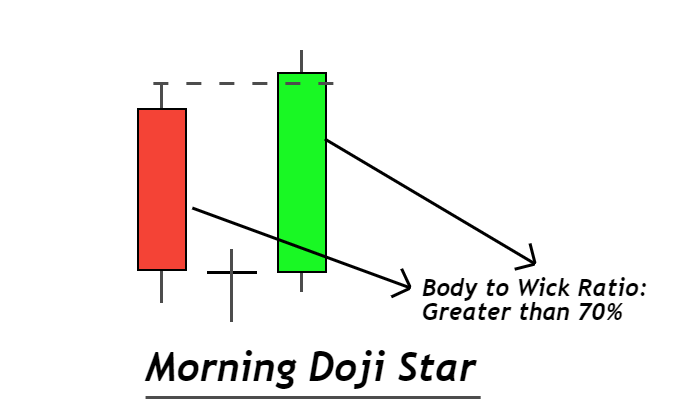
- Body to wick ratio of the bearish candlestick should be greater than 70%. It indicates a big body candlestick. The big body of the candlestick is directly proportional to the momentum of sellers in the market
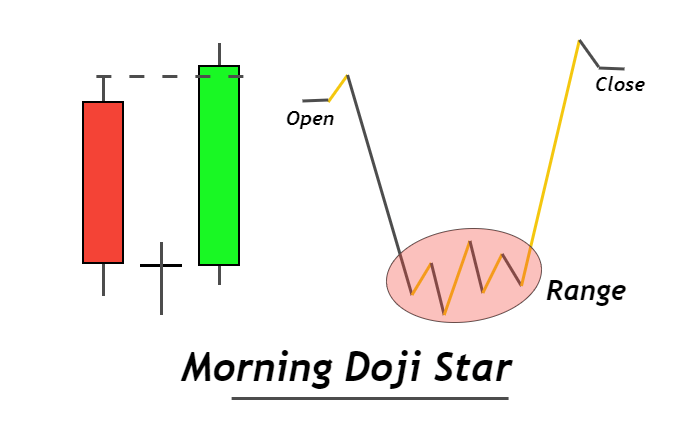
- Doji candlestick should have the same opening and closing price. The size of this candlestick should not be bigger than the other two candlesticks.
- Bullish candlestick should also have at least a 70% body-to-wick ratio.
The closing price of bullish candlestick matters a lot in the morning doji star pattern. There are further two methods. Both methods are perfect and the winning ratio of these patterns depends on the location on the price chart.
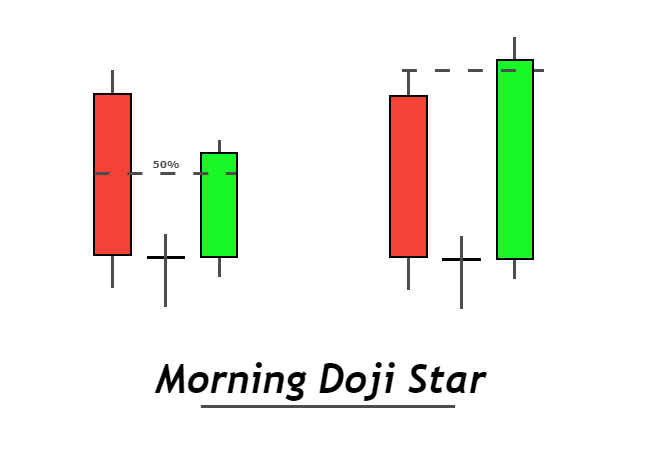
- Method 1, bullish candlestick should close above the 50% level of bearish candlestick. 50% is a strong level and closing above this level means the price has broken that strong resistance level and now it is ready to move up.
- Method 2, bullish candlestick should close above the high of bearish candlestick. It is a strong buy signal and represents large momentum of buyers who are controlling the market.
Morning Doji star: Information Table
| Features | Explanation |
|---|---|
| Number of Candlesticks | 3 |
| Prediction | Bullish trend reversal |
| Prior Trend | Bearish trend |
| Counter Pattern | Evening Doji Star |
The psychology behind morning Doji star
Morning Doji star signifies that buyers are preparing to turn the bearish trend into a bullish trend.
When a big bearish candlestick forms then it represents the downtrend with a large momentum of sellers. Sellers are controlling the market. Then the formation of a Doji candlestick indicates the balance of forces of buyers and sellers.
Before Doji candlestick sellers were controlling then buyers came in and balanced the momentum of the market.
After Doji candlestick, a big bullish candlestick represents the large momentum of buyers coming into the market by absorbing the sellers. Now buyers are controlling the market.
This shows the slow changing of market momentum from selling into buying. You should learn the logic behind each candlestick pattern before trading to become a price action trader.

Find High Probability Trades with this ADVANCED Candlestick Patterns Course
The Ultimate Candlestick Patterns Course That Will Help You To Trade Better
High probability Morning Doji star pattern
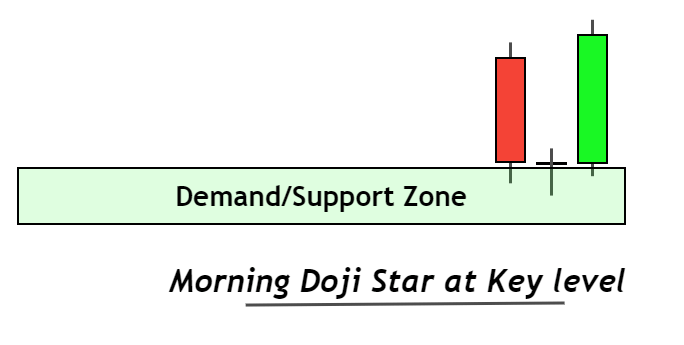
A morning doji star candlestick pattern will be termed as a high probability pattern if it will form on a strong support level or at a strong demand zone.
Trading is all about gathering confluences to increase the probability of winning. Price has the ability to jump from a demand zone or support zone. If a bullish candlestick pattern like a morning Doji star forms at the key level then chances of a change of trend from bearish into bullish will increase.
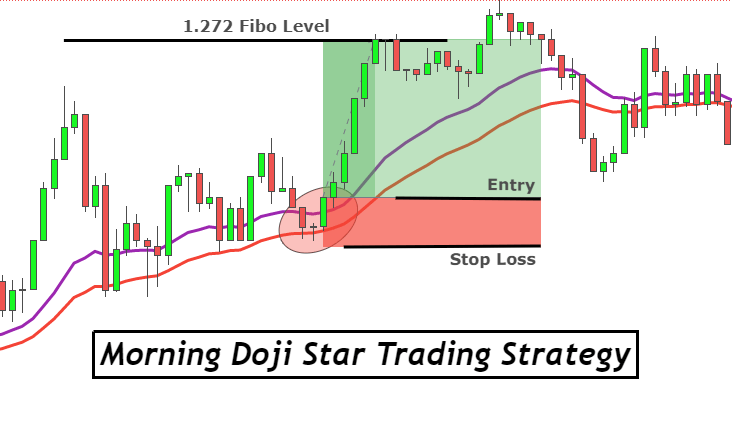
Check in the image for a better understanding.
Morning Doji star trading strategy
A candlestick pattern can not be used to trade alone without the confluence of other chart patterns. Because a candlestick gives a reversal signal but it does not tell a retail trade about the take profit level in technical analysis.
Here, we will explain a morning Doji star trading strategy with the confluence of moving average.
Confluences to be added in strategy
- 21 and 35-period exponential moving averages
- Higher timeframe trend
- Fibonacci tool
Trading strategy
Here is the 3 steps complete guide to trading strategy
- Identify higher timeframe trends by zooming out the price chart and labeling higher highs and higher lows.
- Price should retrace to the exponential moving averages. the span between 21 and 35 periods EMAs must be minimum
- Look for a morning doji star candlestick pattern on the EMAs. Price should behave in such a way that it must reject the moving average lines. price rejection indicates that moving average lines have the strength to hold the price up.
Pro Tip: Use the highs and lows of daily candlesticks to check the higher timeframe trend. (for beginners)
Open a Buy order
Place a buy stop order above the high of the bullish candlestick. Pending order has also proved helpful during the formation of false candlestick patterns.
Stop-loss level
Adjust stop loss a few pips below the low of Doji.
Take-profit level
Fibonacci extension tool is used to find out target levels in this trading strategy. Place take-profit 1 at the last swing high of the price. The origin/start of retracement will also act as swing high here.
Now draw the Fibonacci tool and highlight the 1.272 Fibonacci extension level. place take-profit 2 at 1.272 extension level.
Risk management
The minimum risk-reward for the morning Doji star trading strategy is 1:2. The minimum risk you should take is 2% / trade of your total account balance.
Conclusion
The best suggestion to trade this pattern is with the confluence of other technical price patterns. if you are planning to trade doji star pattern alone then you may not become a profitable trader.
Make a habit of reading the price before analyzing and always backtest this strategy at least 100 times to learn it.
FAQs
The best timeframe is 1H, 4H, and Daily.
The first candlestick pattern contains a Doji candlestick whereas the morning star pattern contains a spinning bottom candlestick.