
Introduction
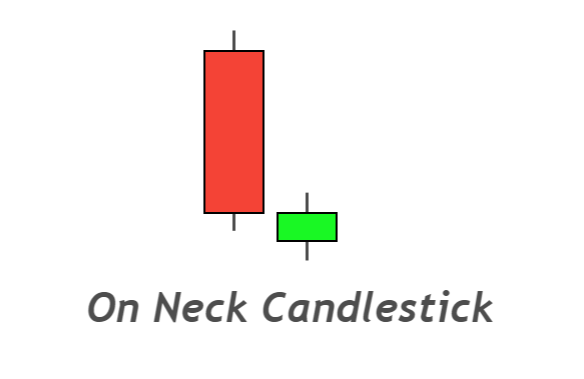
The On-neck pattern is a candlestick pattern in which after a long bearish candlestick, a small candlestick will with a gap down, and it will close near the opening price of the previous big bearish candlestick. This candlestick pattern consists of two opposite color candlesticks.
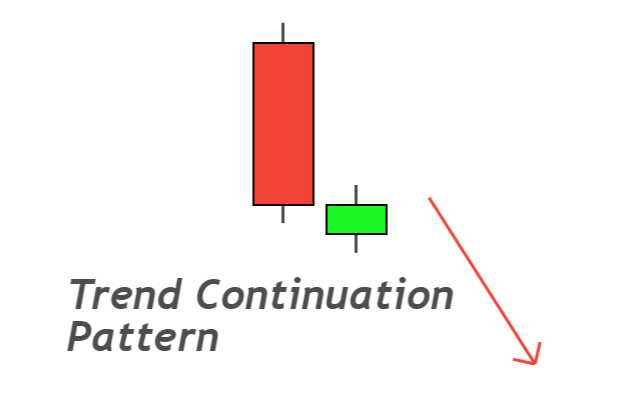
It is a bearish trend continuation candlestick pattern that represents the domination of sellers over buyers in the market. This pattern will usually occur within a downtrend.
How to identify the on-neck pattern?
You need to follow a few requirements to identify a perfect candlestick pattern on the price chart.
Here’s the guide to find the on-neck pattern
- The first candlestick will have a big bearish body with small shadows. It represents that price is in a downtrend. The body to wick ratio should be at least 80%.
- After a big bearish candlestick, a small bullish candlestick will form. It will open with a gap down, and then this candlestick will close at the closing price of the previous bearish candlestick.
- The small bullish candlestick should not close above the 15% of the previous bearish candlestick.
This is called on neck pattern because price always retraces to the neck of bearish candlestick.
On neck candlestick: Information Table
| Features | Explanation |
|---|---|
| Number of Candlesticks | 2 |
| Prediction | Bearish trend continuation |
| Prior Trend | Bearish trend |
| Counter Pattern | Downside Tasuki gap |
The psychology behind the on-neck pattern
The On-neck candlestick pattern forecasts downtrend continuation after a short-term price reversal.
This pattern is based on the fact of impulsive and retracement waves.
The market structure consists of two waves. After forming the impulsive wave, a retracement wave will form and vice versa.
The big bearish candlestick shows a bearish impulsive wave. During this wave, institutional traders will decrease the price value of any asset or currency.
After an impulsive wave, a small retracement wave will form. It is a short-term reversal in trend. The market hardly reached the neck of the bearish wave. Then after this retracement, the price value will decrease again by an impulsive wave.
This is the simple psychology behind this pattern.

Find High Probability Trades with this ADVANCED Candlestick Patterns Course
The Ultimate Candlestick Patterns Course That Will Help You To Trade Better
Best working conditions for the on-neck pattern
To increase the winning ratio of a trade setup, always add the confluences. Such as
- An On-neck pattern should form during a bearish trend. It will not work in the support zone.
- It will work best when the RSI indicator oscillates between 30 to 70 values.
A bearish trendline or moving average can also be used with the on-neck pattern to increase the winning ratio.
The Bottom line
The on-neck pattern includes candlestick patterns in the list that forecast the bearish trend.
The trend continuation candlestick patterns have a high probability of winning technically. I will also recommend you trade using these types of candlestick patterns.
Before trading it on a live account, make sure to backtest this candlestick properly.