
Definition
Order block indicator is a technical indicator that draws zones based on the trading activity of Big Banks or institutional traders.
It is widely used by traders who trade using the order flow trading method. The hidden footprints of institutional traders are revealed using this indicator.
In this article, you will learn to trade with the order block indicator, and at the end of this article, you will get a link to the order block indicator.
What is an order block in trading?
Order blocks represent the orders of institutions and banks as big market orders cannot be filled at once. It will also decrease their profit potential. So, they break one big order into many small orders to maximize profit potential.
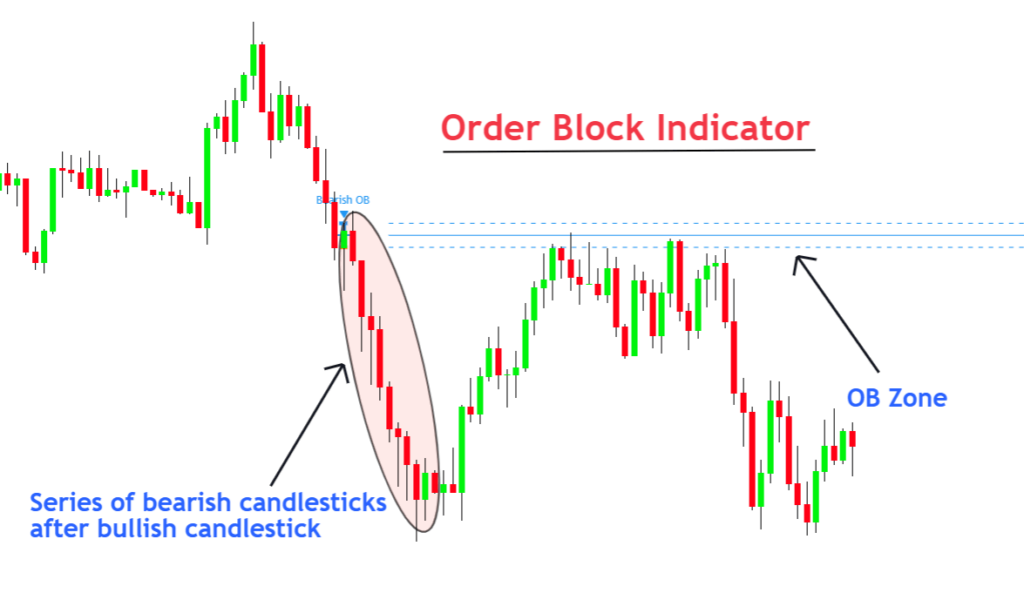
When a series of bullish or bearish candlesticks form on the chart, it shows big players’ order filling.
Big market players choose the levels with a high probability of trend reversals. So, if we become able to find order blocks on the chart, we can find the high probability levels. Those levels can be used for trading.
Types of order block
It is categorized into two types
Bullish order block
When at least five bullish candlesticks form in a series after a bearish candlestick, a bullish order block zone forms.
This logic is already programmed in the order block indicator, so you don’t need to check these conditions each time manually. OB indicator will draw zones automatically.
Bearish order block
When at least five bearish candlesticks form in a series after a bullish candlestick, a bearish block forms on the chart.
How does the Order Block indicator work?
The working principle of this order block indicator is based on the formation of bullish or bearish candlestick in a series, as discussed above.
The OB indicator draws zones on the chart using the conditions of bullish and bearish order blocks.
The zone is drawn using the first candlestick’s open, high, and low.
This indicator will plot lines on the open and high of the first bearish candlestick for the bullish zone. The area between these lines will act as a zone. For the bearish zone, it will use the open and low of the bullish candlestick.
Look at the image below for a better understanding.
Order block indicator settings
In the setting’s indicator panel, you can also adjust the number of candlesticks in series. The default value is 5.
For example. If five or more bullish candlesticks form in series after a bearish candlestick, it will draw a bullish order block zone.
There are many other adjustments you can make in the settings of this indicator.
How to trade using the Order Block Indicator?
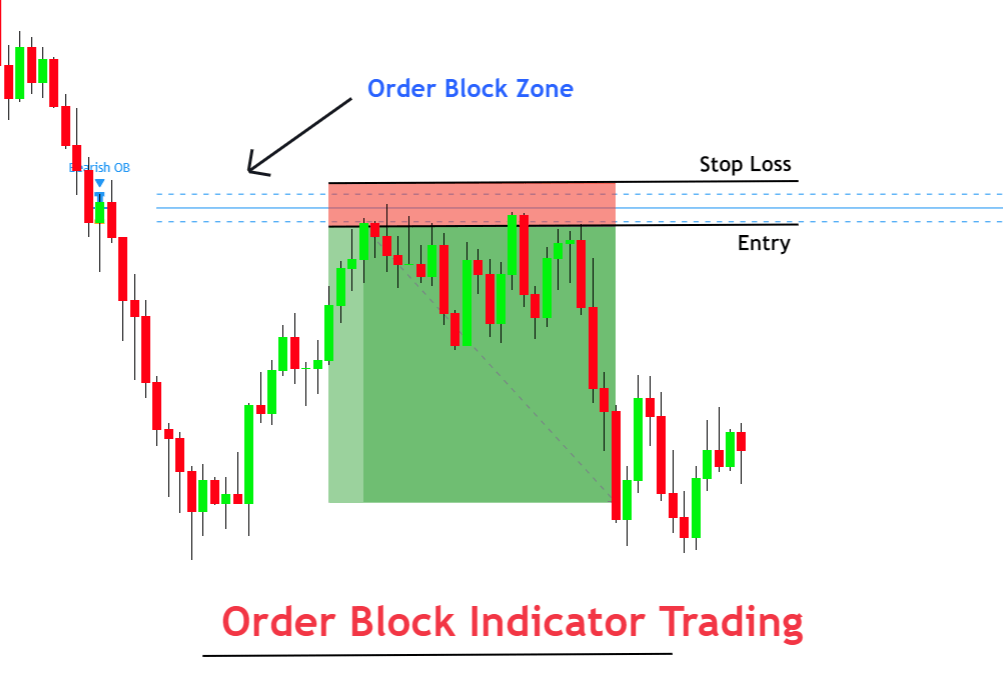
Order blocks are the levels picked as critical levels by the institutions and big traders. These blocks become high probability zones later. That’s why we will use these blocks to open pending buy and sell orders.
Open buy order
When the Bullish order block forms on the chart, the indicator will draw a zone at this level using the open and low candlestick. Then place a buy order 2-3 pips above the zone and set stop loss below.
Open sell order
When the indicator draws a bearish zone, place a pending sell order below the zone and place stop loss above the zone.
The major drawback of this order block indicator is that it does not tell us about the take profit levels. So, it would be best if you used other technical indicators like Fibonacci to project TP levels.
The Bottom line
Order block is a type of price action, and it shows the footprints of market makers. If you want to become a successful trader in trading, you should adopt the market makers’ method. You can know their methods using price action techniques like order blocks.
Order block is also related to supply and demand in trading.
Hello Ali, thanks for your Desciption. The TRadingview INdicator plott the Zone from the Last Bar and not from the first bar in series. What is the official strategy.
The zone is drawn using the first candlestick’s open, high, and low.
This indicator will plot lines on the open and high of the first bearish candlestick for the bullish zone
For the bearish zone, it will use the open and low of the bullish candlestick.
CAn you please tell me which is right A or the B Zone? Thank you
https://icmarketssc.ctrader.com/images/screens/4ZnNn.png
Please can I get the indicator file?
Access the indicator here
https://forexbee.co/order-block-indicators/