
Definition
The overbought oversold indicator is a technical indicator that shows the high-priced and low-priced levels of an asset or currency pair on the price chart.
This is the most famous and common indicator that traders use. Because price always travels in the form of wave-making highs and lows. A thumb rule of trading is that you must sell at the high and buy at the low.
The overbought oversold indicator is used to find the high and low levels on the chart.
Overbought oversold indicators
Different types of indicators are available on the internet that can show the high and low-price zones on the chart. But we will only discuss the top three indicators you should prefer to use in your trading analysis.
- Relative strength index
- Stochastic indicator
- Price action indicator
These are the top three indicators used to identify the overbought and oversold regions on the chart.
Tip: Most traders pick the RSI (relative strength index) indicator, but price action is the best oversold overbought indicator.
Relative strength index (RSI) indicator
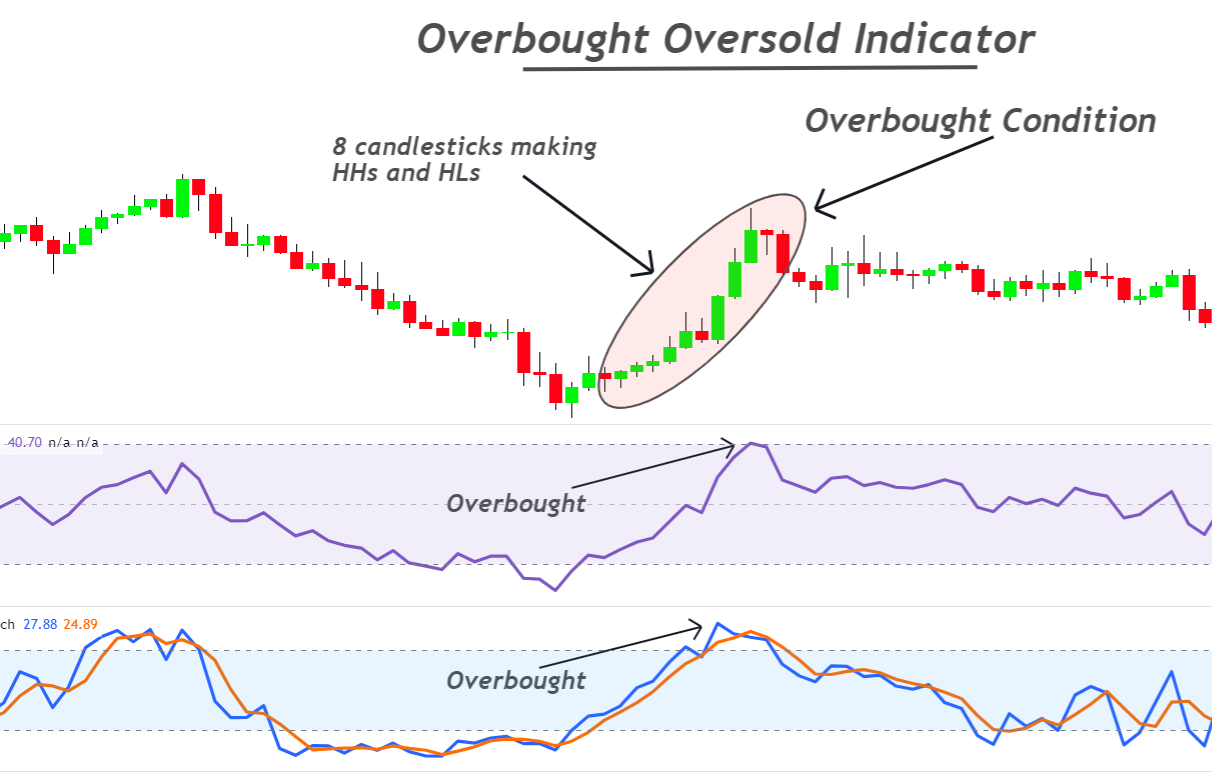
RSI is an oscillator that oscillates between 0 and 100 lines. It is based on average gain and average loss in the past specified number of candlesticks.
By default, 70 and 30 levels are overbought and oversold levels, respectively.
For example, if the price stays above the 70 levels, the price is in the overbought condition. And a bearish trend reversal is expected soon. On the other hand, if the price keeps on falling below the 30 levels of RSI, it means the price is in the oversold condition. And a bullish trend reversal is expected soon.
For optimum results with RSI, I will recommend using 80 RSI levels for overbought conditions and 20 RSI levels for oversold conditions.
Stochastic indicator
Stochastic is an oscillator that compares the single closing price with the range of prices over a specified time interval.
It is similar in action and performance to the RSI indicator. By default, there are two levels specified on the indicator’s window. The stochastic 80 levels are used to identify the overbought condition, and 20 are used for oversold conditions.
According to technical analysis, a sell signal generates when the price crosses the 80-value line in the bullish direction. On the other hand, a buy signal generates when the price crosses the 20-value line in a bearish trend.
Price action indicator
The final and the best technical indicator used to identify oversold and overbought price levels is price action. New or intermediate traders find it challenging to use this indicator because it is not straightforward like the RSI and Stochastics indicator.
There are many methods to find overbought and oversold conditions. I will explain a simple process to determine this.
However, it also depends on the screen time because a professional trader can mention the oversold and overbought regions on the chart with just a single look.
- Apply the HH HL (higher high higher low) and LL LH (lower low lower high) strategy on the candlestick chart.
- If there are consecutively eight higher highs and higher lows on the candlestick chart, then the price is in the overbought condition. On the other hand, if there are eight lower lows and lower highs consecutively, then the price is in the oversold condition.
Look at the image below for a better understanding of this concept.
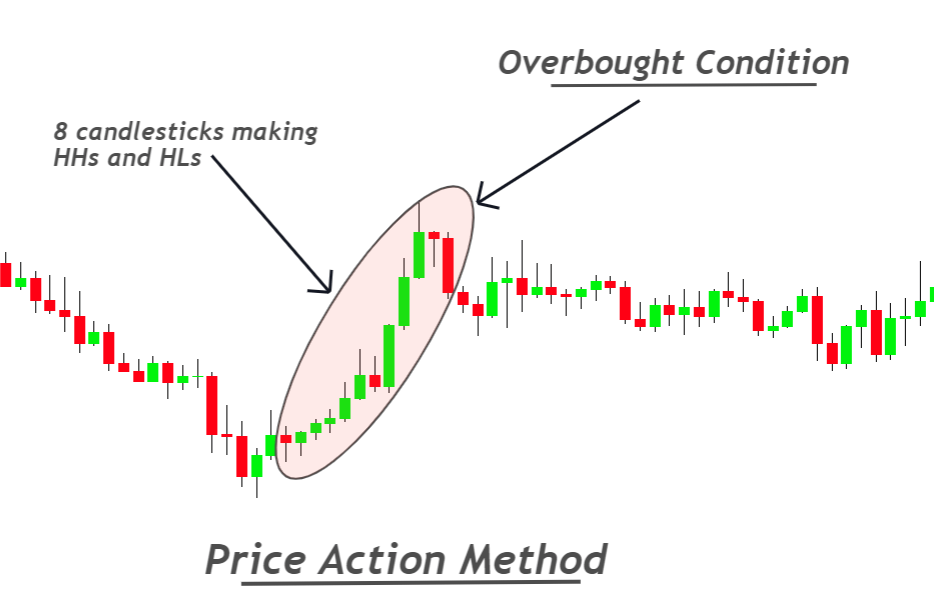
If you love to learn forex by investing your time, the price method is for you.
Importance of overbought oversold indicator
In every trade, overbought and oversold conditions help increase the probability of winning.
For example, you are trading with a strategy forming a sell setup. Still, if the price is already oversold, then the probability of winning or full take profit will decrease. On the other hand, if the price is already overbought, your strategy also makes a sell trade setup. Then both technical tools indicate a bearish direction. This will increase the probability of winning.
That’s why an overbought oversold indicator is necessary for every trade setup.
The bottom line
It would be best to not rely on the technical indicators for trade setups, but you must add these indicators as a confluence to trade setups.
I have explained three major indicators that traders use. There are many other technical analysis tools in the market, but you should prefer these three.
To use the price action method, you should prefer to backtest at least 70 to 100 times before using it for trading on a live account.