
Parabolic SAR is an indicator that is used to identify the end of the recent trends in forex technical analysis. Sar is an abbreviation of Stop And Reverse. It also shows the direction of the current trend in forex.
In forex trading, Entry level is as important as a take profit level. Most retail forex traders always ignore take profit but it is also important to maintain a good risk-reward ratio. PSAR indicator helps in figuring out take profit or exit levels.
How Parabolic SAR works in forex?
The parabolic SAR indicator works by placing a dot above or below the candlestick. The mathematical formula of this indicator is based on the acceleration factor of price and the extreme price value.
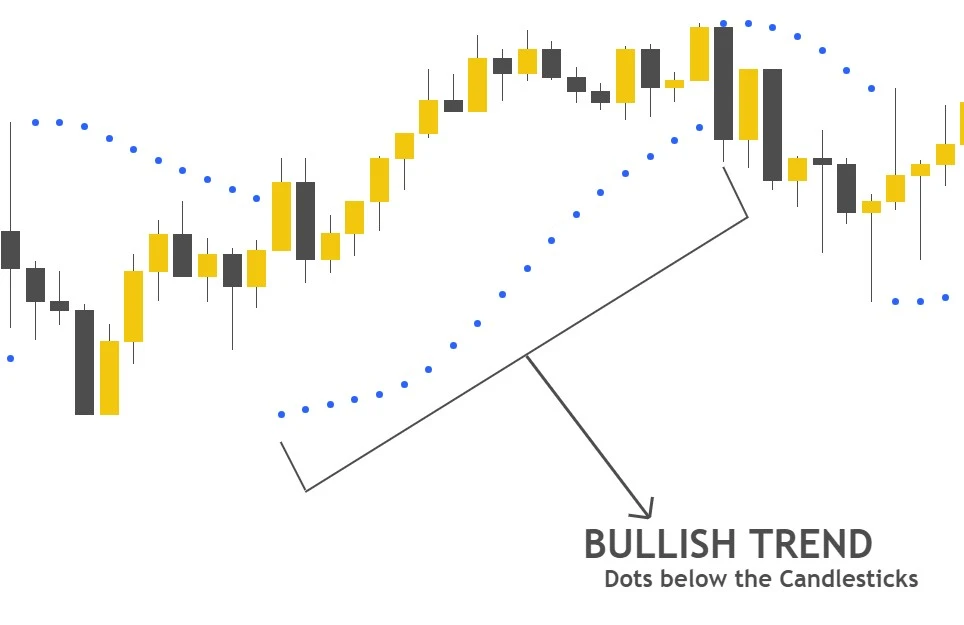
- If dot is placed below the bar by PSAR indicator, then trend is bullish
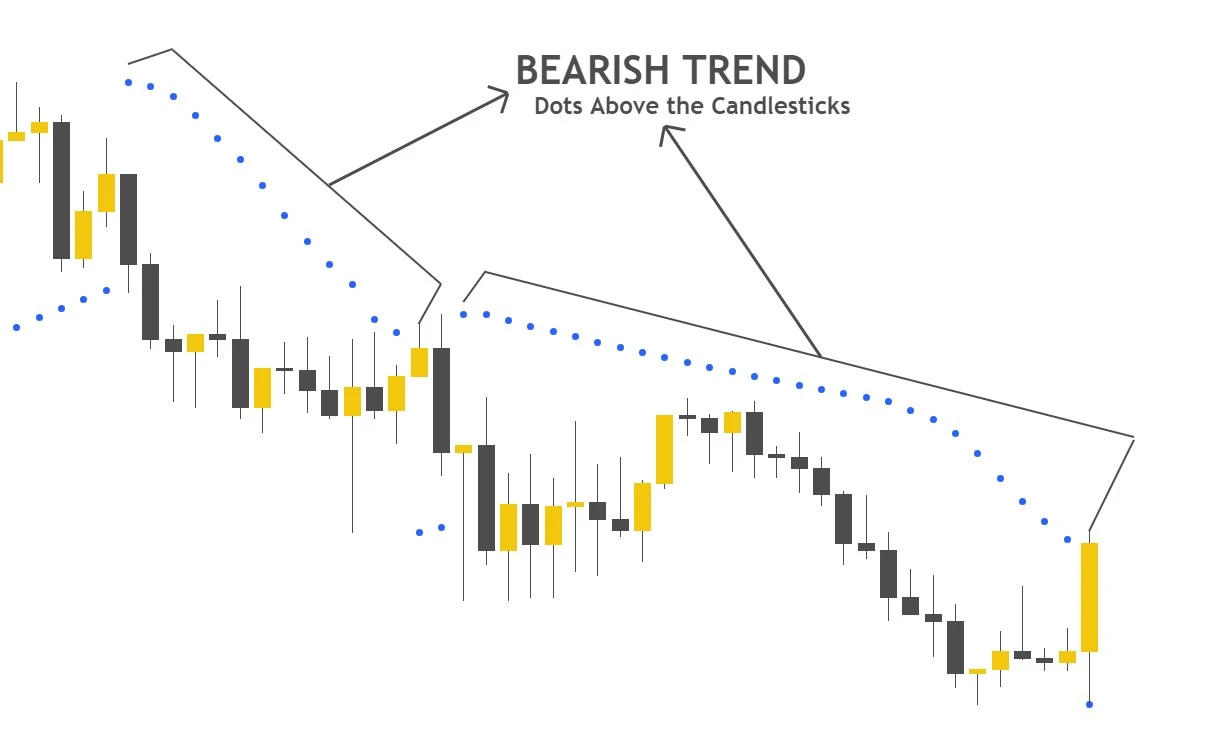
- If dot is placed above the bar by PSAR indicator, then trend is bearish
How to use PSAR indicator?
If the indicator is placing dots below the bar in a series but after placing few dots, the next dot appears above the candlestick then it shows that the bullish trend has been ended. Reversal of dots from above to below the candlestick indicates the end of the bearish trend.
This indicator is very simple to use but only in the trending markets. In a ranging market, it will not work at all because this indicator is basically designed to determine trend direction and end of a trend. Do not use Parabolic Sar indicator in the choppy market in forex trading
Parabolic SAR trading strategy
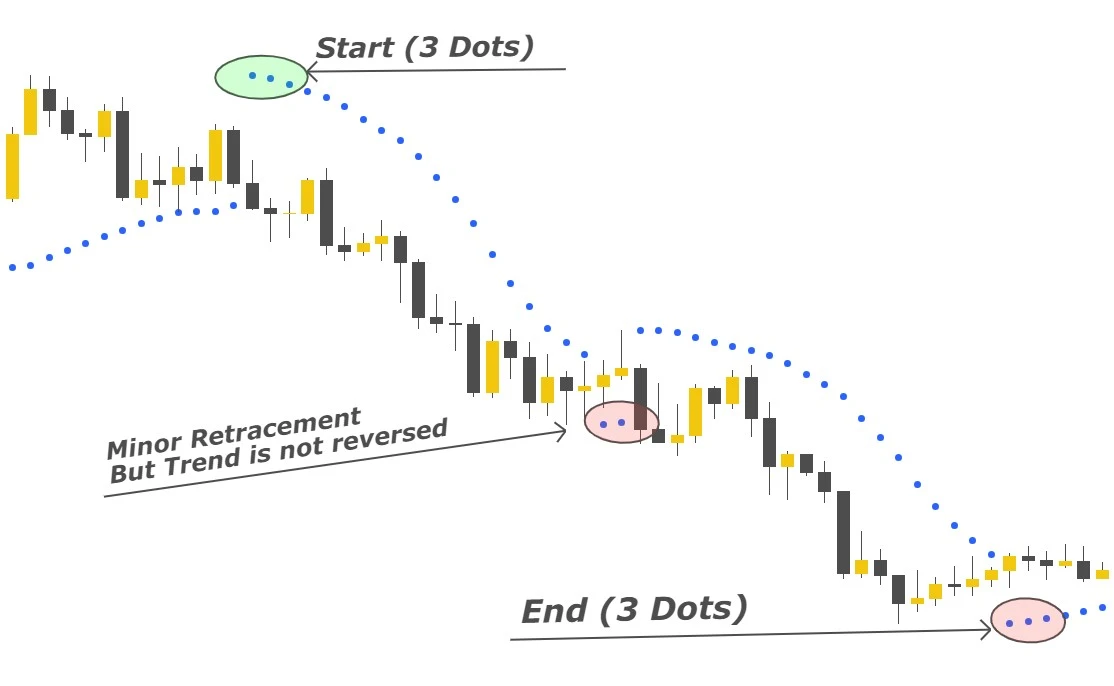
Use the three dots formula to trade forex using the parabolic SAR indicator. For example, the indicator is forming dots below the candlestick in series but after few dots, the next dot appears above the candlestick. But we will wait for at least three consecutive dots above before taking any decision of reversal.
Because during minor retracement in price, parabolic SAR indicator can reverse its direction for a short period of time. That ‘why, wait for the formation of at least three reversal dots and then enter or exit a trade.
Parabolic SAR and Price Action
I will recommend using parabolic SAR to determine take profit level or trade exit level. Because relying totally on a mathematical formula will not make you profit in forex trading. By using the three dots formula with price action strategies will increase the winning ratio of a strategy.
Price action is the leading indicator. We will use price action for trade entry and PSAR for the exit. For example, in trendline breakout strategy, opening position just after breakout and then using PSAR to identify take profit level or exit level. Like waiting for three dots reversal and then closing trade.
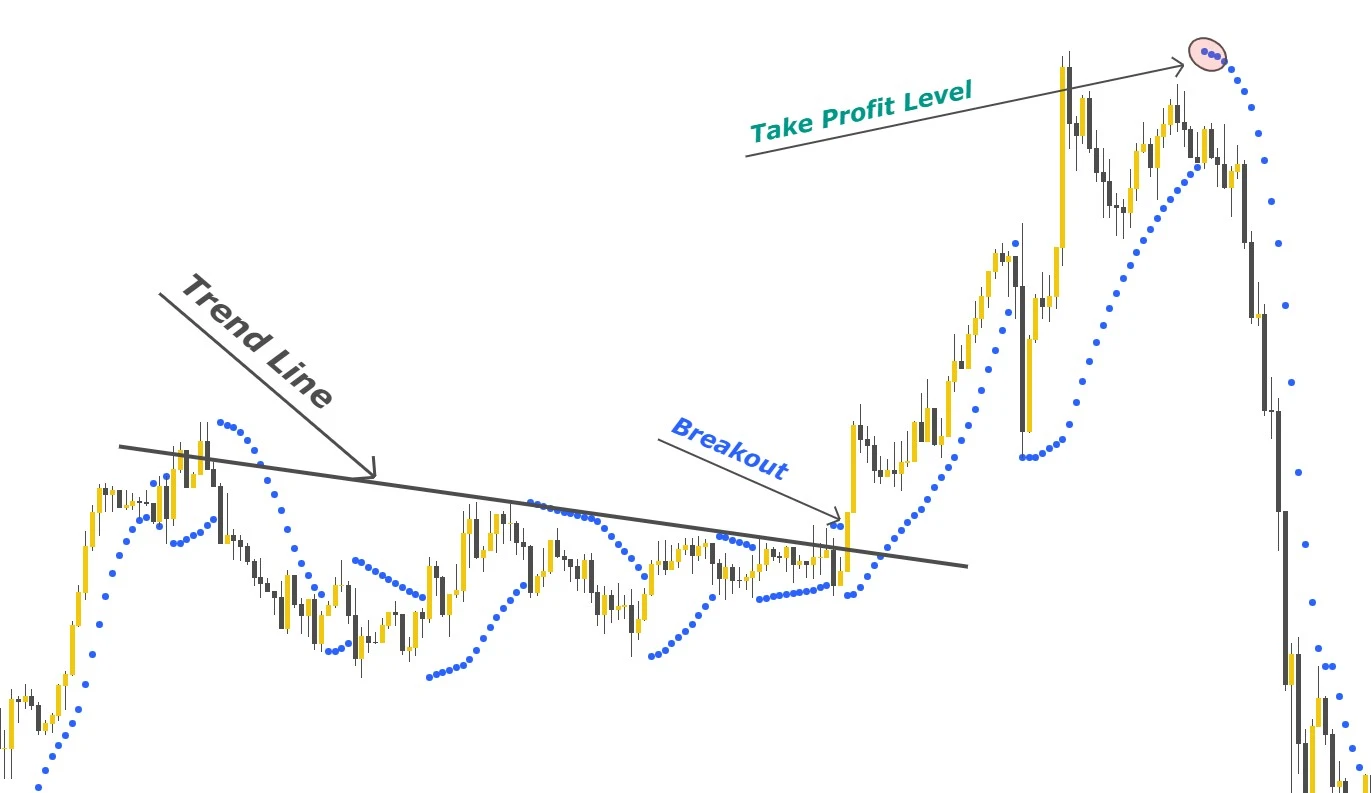
By using this method, sometimes you will get a high reward ratio during a strong trending market after the breakout. Because you will hold your position until the indicator does not show a sign of trend ending.
Parabolic SAR works best for swing trading like in H1 or any higher timeframe. It can also be used for intraday trading like 15min but the best timeframe for Parabolic SAR is H4 or 4-hour.
Parabolic SAR is a lagging indicator because the mathematical formula is used in it. The only leading indicator in technical analysis is price action.
Reading Price Action is the Best Strategy
forexbee
I hope you will like this Article. For any Questions Comment below, also share by below links. Tradingview is the best chart tool
Note: All the viewpoints here are according to the rules of technical analysis and for educational purposes only. we are not responsible for any type of loss in forex trading.