
This article is about to draw on the chart. After a basic introduction of variables and identifiers, now we will learn about drawing on the chart. The beauty of pine script is that it has many built-in functions. This feature makes it easy for a beginner or intermediate programmer to code an indicator or strategy easily.
Overlay in pine script
Overlay is used to plot either on the chart or in a separate window in the pine script. It is Boolean and accepts only true or false. By default, overlay is set to the false value in the pine script.
- If overlay is set to false, then the indicator will open in a separate window on the chart in tradingview.
- If overlay is set to true, then the indicator will open in the same window in tradingview.
Plot () function in pine script
This is most important function because it will draw output of the program on the chart. Plot function accepts series in its input.
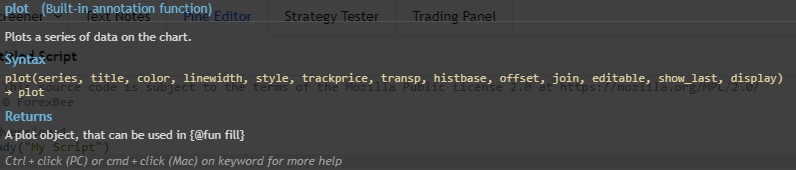
For example, A program is made of many functions and calculations. We will not plot each calculation on the chart but only required one. So, it is important to check the output of a calculation or custom-made function. Because once you made a program then it will become difficult to handle small mistakes in calculations.
There are a few parameters in plot function that can be edited to get desired output on the chart.
- Series
- Title
- Color
- Linewidth
- Style
- Transp
- Trackprice
- Offset
- Histbase
- Join
- Editable
- Display
Series
A series variable that is to be plotted on the chart. For example, a close series that will plot closing prices of each candlestick.
Title
Title includes any statement within double quotes. Double quotes mean string. It shows the indicator or strategy name on the chart.
Color
This parameter is used to assign a color to an indicator. For example, green color for bullish line and red color for bearish line.
Line width
This parameter is used to change width of line. Units are in pixel. So, 1 pixel means 1 dot on screen.
Trackprice
The track price parameter is used to draw a horizontal line on the current price on each tick. So it will be easy for us to track the price by seeing a line on a big chart.
Style
It is used to draw histogram on the chart.
Transp
The transparency parameter is used to make the indicator transparent. Its input is integers from 0 to 100. 100 means 100% transparency so you will not be able to see the indicator line on the chart. 0 means 0% transparent.
Offset
This feature will offset the indicator by a specific number of bars. -10 means it will offset the indicator to left by 10 bars. +10 means it will offset the indicator to right by 10 bars.
Join
It is a built in Boolean variable. It is used to plot figures like stars on the chart.
Editable
Editable is a built-in bool variable that is used to access settings in the style section of the indicator. If it is true, then you can easily change style settings later.
Histbase
This variable simply takes the histogram and plot it at 4000.
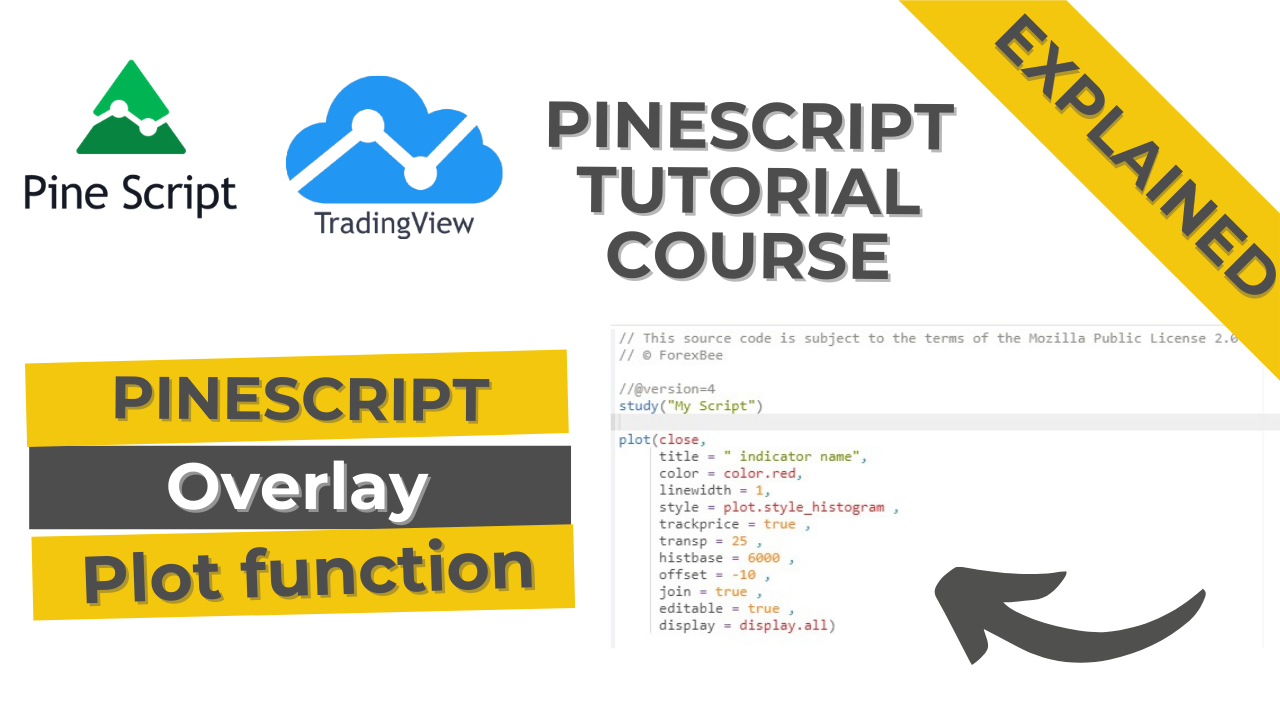
// This source code is subject to the terms of the Mozilla Public License 2.0 at https://mozilla.org/MPL/2.0/
// © ForexBee

//@version=4
study("My Script")

plot(close,
     title = " indicator name",
     color = color.red,
     linewidth = 1,
     style = plot.style_histogram ,
     trackprice = true ,
     transp = 25 ,
     histbase = 6000 ,
     offset = -10 ,
     join = true ,
     editable = true ,
     display = display.all)
I hope you will like this Article. For any Questions Comment below, also share by below links.
Note: All the viewpoints here are according to the rules of technical analysis. we are not responsible for any type of loss in forex trading.