
Definition
The pivot point indicator is a technical analysis indicator that identifies the support and resistance price levels of a candlestick based on the high, low and closing prices.
Retail traders use the pivot point indicator to determine the support resistance price levels on higher timeframe candlesticks and then trade those levels on the lower timeframes. It is a perfect tool for finding the high probability key levels that will turn the market trend.
This post will explain the pivot point indicator from A to Z, including uses, trading strategy and advantages. So make sure to thoroughly read the post without missing any steps.
How to find pivot points on the candlestick chart?
Pivot points do not mean it is a point on the chart, but it represents a price level from where the market can take a trend reversal or bounce from that price level. It is also used for finding the direction of bullish and bearish sentiments.
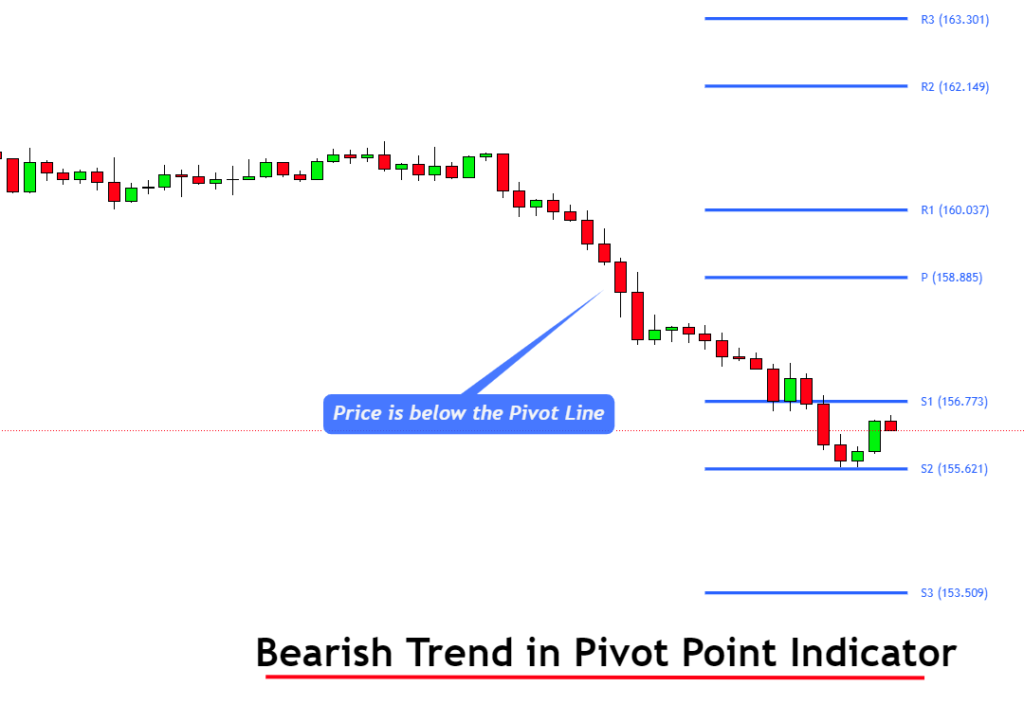
If the price is below the pivot line, it means there is a bearish trend, and bears are stronger than bulls.
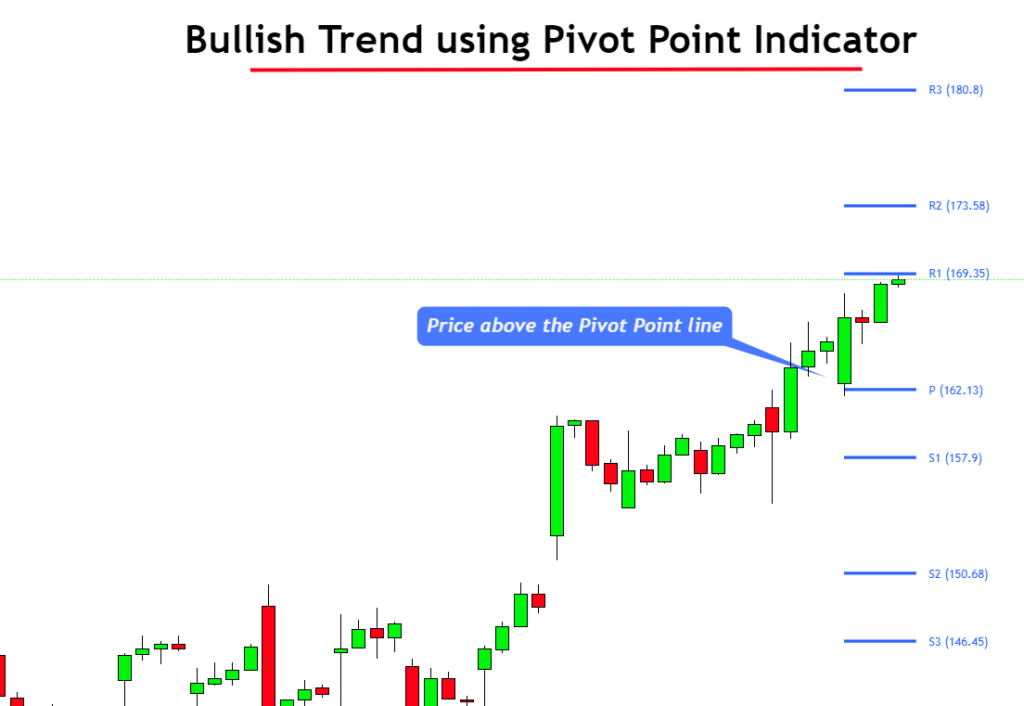
While the price is above the pivot line, it represents that the bulls are stronger than the bears and that there’s a bullish trend in the market.
However, finding the support and resistance using the pivot points indicator is advantageous compared to finding the trend using this indicator.
Formula
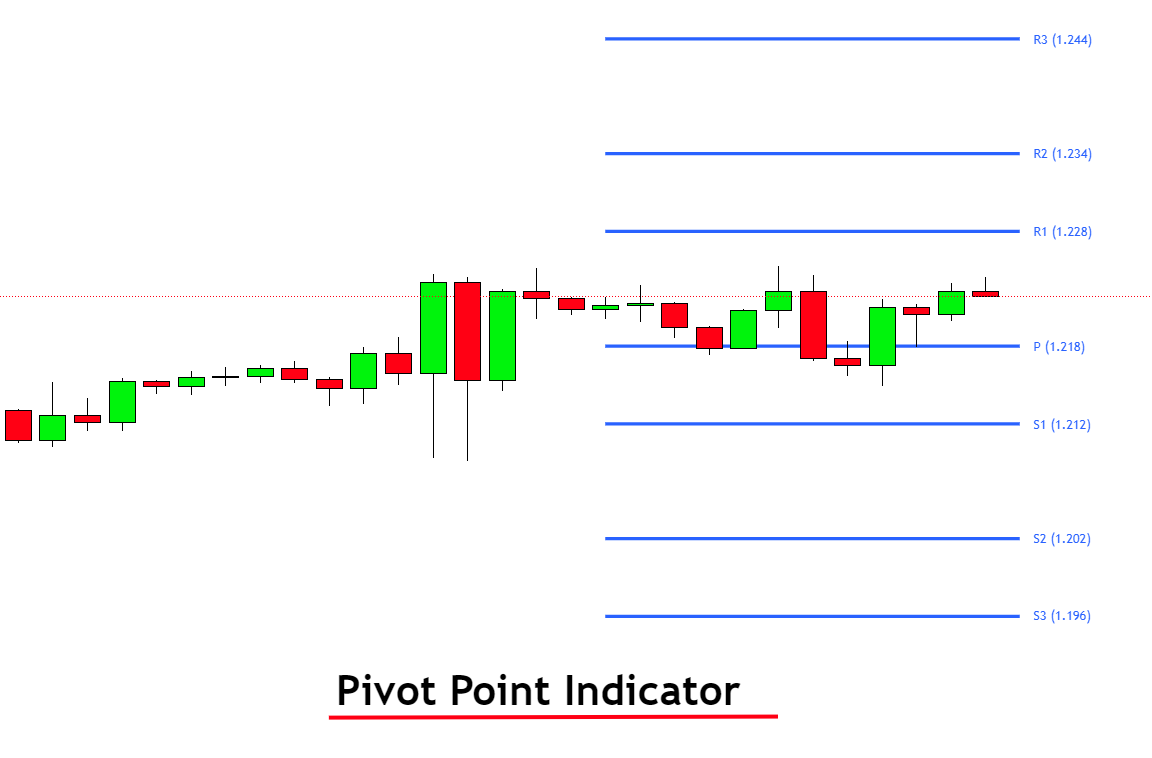
The pivot point indicator draws 7 lines, in which three lines represent the support level and three lines show the resistance level. S1, S2 and S3 denote the support levels, While R1, R2 and R3 denote the resistance levels.
The pivot point formula is as follows:
Pivot Point = (High + Low + Close)/3
Here High means the highest price of the candlestick
Low means the lowest price of a candlestick
Close means the closing price of the candlestick.
This formula is to draw the pivot line.
Calculations
The support and resistance levels have different formulas. There are made by using the pivot point formula.
- Resistance 1 = (2*pivot point) – lowest price of the candlestick
- Resistance 2 =Pivot point + (High – Low)
- Resistance 3 =High +2(pivot point – Low)
- Support 1 =2*(pivot point – High)
- Support 2 = Pivot point – (High – Low)
- Support 3 = Low – 2(High – Pivot point)
These formulas are used to find the candlestick chart’s support and resistance levels.
Best timeframe to use pivot points indicator
Finding the best timeframe for the pivot points indicator depends on your trading strategy and timeframe because the pivot point indicator is always drawn on the higher timeframe candlestick.
Here are the recommended best timeframes:
| Trading Type | Timeframe |
|---|---|
| Scalping | 30M & 1H |
| Intraday trading | Daily |
| swing trading | Weekly |
| position trading | Monthly |
These settings are for new and intermediate traders. You can also draw the custom pivot levels without switching to higher timeframes. Just pick the High, Low and closing prices of a specific time range and then put those values in the pivot point calculator. That calculator will automatically calculate the price levels you need to look for in the technical analysis.
How to trade with the pivot point indicator?
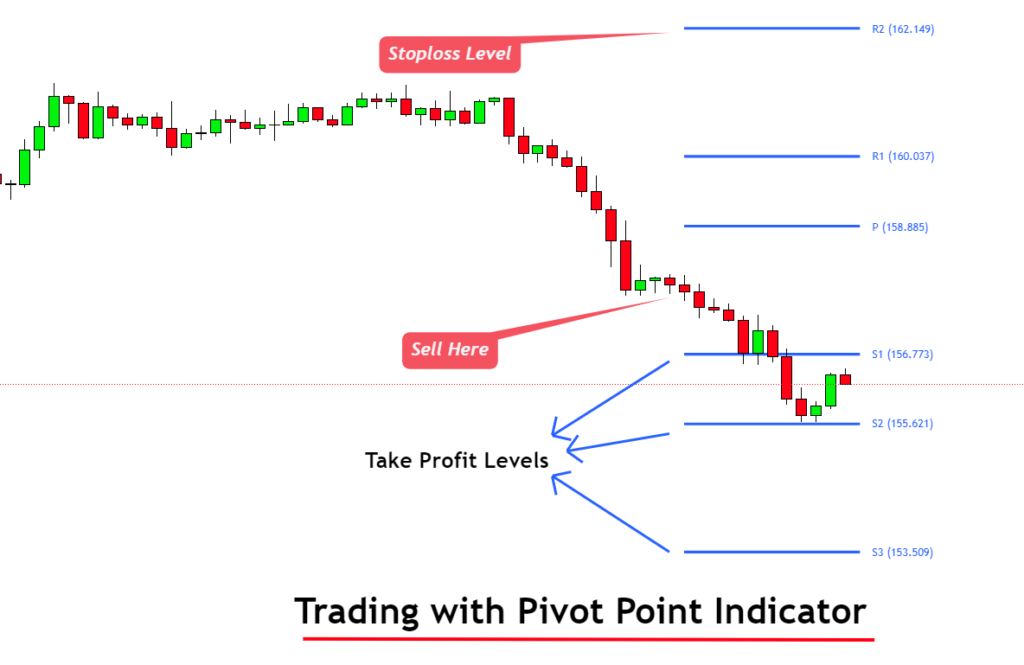
There are many ways to trade with pivot points indicator. However, the best way is to use them as trade exit and reversal levels.
For example, if you open a buy trade using a specific trading strategy, you can use the R1, R2 and R3 as three take profit levels using the partial take profit strategy. On the other hand, if you open a sell trade, you can use the S1, S2 and S3 as three take profit levels.
If you’re a trend reversal trader, you can open buy trades from the support levels and take profit at resistance levels. You can also use the moving average with the pivot point indicator. This will improve the winning probability.
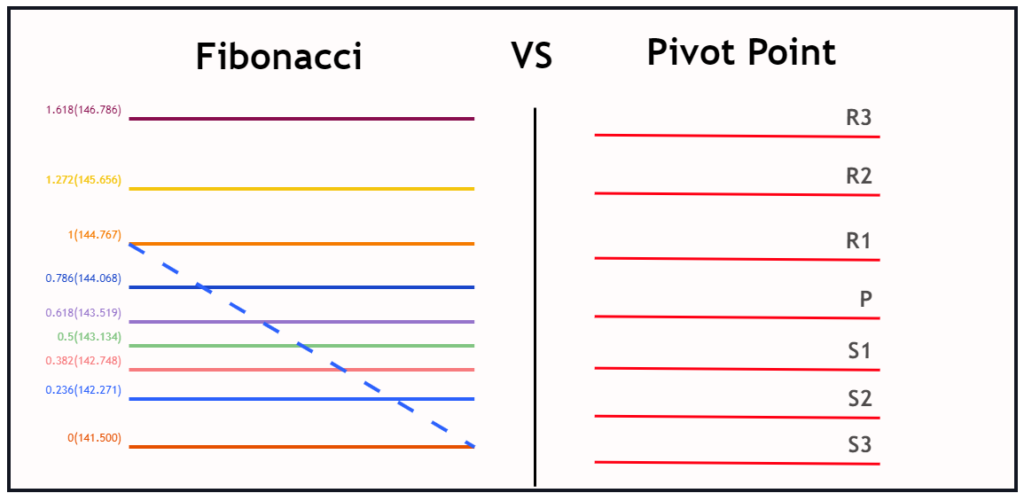
Differences and similarities between Fibonacci and pivot levels
Fibonacci levels are made from the Fibonacci sequence in nature. I mostly use the Fibonacci golden zone in technical analysis. Pivot points are made from the average formula. But both indicators are helpful.
I will highly recommend using that price level at which fibonacci golden zone and pivot point levels overlap. Due to the overlapping of both indicators, that price level becomes a high probability price level, and there are more chances of reversal from such price levels.
Fibonacci and the pivot point indicator plot the stop loss and take profit levels. In the pivot point indicator, the support levels are used for entry and stop loss, while resistance levels are used for taking a profit. However, the Fibonacci retracement levels are used for order entry and stop loss, while the Fibonacci extension levels are used for trade target levels.
I will also recommend you read about the Fibonacci tool in detail. It will also help you in analysing the market.
The bottom line
It depends on your trading strategy that decides which indicator to use. However, if you are a day trader, this pivot point indicator will give you a lot of benefits in managing your trades. It is super easy to set stop loss and take profit levels with the pivot point indicator.