
Definition
QM Pattern is a chart pattern that shows the formation of higher highs, lower lows, and a left shoulder level. It is also known as the Quasimodo pattern.
It is the most advanced chart pattern used to identify trend reversals in the market. QM will increase the risk-reward ratio of a trade setup with pinpoint entries.
If you want to learn this Pattern, then you should also read the supply & demand trading guide to enhance the potential of this chart pattern
How to identify QM pattern?
On the price chart, when a higher high and lower low will form, then a QM pattern will occur.
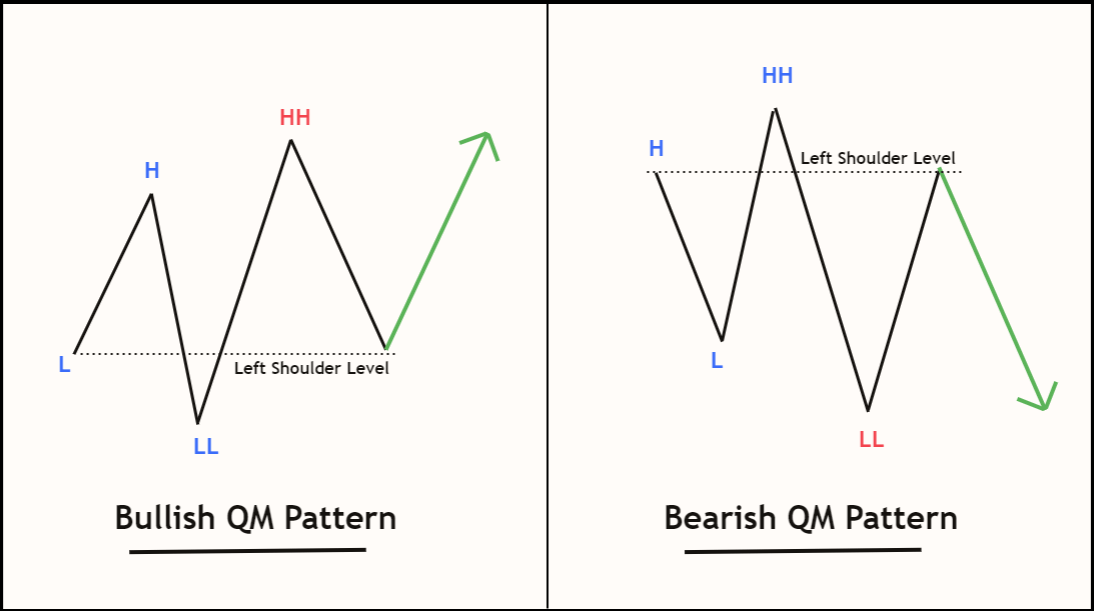
Here is the image of the Quasimodo pattern.
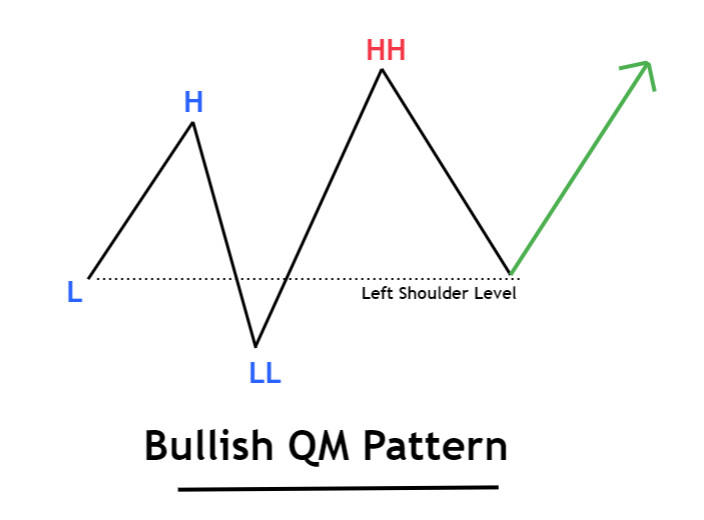
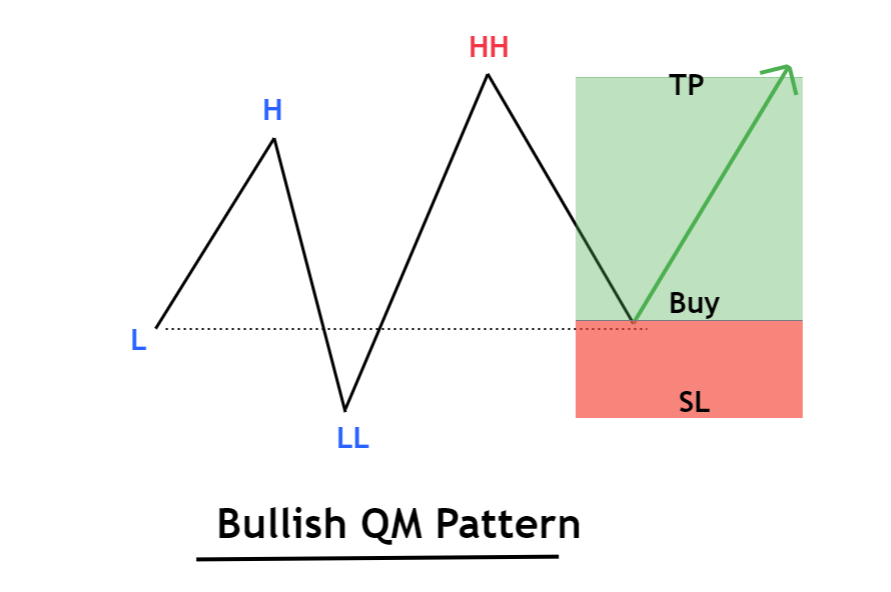
Bullish QM pattern
To identify the bullish Quasimodo pattern, follow the following guidelines:
- Formation of HH and LL.
- The last price low will act as left shoulder level.
- After a higher high, the price will retrace to the left shoulder level and then it will continue bullish trend.
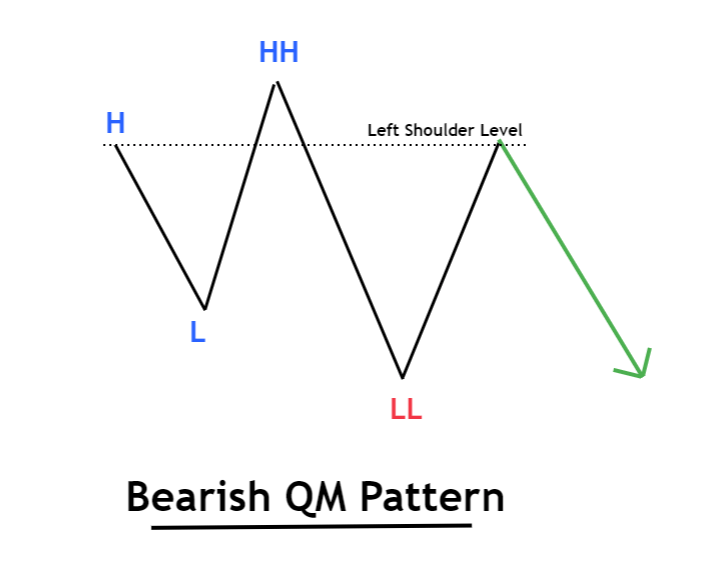
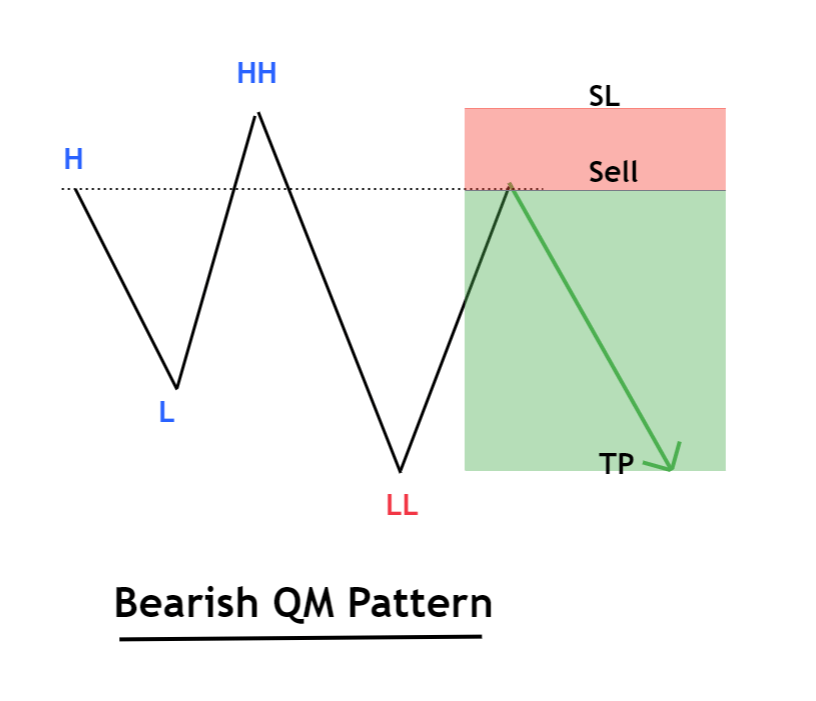
Bearish QM pattern
- Formation of HH and LL.
- The last price high will act as left shoulder level.
- After a lower low, the price will retrace upward to the left shoulder level and continue the bearish trend.
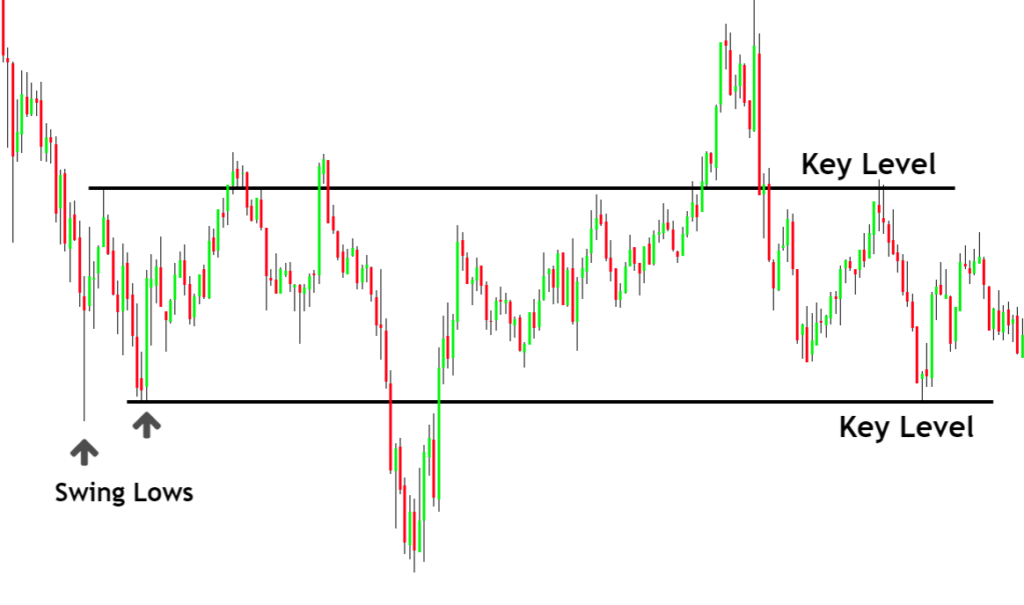
What is left shoulder level?
In technical analysis, the historical swing levels always act as significant strong levels. A swing level is originated from the swing point. And a key level is generated from swing points.
The left shoulder is a key level that can turn the price trend.
After forming a lower low or higher high, there is already a probability of trend reversal, but you should wait for the best price level. And left shoulder is the best price level.
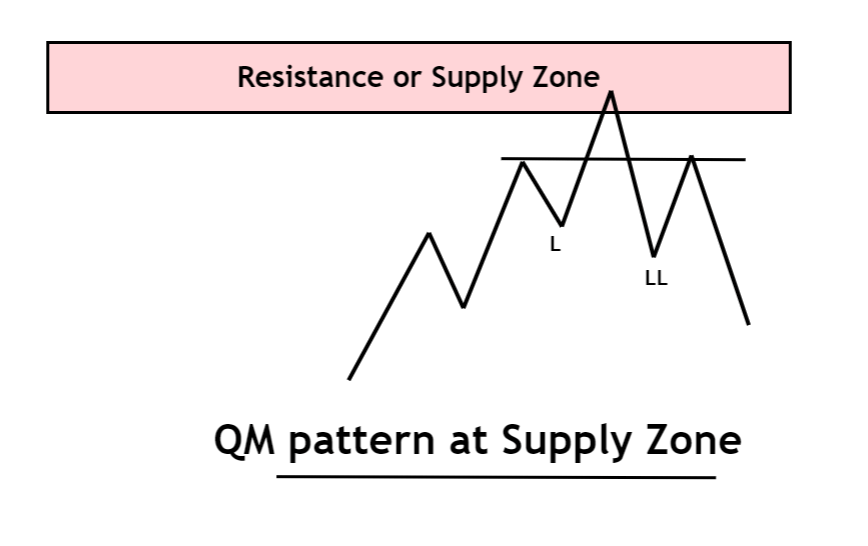
Best Location of Quasimodo pattern on the chart
The location of a chart pattern matters a lot in technical analysis. It can help you to filter good traders from crowed.
- A bullishpattern should form at the support zone or demand zone.
- A bearish pattern should form at the resistance zone or supply zone.
- It should not be traded during the ranging market conditions.
How to trade QM pattern?
A Quasimodo trading strategy consists of technical analysis tools like supply-demand zones, flag limit, FTR (fail to return), balance imbalance areas, etc. But in this article, we’ll cover only basic methods to trade Quasimodo pattern.
That’s why it is recommended to learn the advanced Quasimodo pattern by clicking here.
Buy signal
In a bullish QM pattern, highlight the left shoulder level after higher high formation by adding a horizontal line or zone at the second last lower low made by price. Place a Buy limit order at the left shoulder level and wait for the price to fill the pending order.
Place stop loss below the last lower low. The higher high of QM pattern will act as a take profit level.
Sell signal
After the lower low formation of bearish QM Pattern, insert a horizontal line at the left shoulder level or the second last higher high. Open a Sell limit order at this left shoulder level and wait for the price to fill this order.
Place stop loss above the last higher high. The lower low of QM pattern will act as a take profit level.
The Bottom line
QM pattern is the most advanced form of price action, and professional traders use it to forecast the market. You will get many QM pattern signals on the chart. Still, there will be few winning signals because you can increase the winning probability by adding other technical tools like FTR, flag limit, compression, and Fibonacci.
But first, you need to master a simple QM pattern then you should progress step by step to make the best trading strategy.
Pls I want to know how to always spot the W or M chart patterns,the same way you explained how to get the QM chart patterns
Whats the best way to trade it on multi time frames ?
I made it look simple thank you so much. God bless you
Best sir
Very educative. Thank you.
Merci beaucoup❤