

Definition
QQE is a technical indicator that identifies the overbought and oversold levels using a smoothed RSI line in technical analysis. QQE is an abbreviation for quantitative qualitative estimation.
The quantitative, qualitative estimation indicator originates from the relative strength index. In reality, it is the more advanced form of RSI indicator. Traders use this indicator to make critical decisions while forecasting a currency pair. It is not a well-known indicator as compared to the RSI indicator. So if you’re trading using the RSI indicator, I will also recommend using the QQE indicator in trading because it can improve your trading and is a more advanced form of the RSI indicator.
How does the QQE indicator work?
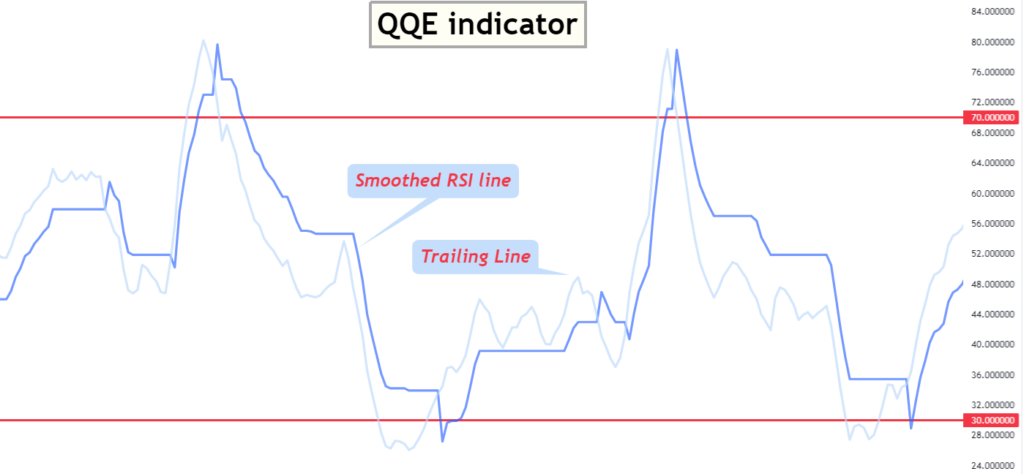
The QQE indicator works by using the two lines that oscillate between 0 to 100. These two lines are the following:
- smoothed RSI line
- trailing line
These two lines run side by side, and these line generates many indications. I will discuss all benefits of using this indicator, and at the end of the article, I will also explain a trading strategy using the qqe indicator.
Let’s first discuss the best settings and indicator formula then I will explain the information step by step.
Best settings for QQE indicator
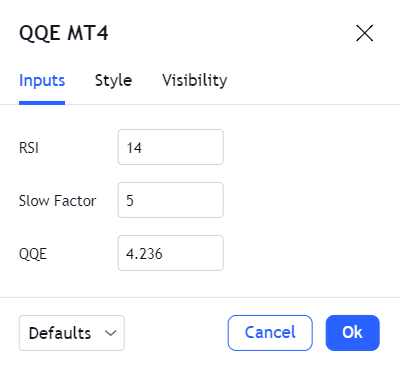
Here is the table containing the optimum settings for the QQE indicator
| Inputs | Values |
|---|---|
| RSI | 14 |
| Exponential moving average | 5 |
| Fibonacci value | 4.236 |
The formula of the qqe indicator includes the calculations of the relative strength index, exponential moving average and Fibonacci extension level.
Characteristics
the QQE indicator can be used in many ways in technical analysis. It depends on the trader and trading strategy.
- The QQE indicator determines the direction of the trend of the market.
- It finds the overbought and oversold levels,
- it identifies the potential trend reversal points of the market using divergence.
- Trend reversal can also be determined using the crossover of smoothed RSI and trailing line
These are four major benefits of using this indicator.
Now I will explain each step in detail. After this, I will explain a trading strategy using the price action and the QQE indicator.
Trend
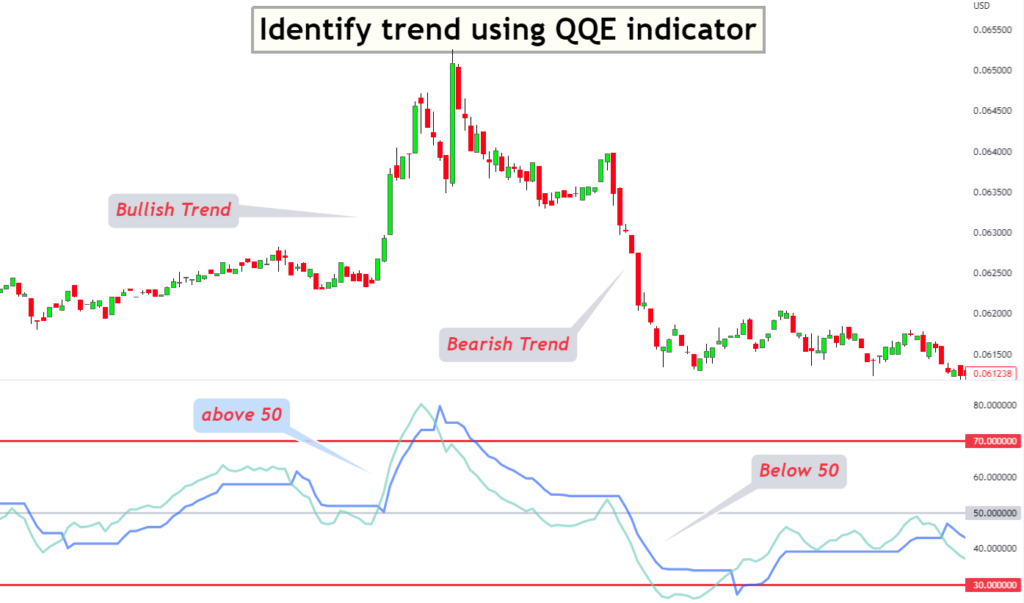
in the price action, the trend is bullish if the market makes higher highs and higher lows. However, you can also use the QQE indicator to determine the trend.
- If the value of the QQE indicator is above the 50 value, then it means the trend is bullish
- If the value of the QQE indicator is below 50, then it means the price trend is bearish
This is the simplest way. However, I will also suggest you use the higher highs, higher lows, lower lows and lower highs method.
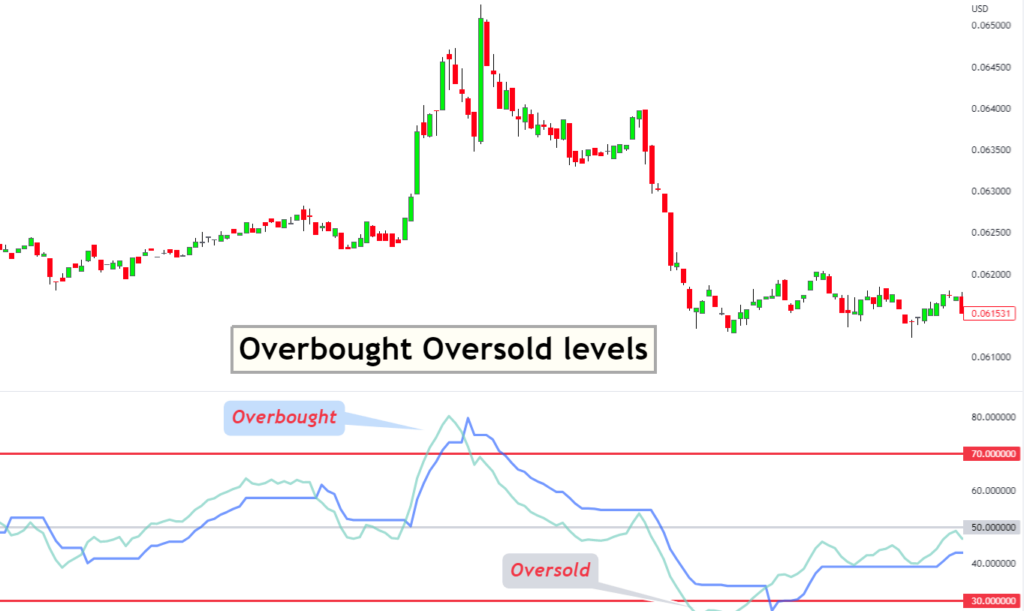
Overbought and oversold levels
Like the RSI indicator, the QQE also fonds the overbought and oversold levels. The main benefit of this indicator is that it has a very smooth RSI line. It means the chances of false signals are lower in the QQE indicator. It has a bit of lag compared to RSI but i think it’s a good point because it will prevent you from early opening and closing trades. So you will be able to take maximum profit from the market.
I am not guiding you here to rely entirely on overbought and oversold levels. This is just for information purposes. At the end of the article, I will explain trading strategy using the confluence of candlestick patterns with the overbought and oversold levels. This will let you choose only high-probability trade setups.
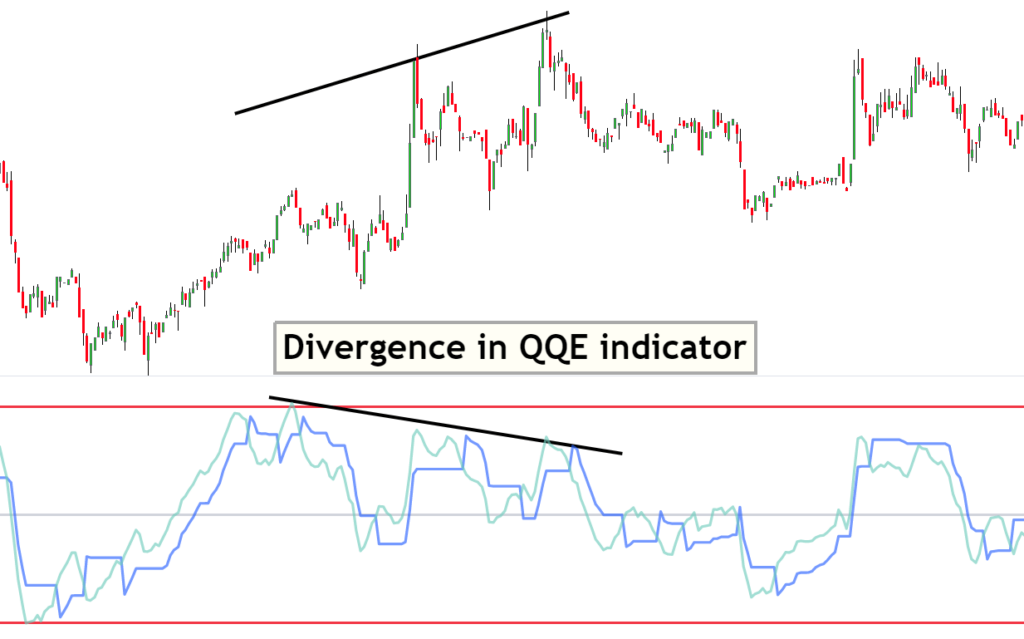
Divergence
Another method of trading with the QQE indicator is by using the divergence. Divergence is the opposite behaviour of price action and the indicator line.
So when the price keeps increasing while the indicator value decreases from the overbought region, this is called the bearish divergence of the QQE indicator. This phenomenon represents that a bearish trend reversal will happen.
On the other hand, if the price keeps on moving down while the qqe indicator value keeps on increasing from the oversold region, this is called bullish divergence. This phenomenon shows that a bullish trend reversal will happen.
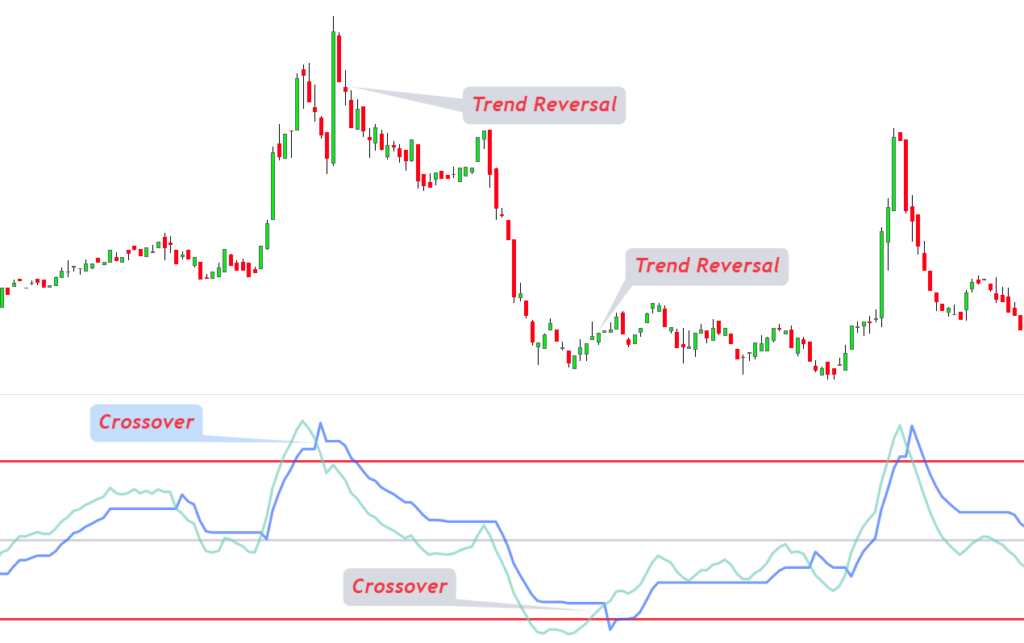
Crossover
The fourth method of identifying the trend reversal using the QQE indicator is by crossover method.
As the indicator consists of two lines. Smoothed RSI line and trailing line. The crossover of these two lines indicates a trend reversal.
- A bearish trend reversal happens when the smoothed RSI line crosses the trailing line from the upper side.
- A bullish trend reversal happens when the smoothed RSI line crosses the trailing line from the downside.
These are the four major usages of this indicator. It is a very useful indicator if trading with price action.
Now let’s come to the central part, which is the trading strategy.
How to trade using the QQE indicator?
Trading with the QQE indicator is very easy using the above four methods. Just buy and sell using fixed rules. But according to my experience, this is not a way to become a profitable trader. However, you can use the above four methods for technical analysis, but I will not recommend them for trading. You can also backtest the above easy methods.
Here I will teach you a price action method with the combination of the QQE indicator. in this method, we’ll use the confluence of candlestick pattern and QQE overbought/oversold levels.
Open the buy order
- First, check the value of the qqe indicator, and it must be below 30.
- In the oversold region, find bullish candlestick patterns like a pin bar or bullish engulfing.
- Open a buy order after forming a bullish candlestick pattern and add stop loss below the swing low or a few pips below the candlestick pattern.
- Close the trade when the qqe indicator crosses the 70 levels.
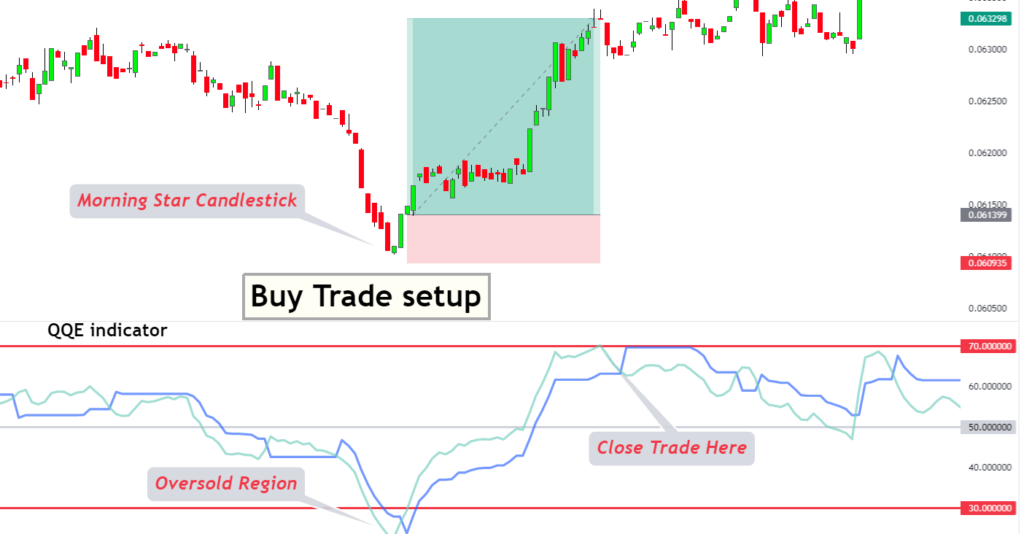
Pro Tip: you can also switch to the nearest timeframes for finding candlestick patterns. Also breakeven the trade once QQE indicator crosses the 50 level.
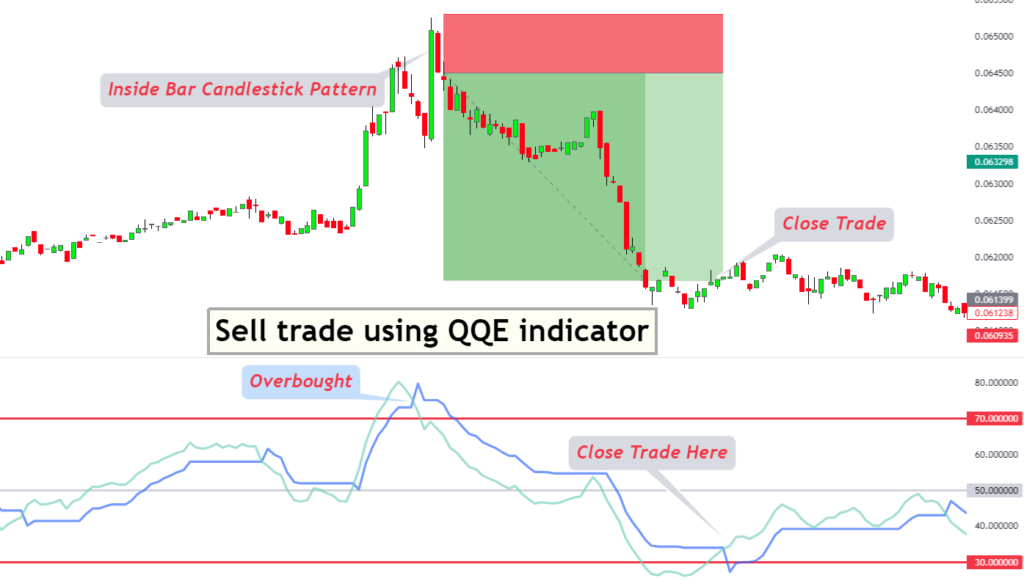
Open a sell trade
- Check the value of the qqe indicator, and it must be above 70 levels (overbought conditions).
- During the overbought condition, find our bearish candlestick patterns.
- Open a sell order after forming a bearish candlestick pattern and place stop loss above the swing high or above the high of the candlestick pattern
- close the trade once the qqe value decreases below the 30 levels.
This is a simple and high-probability trading strategy. I will not teach the risk management strategies here it will be discussed in other posts on the blog.
Conclusion
The QQE indicator is an alternative to the RSI indicator. I will suggest using the QQE indicator in trading. However, the confluence of price action is a mandatory step. Without price action, becoming a profitable trader for retail traders is difficult.
You should learn from my experience. I have invested much time in trading, and you should not waste your time. Instead, invest time in the things that work.