
Definition
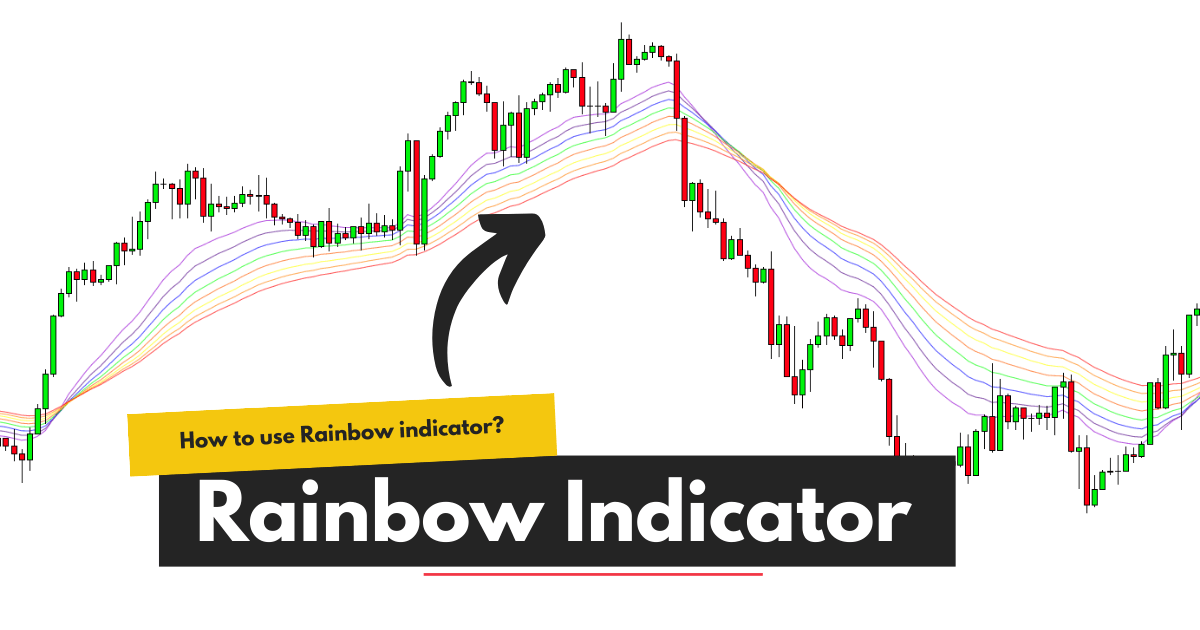
A rainbow indicator is a technical indicator that draws ten simple moving average lines of different colors like a rainbow to determine the trend direction.
It is a beginner-friendly indicator, making it easy for beginner traders to determine the direction of market trends. Finding bullish and bearish trends is an essential first step in technical analysis. So if you’re failing to identify the trend correctly, then you won’t be able to do a high-probability technical analysis of any currency pairs. But the Rainbow indicator makes it simple and super easy to find the bullish and bearish trends.
I will explain complete guidance about the rainbow indicator, so read the article thoroughly without missing any step.
How does the rainbow indicator work?
There are no complex formulas behind the rainbow indicator, but it consists of 10 moving averages line. Each simple moving average is the SMA of the previous SMA.
Confusing?? Let me explain to you in detail.
- The first simple moving average uses the two period to draw the line. You can also change the default period.
- The second simple moving average uses the two period of the first simple moving average.
- The third SMA uses the two periods of the second SMA line.
- It continues until the 10th SMA line uses the two periods of the 9th SMA line.
All the SMA lines consist of different colors and become a rainbow-like shape on the candlestick chart.
Formula
The rainbow indicator only uses the Formula of the simple moving average, that is:
SMA Formula = Sum of close prices of N period candlesticks/number of periods
You can also manually calculate the SMA value using the above Formula. This Formula gives rise to a dynamic line on the price chart, which we call the moving average line.
Calculations
To make it clearer and easier to understand, I will explain the calculations of this indicator with an example if the closing price of the previous and current candlestick of the EURUSD currency pair is 1.12000 and 1.12010. Then the moving average price on the current candlestick will be:
SMA = 1.12000+1.12010/2
This was the Formula for SMA 1.
To calculate the SMA 2 (simple moving average line 2)
SMA 2 = SMA 1 at current candlestick + SMA 1 of previous candlestick/2
In the same way, we will calculate the other eight simple moving average lines, which will make a rainbow indicator.
Importance
The rainbow indicator’s ten moving average lines act as dynamic support and resistance. Price always bounces from the support and resistance. In the same way, these moving average lines work.
When the rainbow indicator plots the lines below the candlesticks, it means these lines will act as support. Price will bounce in the bullish direction from the simple moving average lines.
If the rainbow indicator plots SMA lines above the candlesticks, they will act as resistance. Price will bounce from the resistance in the bearish direction.
How to use the rainbow indicator in trading?
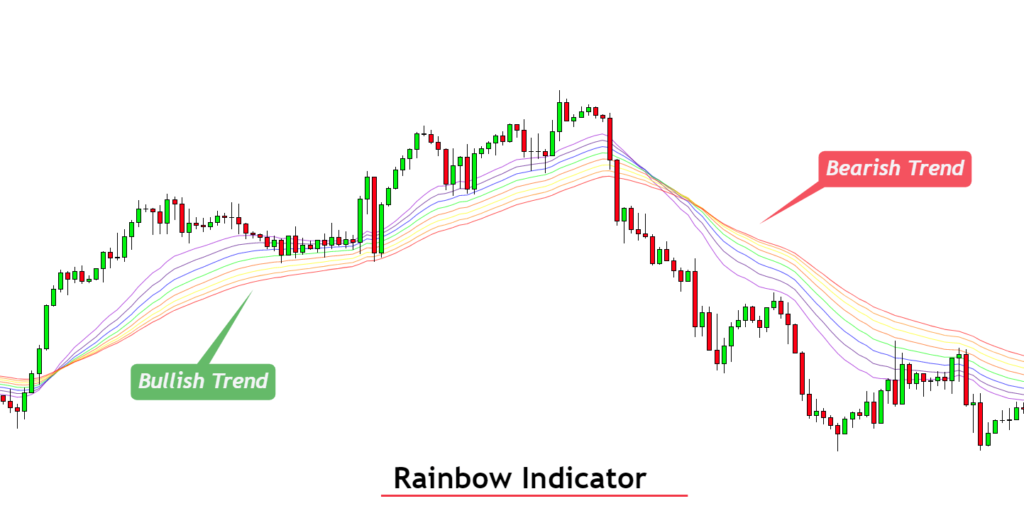
The working method of the rainbow indicator is similar to a simple moving average line on the candlestick chart.
When the price crosses the SMA lines from the bottom, then a bullish trend starts. On the other hand, when the price crosses the SMA lines from the top, a bearish trend starts.
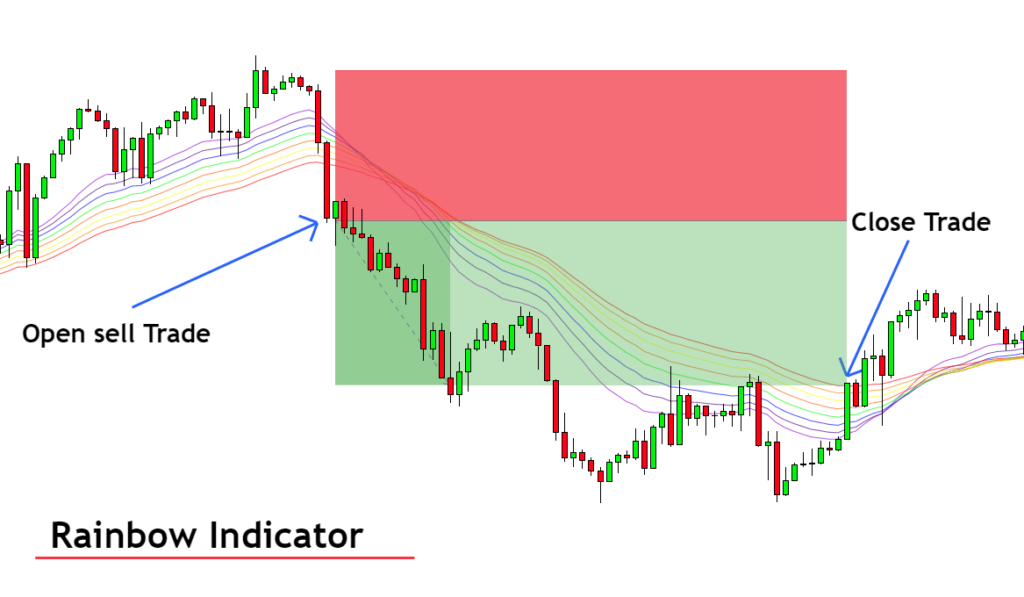
Open a sell trade
- Add the rainbow indicator to the chart, then check that price is moving above the rainbow SMA lines.
- Then wait for the price to close below the 10th SMA line and open a sell trade.
- Place stop loss above the recent swing high and take profit when the price closes above the 10th SMA line.
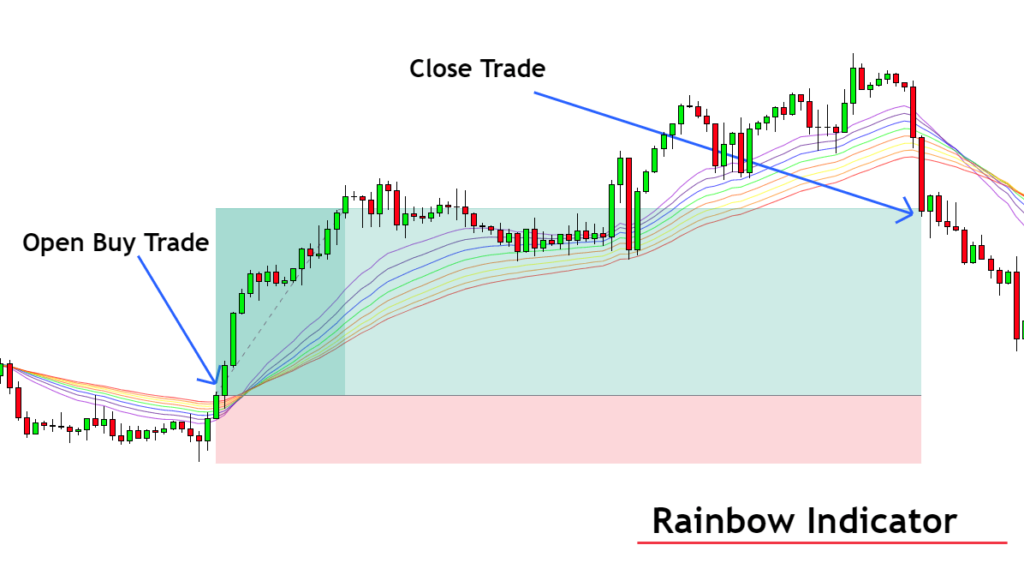
Open a buy trade
- If the price is moving below the SMA lines and after the breakout, the candlestick closes above the SMA lines, then open a buy trade
- Place stop-loss below the recent swing slow
- Close the buy trade when a candlestick closes below the rainbow indicator.
However, the best use of this indicator is to take profit levels. For example, if you open a sell trade in a currency pair, break even your trade and wait until the price completely crossover the rainbow indicator in the bullish direction. In this way, you can get ultra-high-risk reward trades. It will also keep you away from price consolidations.
The bottom line
I highly recommend that beginners and intermediate traders use the rainbow indicator in their trading strategies. You should not wholly rely on the rainbow indicator but use it as a confluence with other trading strategies.
When you add more than one technical tool to make a trading strategy, the winning probability of that strategy increases—after then, following the proper risk management and overcoming your trading psychology using a simple system will make you a profitable trader.