What is Rally base Rally in trading?
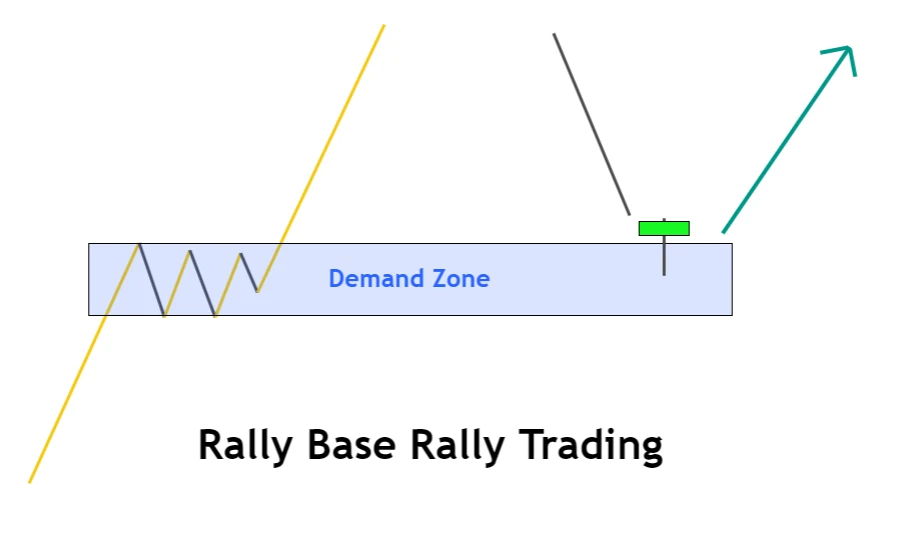
Rally base rally (RBR) is a price pattern that represents the formation of a demand zone. It creates special zones on the chart that increases the demand/number of buyers at that zone.
It is a type of Supply and demand in trading. Supply and demand are the origins of technical analysis trading. Without understanding the basics, you cannot become a technical analyst.
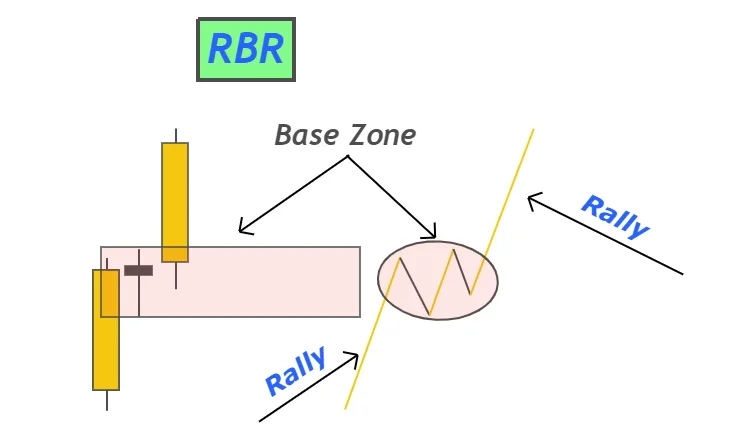
How to identify Rally base rally?
In the RBR, a base zone is sandwiched between two rallies or bullish trends of price. The base zone indicates the demand zone.
A simplistic form of this RBR pattern consists of three candlesticks.
- Two big bullish candlesticks
- One Base Candlestick
There is a simple formula to identify RBR patterns in trading
Rally base Rally = Big bullish candlestick + Base candlestick + Big bullish candlestick
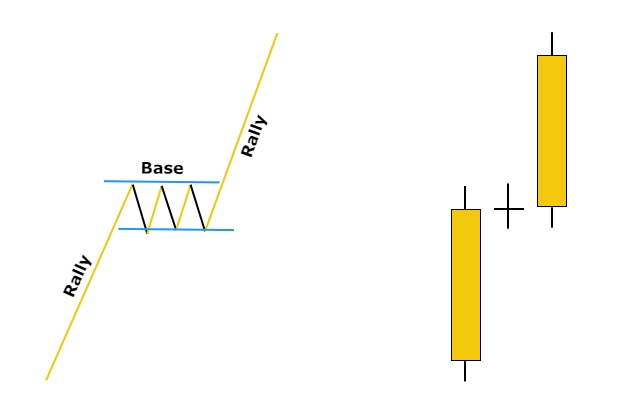
There are a few criteria you need to follow to before identifying a good RBR pattern.
- The body to wick ratio of two big candlesticks must be greater than 70% of total candlestick size
- In case of base candlestick, the body to wick ratio must be less than 25%
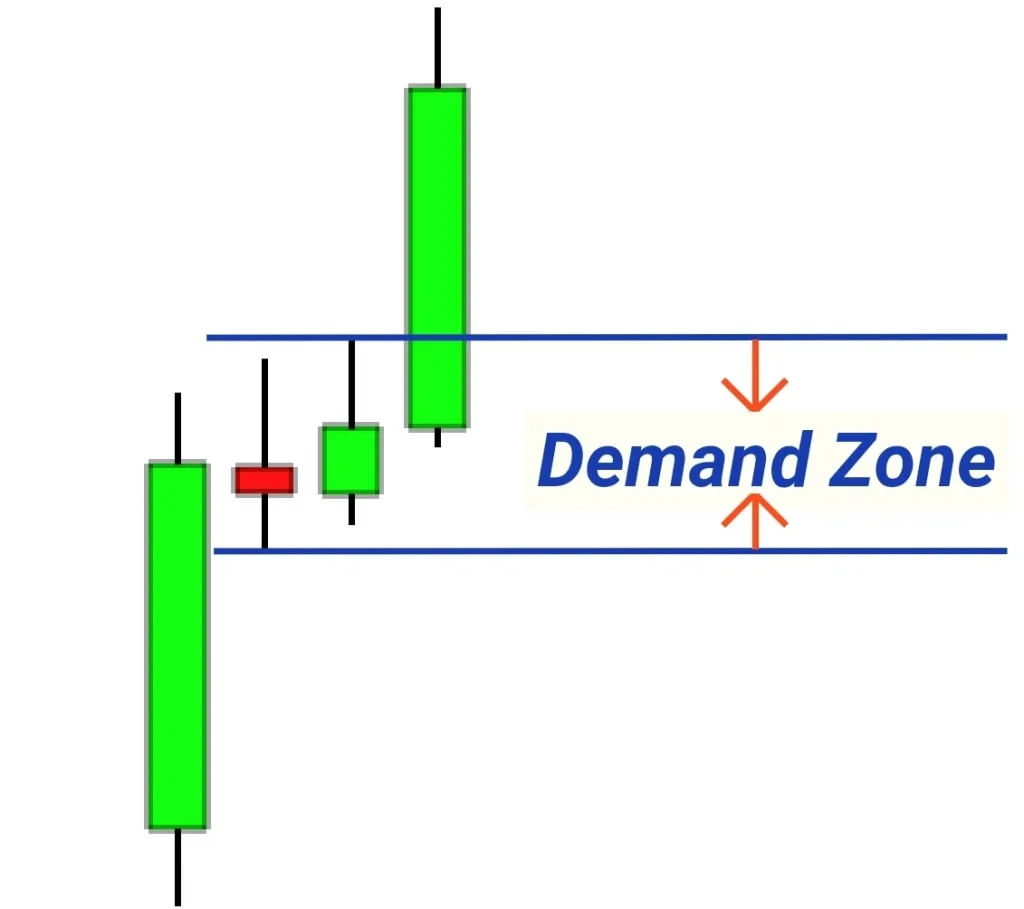
How to draw demand zone?
The base zone in RBR can consist of one to more candlesticks.
To draw demand zone in rally base rally pattern, mark the high and low of the base zone. Draw a rectangle meeting the high and the low of the base zone between the RBR pattern and extend the rectangle to right.
You should take the low of the recent big candlestick if its low is lower than the low of the base zone.
What does RBR pattern tell the traders?
This pattern creates a demand zone on the price chart. The demand zone indicates that there is a lot of demand in that area. Big institutions and big banks are already willing to buy from that area. The demand zone is under the attention of big traders.
The RBR Pattern helps us to find out those zones that are under the attention of big traders. The price will only go up when there is more demand.
The base zone in the RBR pattern is the footprint of institutions. You should use those footprints and follow the path of real money.
How to trade rally base rally demand zone?
A simple and straightforward rule of trading demand zone is to buy from that zone.
There are two methods to trade rally base rally demand zone
- After formation of base zone, if price suddenly pullback towards the base zone, then you should buy from base zone at the price pull back towards zone.
- If price did not pull back just after zone formation, then you should wait until the price to come back to the zone and form a bullish candlestick pattern.
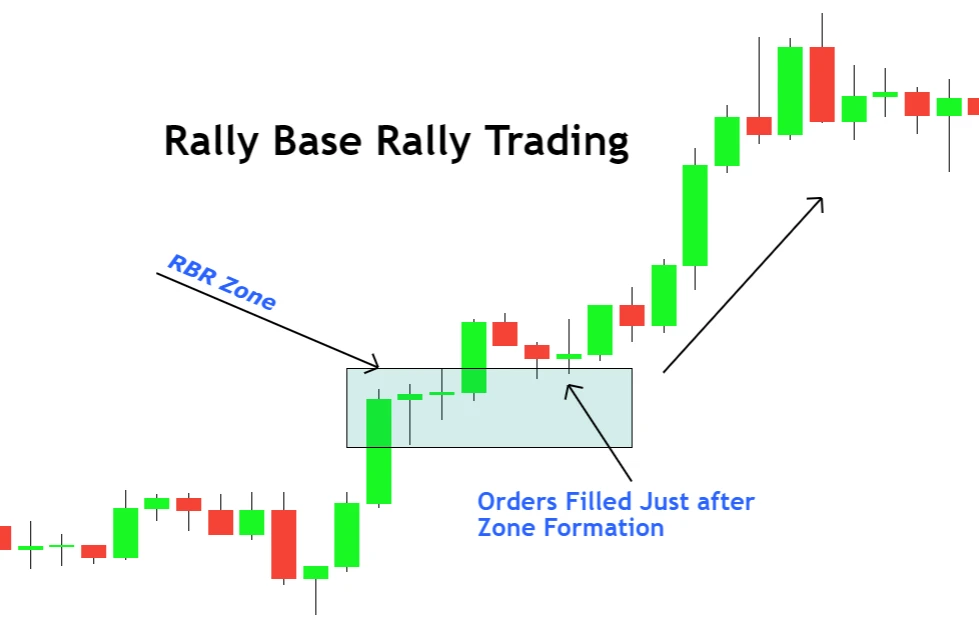
A bullish candlestick pattern at the base zone will increase the probability of winning. By doing this, you will be able to filter out bad demand zones from the crowd.
Procedure to trade by using candlestick pattern
After drawing the demand zone, wait for the price to pull back towards the zone and form a bullish candlestick pattern. Place a stop loss below the demand zone. You must hold your trade until 1:2 risk-reward, then close the trade partially and break even the trade. Hold the rest of the trade until you get a huge risk reward.
Drawback of Demand zone
The main drawback of the demand zone is that it does not shows the location of taking profit level. You can open an order and place a stop loss, but you cannot forecast take profit level. That’s why you should use other chart patterns with demand zone to identify take-profit levels.
Conclusion
Rally base rally is a high probable price pattern. You should not miss a buy trade opportunity after RBR formation.
Keep in mind that you should backtest this pattern at least 100 times to master it. Do not use it alone. Always use it with a confluence in trading.


At what time frame dose it work the best ?
Which time frame is most right ?