
Definition
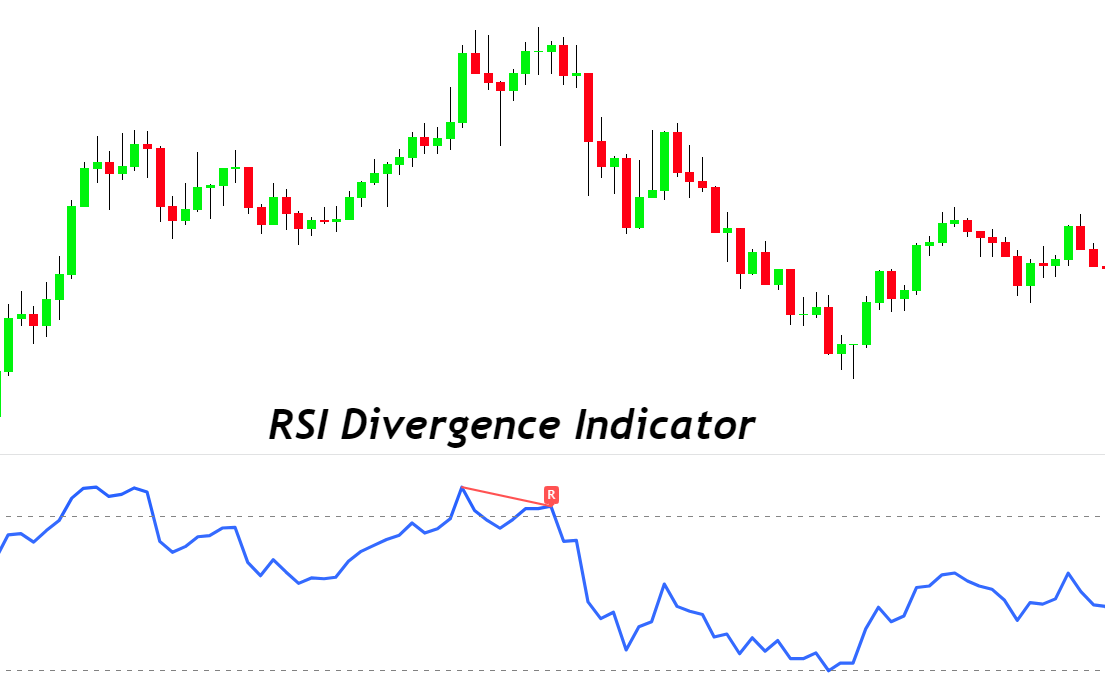
RSI divergence indicator is a technical indicator that shows real-time divergences on the RSI indicator in a separate window.
It is very time-consuming for traders to check the divergences on multiple currency pairs. Many traders also miss profitable opportunities due to less screen time. So, this divergence indicator will plot RSI divergence lines on the chart.
In this post, you will learn about the types of RSI divergences and a link to RSI divergence indicator at the end of the article.
How does RSI divergence indicator work in trading?
This indicator is based on all four types of divergences in trading. You can also turn on or off a specific type to optimize your trading strategy. It will plot a line on the RSI line depending on the divergence.
Let me explain a basic intro to all four types of divergences in trading. If you want to study in detail, then click here.
Types of RSI divergences
There are four types of RSI divergences:
- Bullish divergence
- Bearish divergence
- Hidden bullish divergence
- Hidden bearish divergence
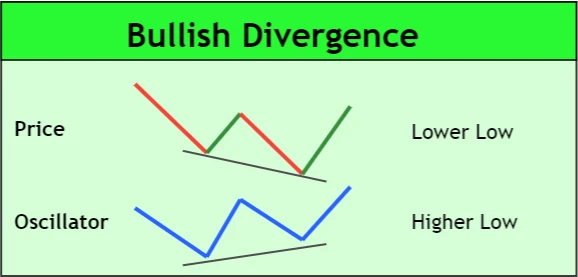
Bullish divergence
When lower lows form in the price, and higher low form on the RSI indicator, a bullish divergence forms; the RSI divergence indicator will plot a line meeting the lower low and higher low of the RSI line.
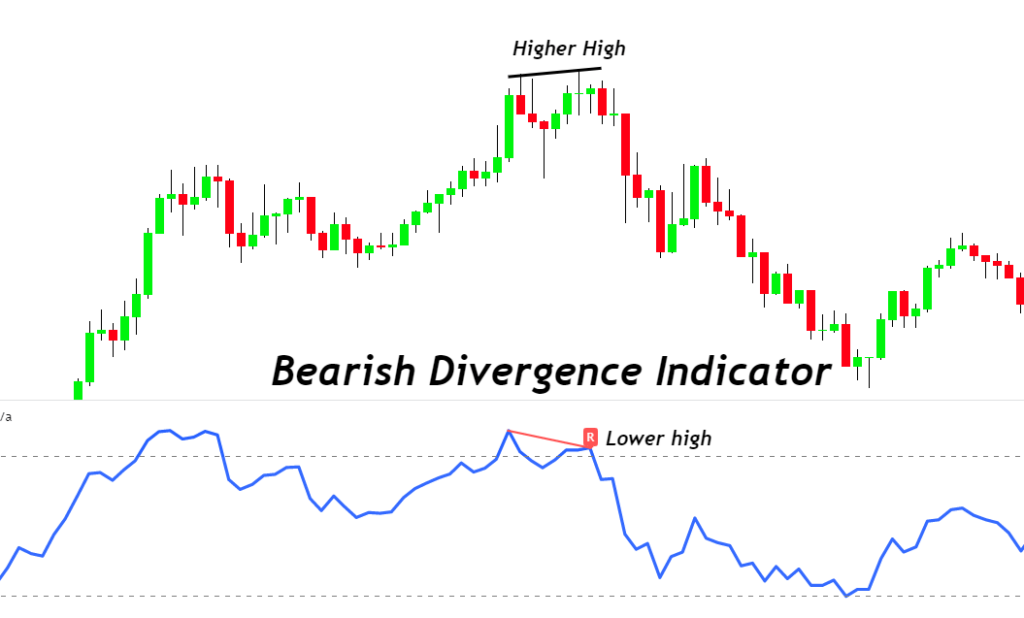
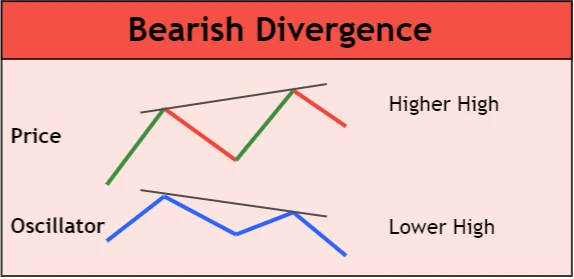
Bearish divergence
When higher highs form in the price and lower high forms in the RSI line, a bearish divergence forms; during this type of divergence, the RSI divergence indicator will plot a line on higher high and lower high points of the RSI line showing a bearish trend reversal.
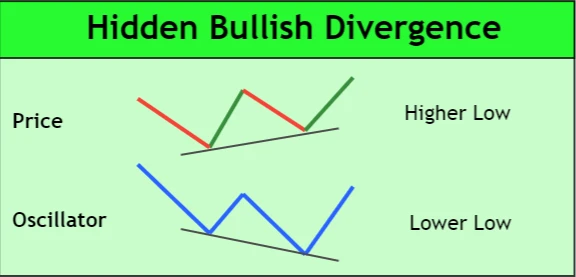
Hidden bullish divergence
The higher low in the price and lower low in the RSI line show a hidden bullish divergence on the chart. RSI divergence indicator will plot a downward line on the low and lower low of the RSI line.
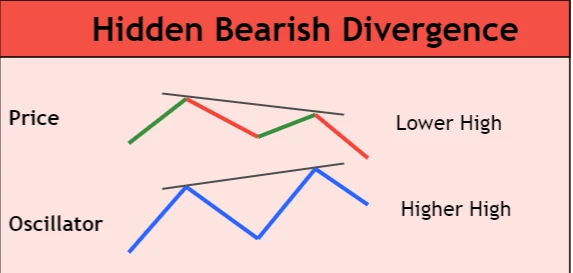
Hidden bearish divergence
The lower high on the price and higher high on the RSI line indicate hidden bearish divergence. RSI divergence indicator will plot an upward line meeting the high and higher high of the RSI line.
Features of RSI divergence indicator
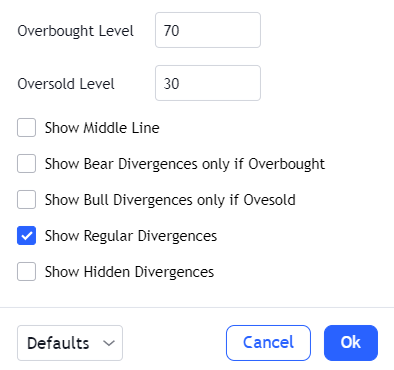
There are two significant features in the indicator that will increase the winning ratio of your trading strategy.
- Show bearish divergences only during the overbought condition
- Show bullish divergence only during the oversold condition
These are two features you should use in trading.
Let me explain to you.
When the price is in an overbought condition, the chances of bearish trend reversal are good if a bearish divergence forms in the overbought region, the probability of bearish trend reversal will increase.
This is the major benefit of this indicator you can use in trading. Besides this, these two features are optional. You can turn on or off these features from the indicator’s settings.
There are many other customizations available in this indicator you can use like colour, line width etc.
Higher timeframe Trend
The daily timeframe is the next important parameter for a successful RSI divergence trading strategy. For example, if a bearish RSI divergence is forming on the chart, it is recommended to look for the higher timeframe trend. If the higher timeframe trend matches the bearish divergence, you should place a sell order.
Otherwise, it would be best to wait for trade setups that will have matching higher timeframe trend and divergence.
Conclusion
It is the best technical tool, and you should surely use it because it also involves price action and formula-based indicators. I don’t recommend using indicators alone because the market is natural. But you can use the indicators with some price action patterns to become a profitable trader.