
Definition
The separating lines candlestick is a trend continuation pattern consisting of two opposite-colored candlesticks. The closing of the first candlestick will be equal to the opening price of the second candlestick.
Depending on the direction of the trend, it is further classified into two patterns
- Bullish separating lines
- Bearish separating lines
It indicates that the previous trend will continue. For example, if the prior trend is bearish and a bearish separating lines pattern forms, then the bearish trend will continue.
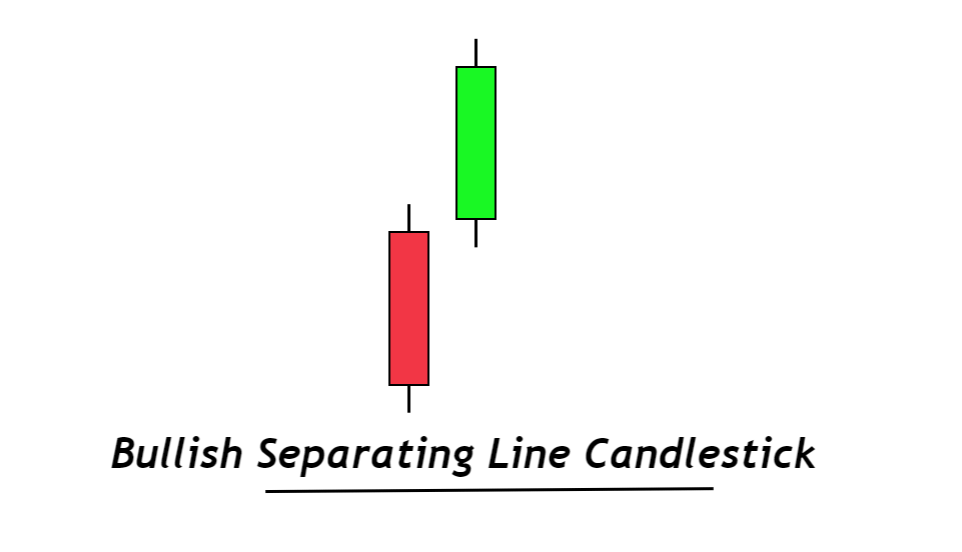
Bullish separating lines Candlestick
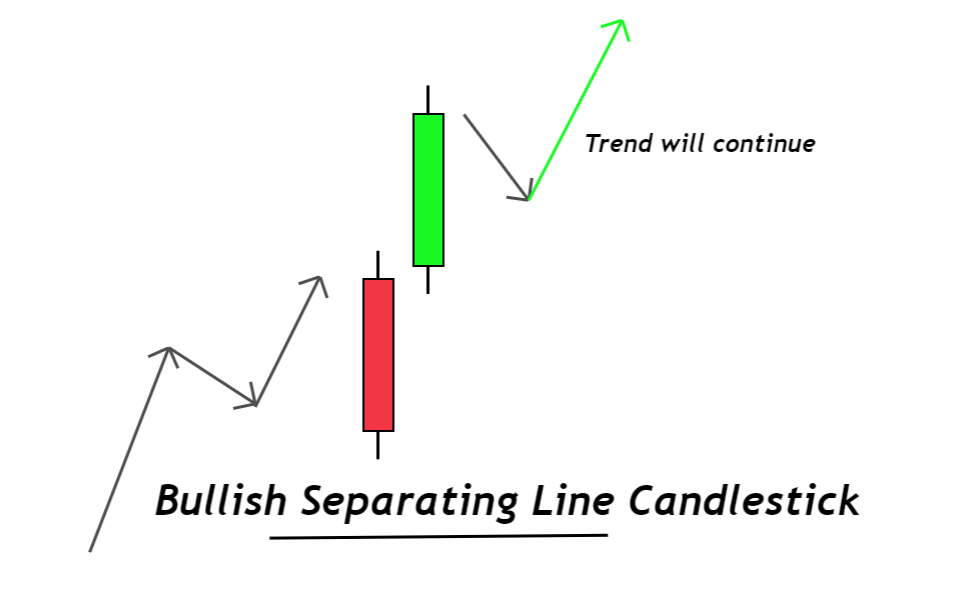
The bullish separating lines candlestick is a bullish trend continuation pattern. It shows that the bullish trend will continue, usually forming within the uptrend.
It is recommended to no trade bullish separating lines pattern at the top of a trend or during overbought conditions.
How to identify bullish separating lines candlestick?
Here is the guide to find out this candlestick pattern on the chart.
- The first candlestick will be a big bearish candlestick.
- The second candlestick will open at the closing price (gap up) of the first candlestick, which will close higher. It is a big bullish candlestick.
- A higher-high and higher low pattern will form.
You can identify a perfect candlestick pattern by following the above three rules.
Bullish separating lines: Information Table
| Features | Explanation |
|---|---|
| Number of Candlesticks | 2 |
| Prediction | Bullish trend continuation |
| Prior Trend | Bullish trend |
| Counter Pattern | Bearish separating lines |
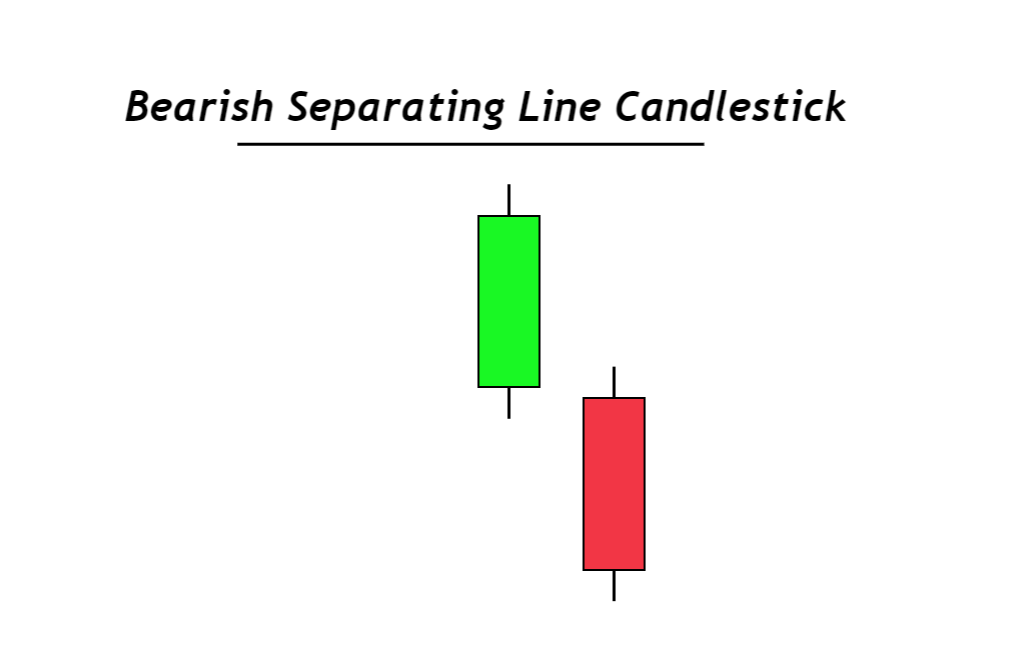
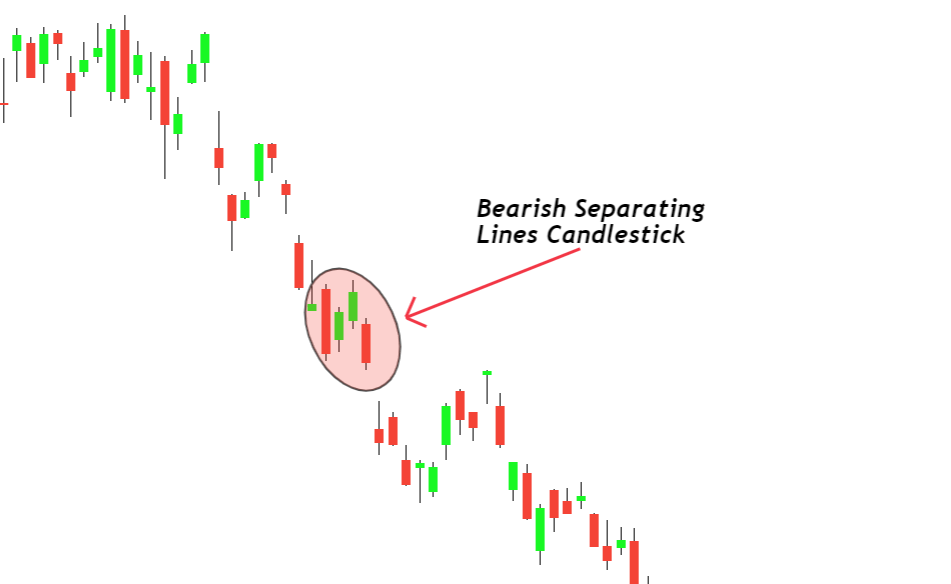
Bearish separating lines candlestick
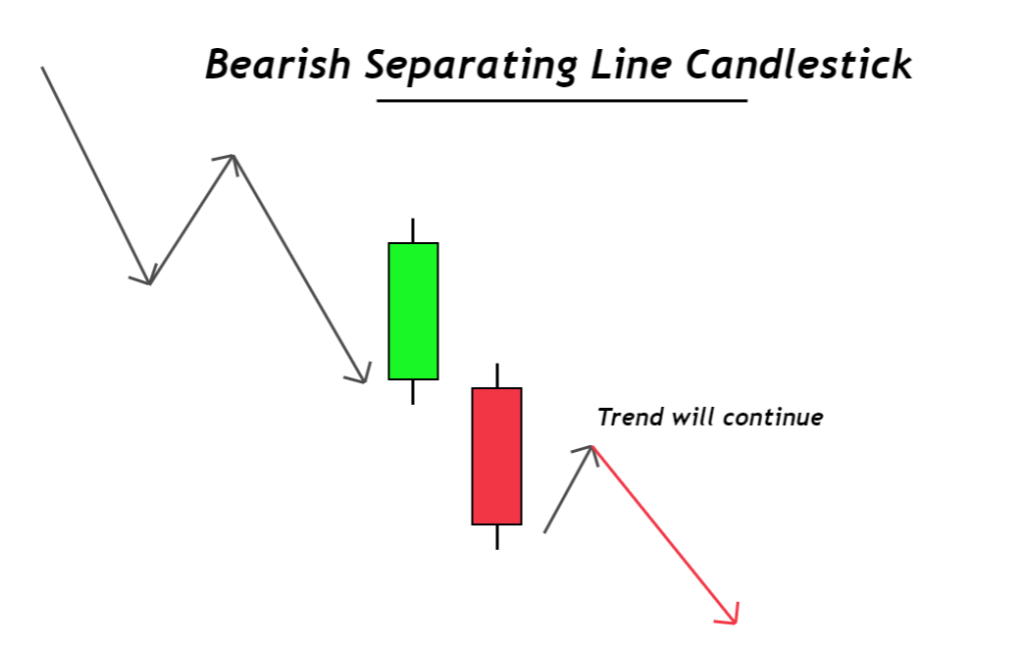
The bearish separating lines candlestick is a bearish trend continuation pattern. It indicates that the bearish trend will continue, and it usually forms within a downtrend.
As this pattern forms within the trend, you should not trade at the support or demand zone.

Find High Probability Trades with this ADVANCED Candlestick Patterns Course
The Ultimate Candlestick Patterns Course That Will Help You To Trade Better
How to identify bearish separating lines candlestick?
Here’s the guide to find this candlestick pattern on the price chart.
- The first candlestick will be a big bullish candlestick.
- The second candlestick will open with a gap down at the closing price of the first candlestick. and it will close lower than the closing price of first candle.
- A lower low and lower high pattern will form
Bearish Separating lines: Information Table
| Features | Explanation |
|---|---|
| Number of Candlesticks | 2 |
| Prediction | Bearish trend continuation |
| Prior Trend | Bearish trend |
| Counter Pattern | bullish separating lines |
Understanding the separating lines candlestick pattern
The first fact of trend continuation is the formation of higher highs or lower lows because it is the most basic way to determine the direction of the trend in the market.
In the case of bullish separating lines, when a bullish candlestick will open at the closing price of the bearish candlestick, it represents that the buyers have cleared a significant hurdle on their way. Because the closing price of a candlestick act as a primary critical level. As the bullish candlestick will open and close above that key level, that’s why it shows that buyers have more chances to keep on increasing the price.
Also, it represents the formation of higher highs and higher lows.
How to trade separating lines pattern?
A trading strategy consists of rules you need to follow while trading on a live account. So you can make good decisions; otherwise, you will end up tackling the trading psychology.
Rules are made to increase a trading setup’s risk-reward and winning ratio. For example, if two technical patterns indicate a continuation of a bearish trend, then the probability of continuation will increase.
Bearish separating line trading strategy
The confluence makes this trading strategy an exponential moving average and bearish separating line pattern.
In this setup, you will only trade in a bearish direction, and this strategy is for stocks or indices only.
Conditions of strategy for bearish setup:
- Plot an EMA with 38 periods. Price should be below the EMA, indicating a downtrend.
- Open a sell trade when a bearish separating line candlestick forms.
- Place stop loss above the EMA and adjust the take profit level to get at least a 1:2 risk-reward.
Pro Tip: You can also trail stop loss level according to EMA values with the time. Or use Fibonacci levels to increase the risk-reward.
Bullish separating line trading strategy
In this trading setup, you will open only buy orders.
Here’s the guide to strategy
- Plot an EMA with 38 periods. Price should be above the EMA line showing a bullish trend
- Open a buy trade when a bullish separating line pattern forms.
- Place stop loss below the EMA and adjust the take-profit level to obtain a 1:2 risk reward.
The Bottom Line
This candlestick pattern will mostly form in the chart of stocks and indices. There is less probability of gap within the candlesticks in forex due to high volatility.
Remember that you should not mix this gap with the gap form during the weekend in the forex charts.
It is recommended to trade candlestick patterns only with the confluence of other technical tools like moving average, key levels, supply and demand zones etc.