
Definition
Set and forget is a supply-demand trading term that tells a trader to trade without emotions and psychological factors. For example, if you open a buy trade, you will keep watching the trade and trading psychology will force you to close the trade either in loss or in less profit. But if you will believe in your trading setup and after opening a trade, you don’t watch the running trade. Then this will end with a big profit or a small loss.
So, by using this set and forget technique, you can overcome psychological factors in trading and then trade like a pro trader.
In this post, we will talk about the set and forget indicator that can help you gain bigger profits.
How does the set and forget indicator work?
Set and forget is another name for supply and demand trading. Because the set and forget method requires finding high-risk reward trades with tight stop losses. Applying the set-and-forget trading method on a 1:1 risk-reward trade will be challenging, but it will apply perfectly on 1:20, 1:30 RR trades.
In technical analysis, supply and demand zone trading is the only method to award you high-risk reward trade (1:10, 1:30) with greater precision than support resistance, Fibonacci or indicators trading methods.
Now let’s talk about the set and forget indicator and how you can achieve high-risk reward trades.
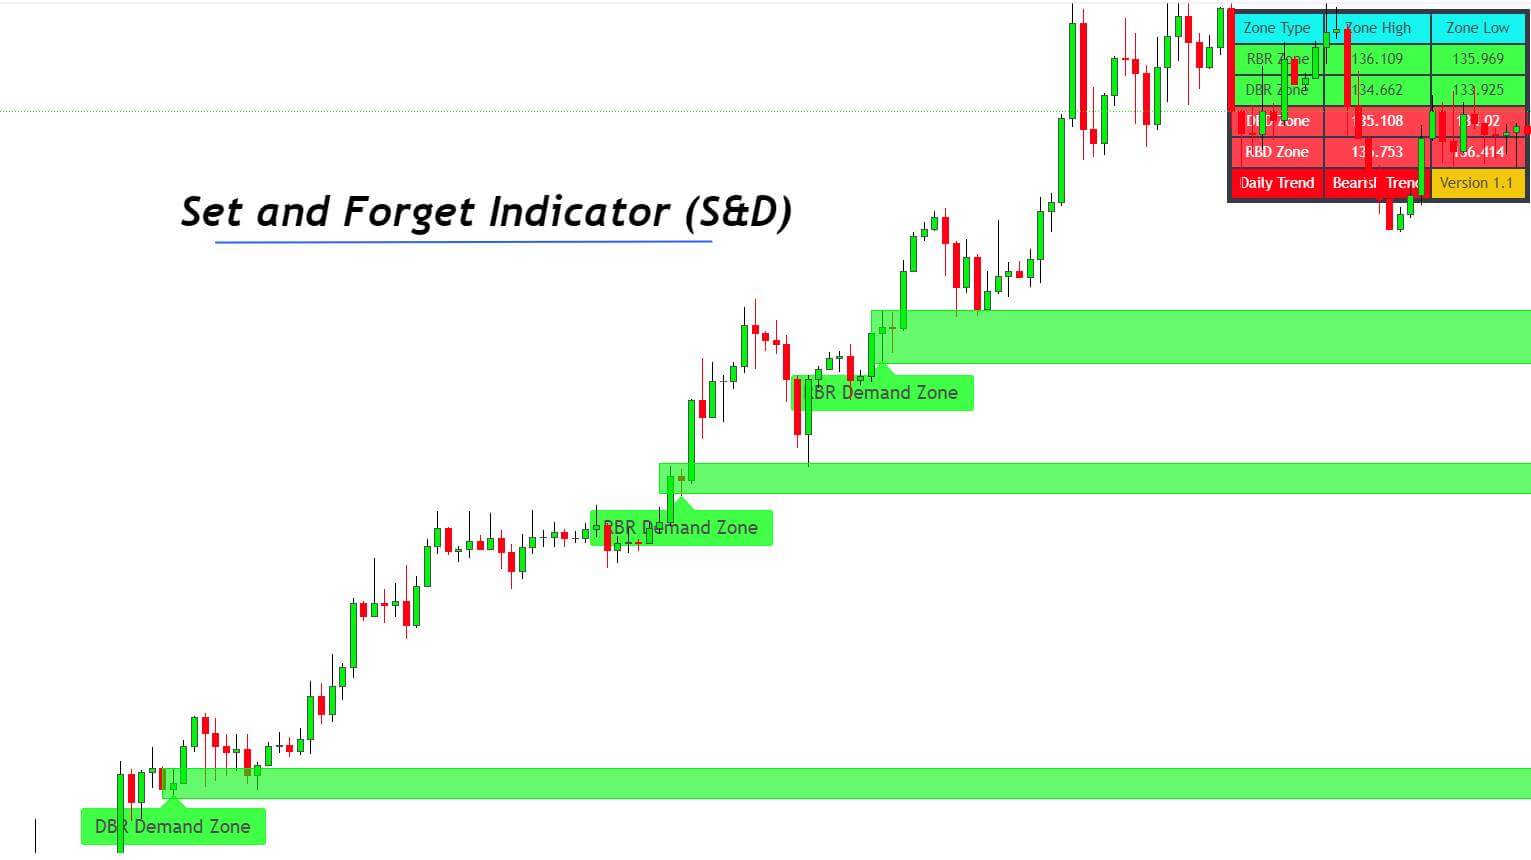
Below is the screenshot of the indicator that draws zones based on supply and demand. Supply and demand tell us about the order opening and stop-loss price.

In the case of the demand zone, we will buy from the high demand zone and will place a stop loss below the low of the zone. While in the case of the supply zone, we will sell from the low of the supply zone and will place a stop loss above the high of the zone.
How to apply the set and forget strategy on the indicator?
The main psychological factor in trading is that a retail trader always fears loss, and due to greed, he cannot hold the trade. This is the major issue.
The set and forget trading strategy helps to solve this issue. Let’s understand with a live example on the chart.
Suppose you open a buy trade from the demand zone and place a stop loss by calculating the appropriate lot size according to the 2% of the total balance. When the price reaches a 1:1 risk-reward level, you break even the trade and let the trade run without managing. After some time, the trade gets 1:40 risk-reward. Congrats!! You almost doubled your account with an 80% increment in your previous balance.
It does not mean it is gambling or any other such term; you will also face losses. But if you lose even 10 trades after winning a big trade, you will still be in high profit. Don’t go for picking a lot of trades. Even a single high-risk reward trade in a month can make you a profitable trader.
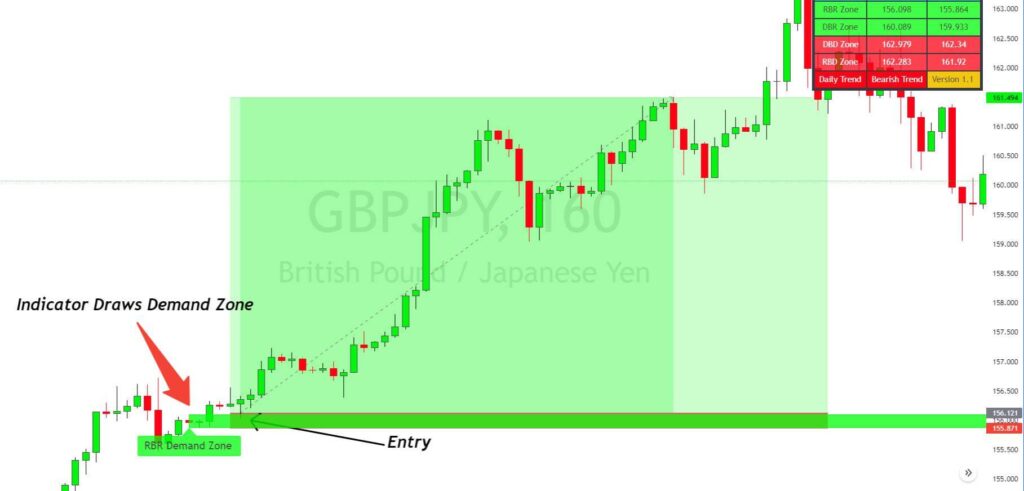
Look at the image below and check this trading method using the supply and demand trading indicator.
What are the difficulties you will face using the set and forget indicator?
As mentioned above, you can win trades of 1:40 risk-reward trades by the set and forget technique. But if a high profitable trade reverses after some time without your notice as you’re not managing the trade, this will also be a loss for you. You will not lose because you already have breakeven the trade, but losing a high-risk reward trade will make you feel bad. This can also ruin your trading psychology.
This is the primary difficulty you can face with this system.
Solutions to the difficulties of trading with set and forget indicator
We’re not just wasting your time, but we have written this article after some experience. We will also give you a proper solution to tackle the above difficulty in trading with supply and demand indicators, so you can complete the steps to become a profitable trader.
The solution is using the Renko chart with a set and forget indicator. The Renko chart is an advanced type of chart that clears the market noise and only show you the bullish or bearish trend. It works without respecting the time but is based on market moves. Each brick of the Renko chart has the same size as the previous brick.
The best feature is that each Renko brick forms based on the price movement, not the time. For example, if the price ranges for many days, then the Renko chart will only form one brick for this range. It does not matter whether that price range holds for one day or two days.
Now we will explain the trading strategy of the set and forget indicator with the Renko chart.
Set and forget trading strategy
In this strategy, everything is based on the candlestick chart, supply-demand zones, order opening and stop-loss except take profit level. You will use a candlestick chart for order opening, breakeven and stop-loss. Only use the Renko chart for taking profit levels.
Open Buy order
When the supply and demand indicator (set & forget indicator) plots a demand zone, then place a buy limit order above the high of the zone and stop loss below the low of the zone.
After buying order filling, wait for the price to reach 1:1 risk-reward and then breakeven the trade.
Now comes the main point. Open the Renko chart and check whether the brick is bullish or bearish.
- If the Renko chart brick is bearish, close the trade at 1:1 RR.
- If the Renko chart brick is bullish, keep holding the trade until it turns bearish.
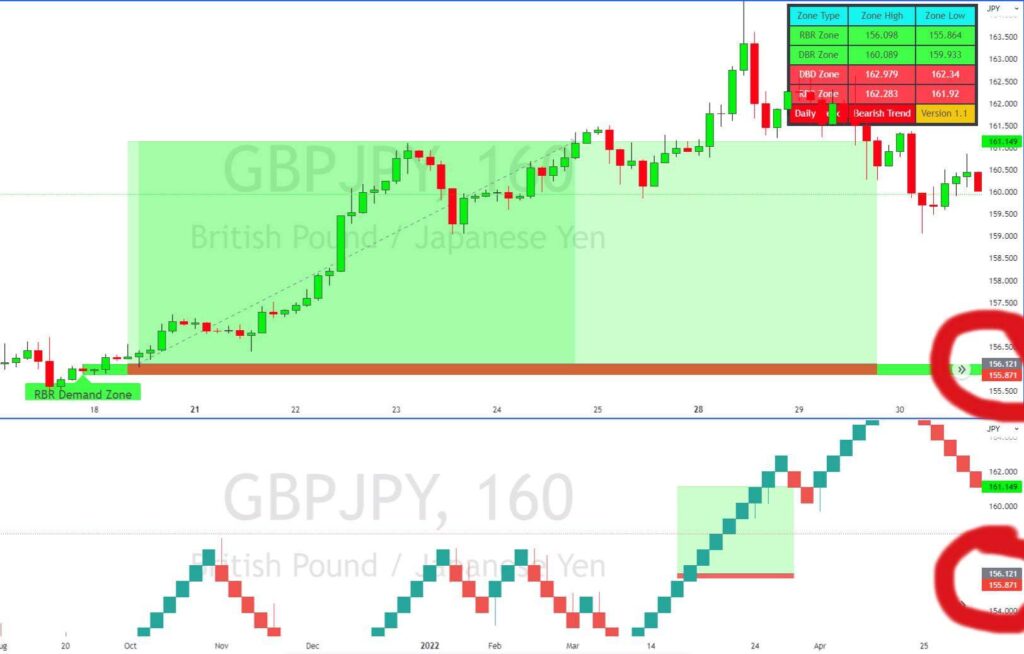
In the example below, we bought from a demand zone and placed stop-loss below the zone.
Then we opened the Renko chart in a separate window and applied the conditions according to the above strategy and won a 1:20 risk-reward trade. This means it had increased the portfolio by 40%.
You can also check the prices in the red circles to confirm the trade setup.
Open sell order
When the supply and demand indicator makes a supply zone, open a sell limit order below the zone’s low and place stop loss above the high of the zone.
Breakeven the trade after 1:1 risk-reward and now check the Renko chart.
- If the recent brick of the Renko chart is red, keep holding the trade until it turns green.
- While if the recent brick of the Renko chart is green, then close the trade at a 1:1 risk-reward.
The bottom line
In this trading strategy, everything is perfect. We have used supply and demand zones that are footprints of institutional traders. Then we have used tight stop loss to get high-risk rewards. The addition of breakeven to the strategy will eliminate many psychological issues. The Renko chart for only take-profit levels is also logical and works perfectly.
I’m sure you will like this trading strategy. Open two trading windows of the same currency pair, one with a candlestick chart and the other with a Renko chart on tradingview. Then backtest this strategy, and you will see results.