
Definition
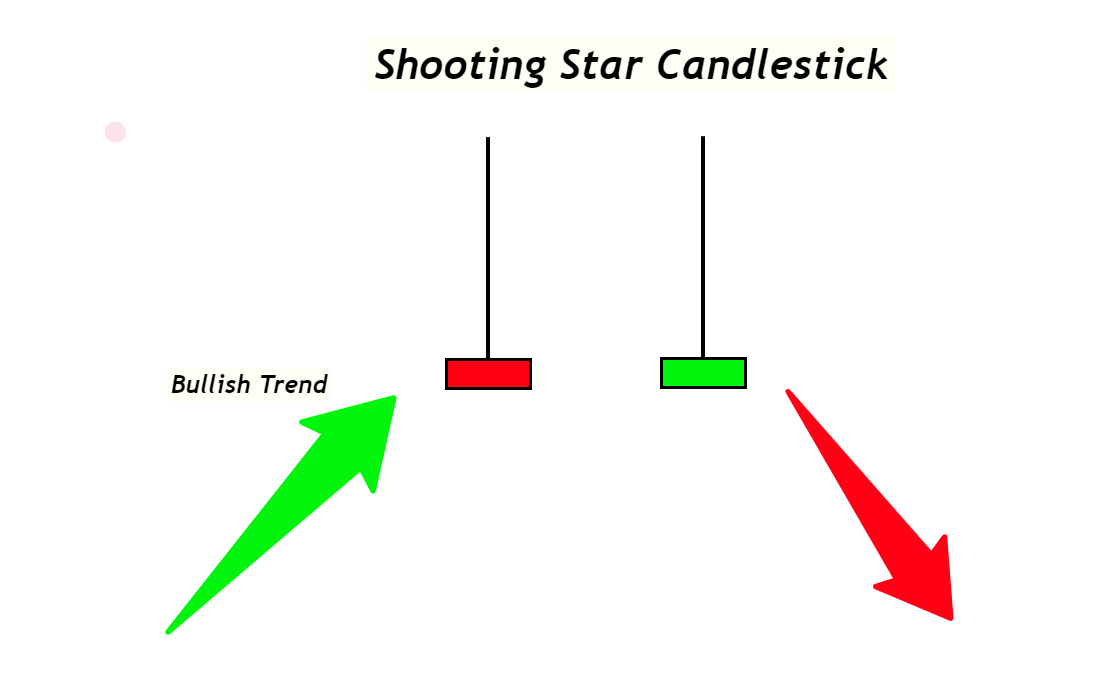
The shooting star is a bearish reversal candlestick pattern consisting of a single candlestick with a long upper shadow and a small body in the lower candlestick. It also denotes the bearish pin bar pattern.
Retail traders widely use shooting star candlestick patterns in technical analysis of currency pairs to predict the price trend reversals in the market. When a shooting star candle forms, it means sellers are strong and control the market. It turns a bullish trend into a bearish trend.
In this post, you’ll learn about the shooting star candlestick pattern’s structure, significance, trading psychology, and trading guide.
How to find a shooting star candlestick pattern?
To identify a perfect shooting star candlestick pattern, I will explain this candlestick in three stages.
Structure of candlestick
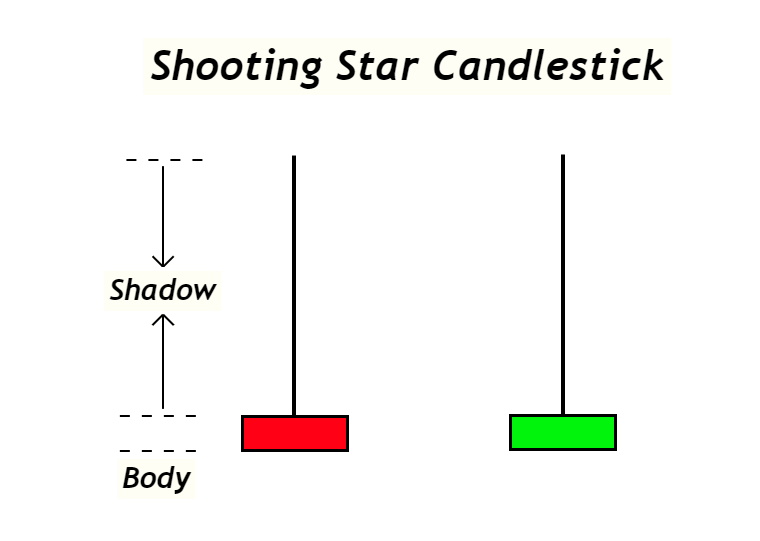
The shooting star candlestick consists of a long upper shadow and a small body near the bottom. The shadow should be greater than 70% of the total body of the candlestick. And the body should lie below 40% of the total candlestick.
There must be little or no shadow below the body of the candlestick. Otherwise, it will not be a shooting star candlestick.
The colour of the shooting star pattern does not matter, either green or red. But the shape of the candlestick matters.
Prior Trend
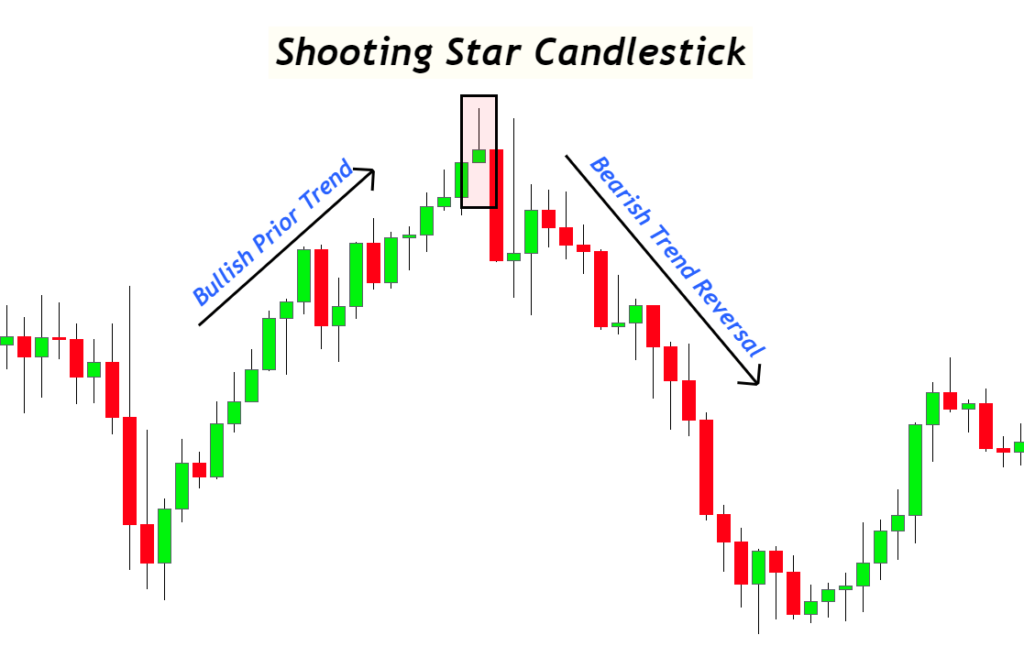
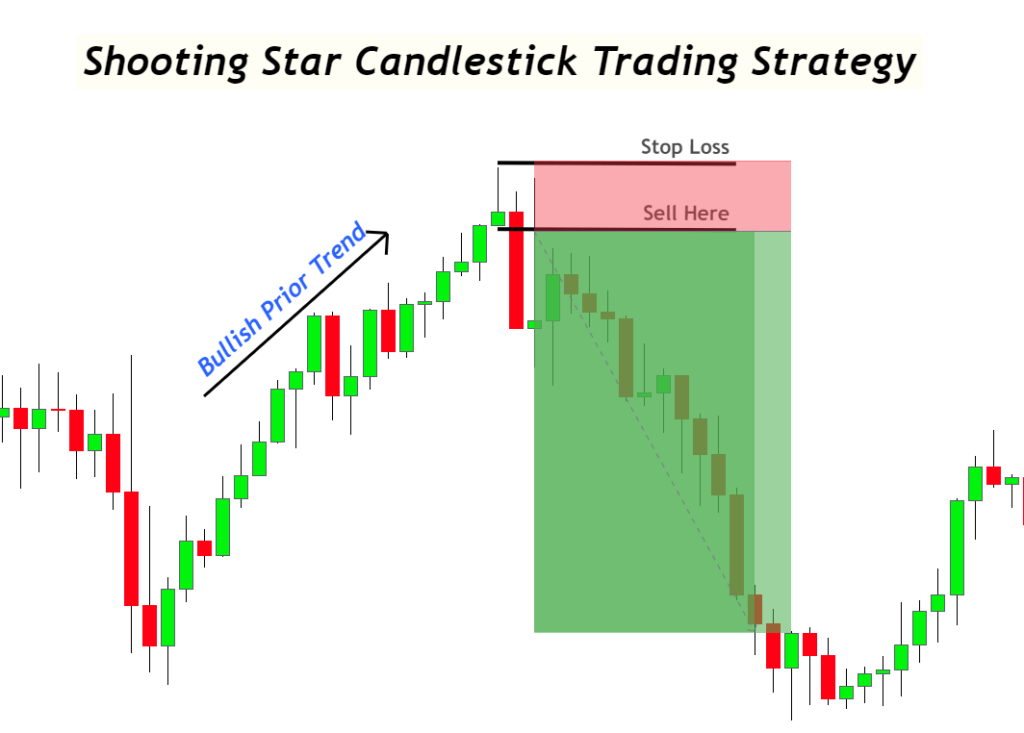
The prior trend before the shooting star candle should be bullish. It is a mandatory condition for this pattern because it shows the overbought conditions with a false breakout (long shadow).
If the prior trend is bearish, this will not be a shooting star pattern.


Find High Probability Trades with this ADVANCED Candlestick Patterns Course
The Ultimate Candlestick Patterns Course That Will Help You To Trade Better
Location of candlestick
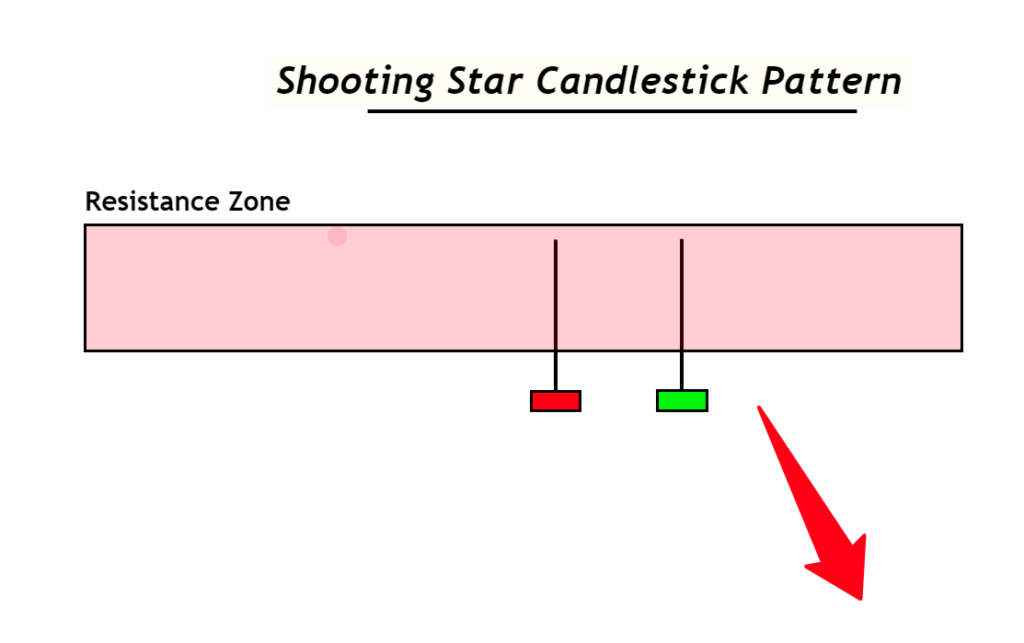
The perfect location of the shooting star candlestick pattern is at a key level or a strong resistance level. Because it will show that the price has given a rejection from the key level, it is a strong sign of bearish trend reversal.
Also, you should keep in mind that the long shadow should form outside the range of the previous candlestick.
Shooting Star: Information Table
| Features | Explanation |
|---|---|
| Number of Candlesticks | 1 |
| Prediction | Bearish trend reversal |
| Prior Trend | Bullish trend |
| Counter Pattern | Hammer Candlestick |
What does the shooting star candlestick tell traders?
Before trading a pattern, it is necessary to learn the psychology of this pattern. In the psychology of candlestick patterns, you should answer the following questions:
Why does the shooting star pattern form? What is going on behind the candlestick chart during shooting star formation? What is the significance of this pattern?
After finding the answers to the above questions, you will understand a pattern correctly, and you’ll be able to find the most accurate patterns from the price chart.
Let me explain in detail
The shadow of the candlestick always shows a price rejection from a certain price level. For example, sellers are already waiting for their sell orders to be filled when buyers push the price. When sell orders are triggered from a certain level, the price will decrease again, showing sellers’ dominance over the buyers. Because buyers could not keep on pushing the price up, they had ended up against the sellers.
In technical analysis, if the price goes up and then closes below 50% of the total candlestick’s range, it is a sign of the strength of sellers.
Another reason for a trend reversal in shooting star patterns is the overbought conditions because the prior trend must be bullish. So when the price already reaches the overbought condition, the chances of reversal from a resistance level increase. The formation of the shooting star candle at resistance level in the overbought condition confirms the bearish trend reversal
This is the simple psychology behind the shooting star candle that every retail trader must learn in technical analysis.
How to trade with a shooting star candle?
Trading the shooting star pattern includes identifying order entry, stop loss, and take profit levels. However, I will not recommend trading a candlestick pattern alone because a trading strategy consists of the confluence of many technical tools to increase the probability of winning.
Tip: a candlestick pattern does not tell us about the take profit levels. Because candlestick patterns are just signs of a trend reversal, we can use these patterns to find stop loss and order entry levels but cannot be used for take profit levels. I always recommend adding a confluence of other technical tools like chart patterns to find take profit levels during trading.
Shooting star trading signal
When a shooting star candlestick forms at the resistance zone, then open a sell order instantly. Place stop loss level a few pips above the high of shooting star candlestick for high-risk entry with a large risk-reward ratio. However, if you want to go with a conservative trade setup, always place a stop loss above the resistance zone instead of placing a stop loss just above the high.
The bottom line
Japanese traders introduce candlestick patterns, and now they are widely used by retail traders to technical analyse the trend of an asset worldwide.
My recommendation to you is that you should first understand the structure of the candle, then learn its trading psychology and use it in a trading strategy. This is the best way to trade candlestick patterns.
There are several candlestick patterns, but you shouldn’t confuse yourself to finding the best one. Just pick the top 4 candlestick patterns and master them.
The winning percentage of a candlestick pattern always depends on the timeframe, financial asset, and risk management. However, if you go with a 1:1 risk-reward and add confluences of the resistance level and overbought conditions, its winning ratio will be greater than 60%.
In such a case, it will also generate a trend reversal signal after the formation of a candlestick during the downtrend. But the name of the shooting star candlestick will change to inverted hammer candlestick. That’s why understanding trading psychology is very important. The sense of a candlestick pattern can be changed just by the change of location on the candlestick chart.
The colour of the shooting star candlestick does not matter, either red or green. The only thing that matters is the candlestick’s location, prior trend, and structure. It will always predict a bearish trend reversal.