
Definition
Support and resistance refer to the most basic technical analysis tools that determine the high probability zones from where a trend reversal of prior price trends will happen. S&R levels denote support and resistance.
S&R (support & resistance) levels act as hurdles on the price trend. This support and resistance tool ability helps traders forecast the market with accuracy. It is the core concept of trading and is widely used by traders in technical analysis.
What is a support zone?
Support zone means the zone where more buyers are willing to buy a specific currency or stock. That’s why it will change the trend from a bearish into a bullish trend.
There are certain price levels on the chart like round numbers, daily or weekly high/low levels, and historical levels that act as support or resistance levels. Because price always repeats history.
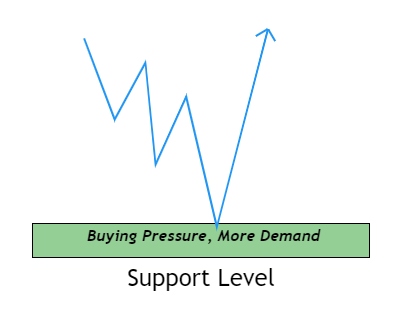
Traders always want to buy from the support zone because the price will bounce, or a bullish trend reversal will happen.
How to identify a valid support zone?
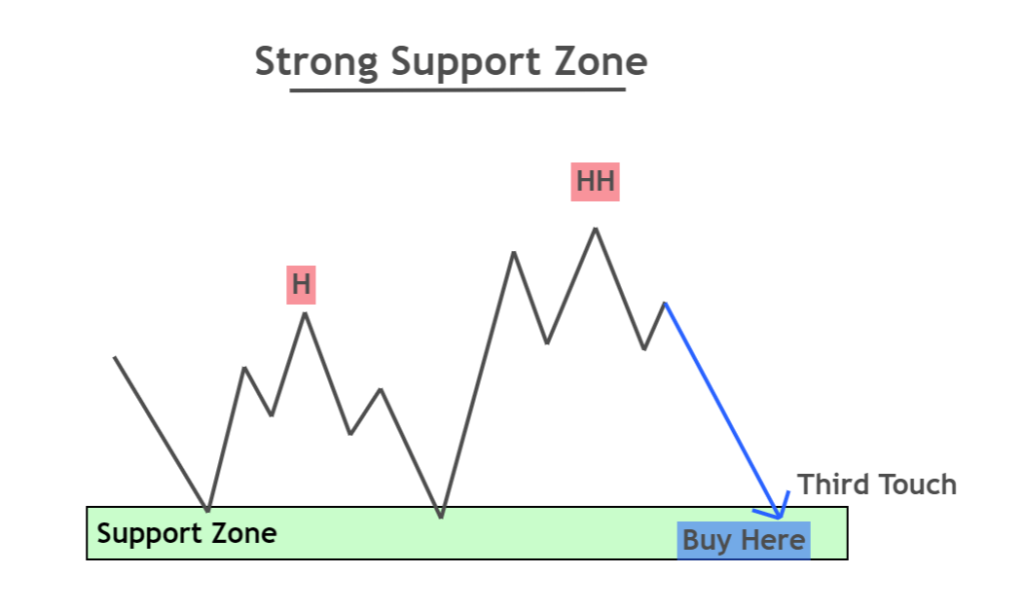
A zone will act as a valid support zone if the price bounces at least two times from this zone and makes a higher high.
It is advised to place buy orders on the third touch of the support zone because it is psychological.
There are two requirements you need to confirm for a high probability support zone
- At least two touches of the support zone
- Higher high formation
It would help if you bought on the third touch of support zone for high probability trend reversal and place stop loss below the zone.
What is a resistance zone?
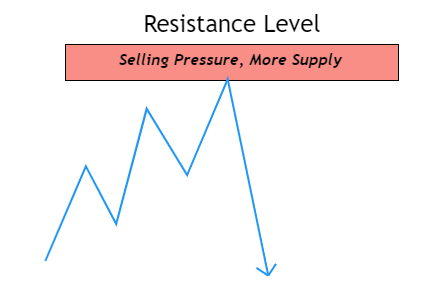
Resistance zone means the zone where more numbers of sellers are willing to sell a specific currency or stock. It is a bearish trend reversal zone in technical analysis.
Resistance zones provide a trader with the opportunity to sell a particular stock or currency.
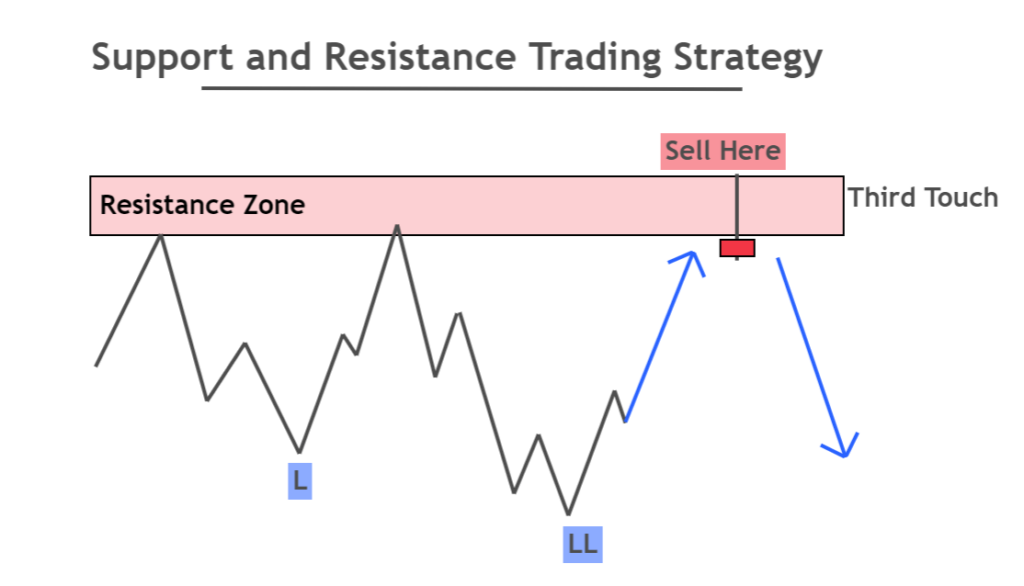
How to identify a valid resistance zone?
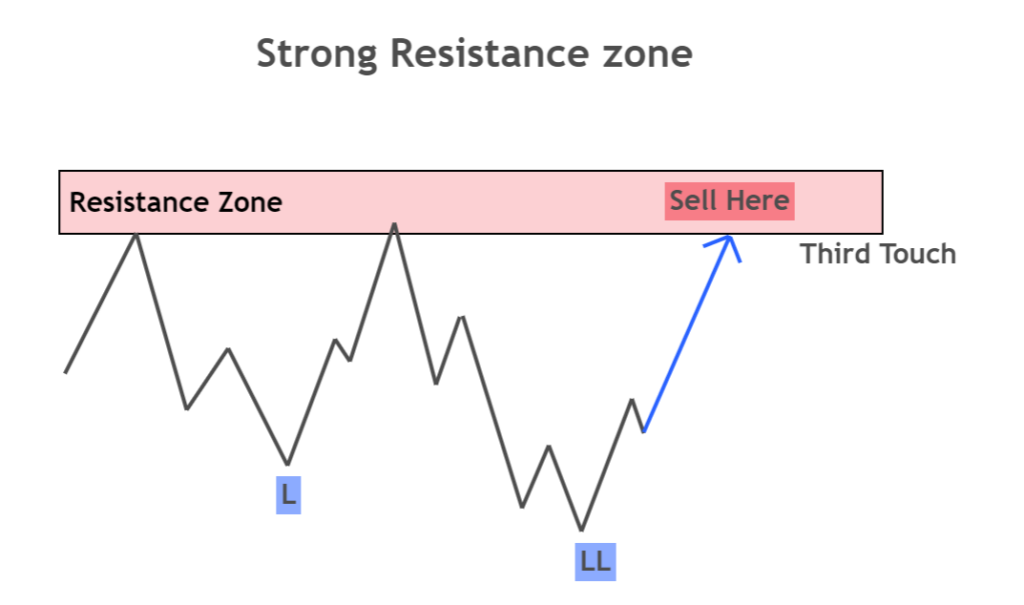
For a valid resistance zone, the price should bounce at least two times from the zone with a lower low formation.
You should place a sell order when the price bounces the resistance zone for the third time and place stop loss above the resistance zone.
Support & Resistance trading strategy
The probability of trend reversal from support or resistance zone can be increased by adding other technical tools like candlestick patterns because a strategy comprises several factors like risk management, risk-reward etc.
So here, I have added a confluence of a candlestick pattern like a pin bar or engulfing candlestick with support and resistance.
Buy signal
After finding a valid support zone, wait for the bullish pin bar or bullish engulfing candlestick at the support zone. Then place a buy order with stop loss below the zone or below the candlestick pattern.
Take profit levels can be measured by using the Fibonacci tool.

Sell signal
After detecting a valid resistance zone, wait for a bearish pin bar or bearish engulfing pattern at the resistance zone. Then place a sell order with stop loss above the zone or above the candlestick.
The last lower low on the chart can also be used to take profit level. You can also use the Fibonacci tool.
The bottom line
The conclusion is that support and resistance are the primary tools, and you should use these tools in your trading strategies to increase the winning ratio. The traders also use support and resistance to forecast currency pairs on the higher timeframe and then trade the trend on lower timeframes.