
Definition
A swing point is a price point from which a minor or major trend reversal happens. It is a price action term that shows turning price points on the candlestick chart.
Price action is the most advanced form of technical analysis, and retail traders most widely used price action to predict the price trend. The swing point is the leading indicator that forecasts the future trend reversals on the price chart.
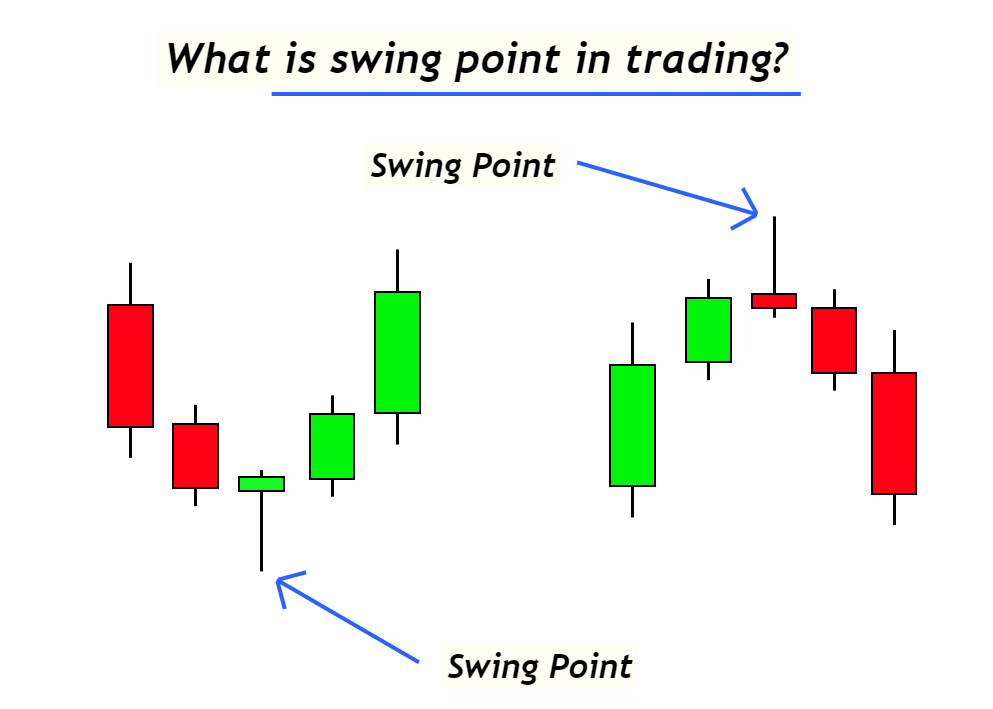
Advanced traders use the swing points to confirm minor trend reversals in the market.
How do we identify the swing points in forex trading?
There are two types of swing points, and the method of finding these swing points is different. Many indicators available on tradingview can find those swing points for you. But if you master this price action term yourself, it’ll be easy for you to identify the trend using the higher highs, lower lows strategy.
Types of the swing point
- Swing high point
- Swing low point
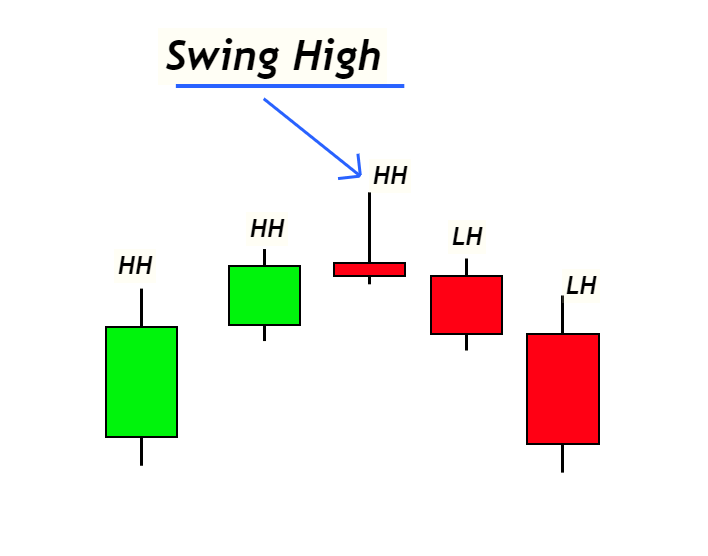
Swing High
When two consecutive higher highs form on the left side of a candlestick and two consecutive lower highs form on the right side of a candlestick, the highest point of the middle candlestick is called swing high.
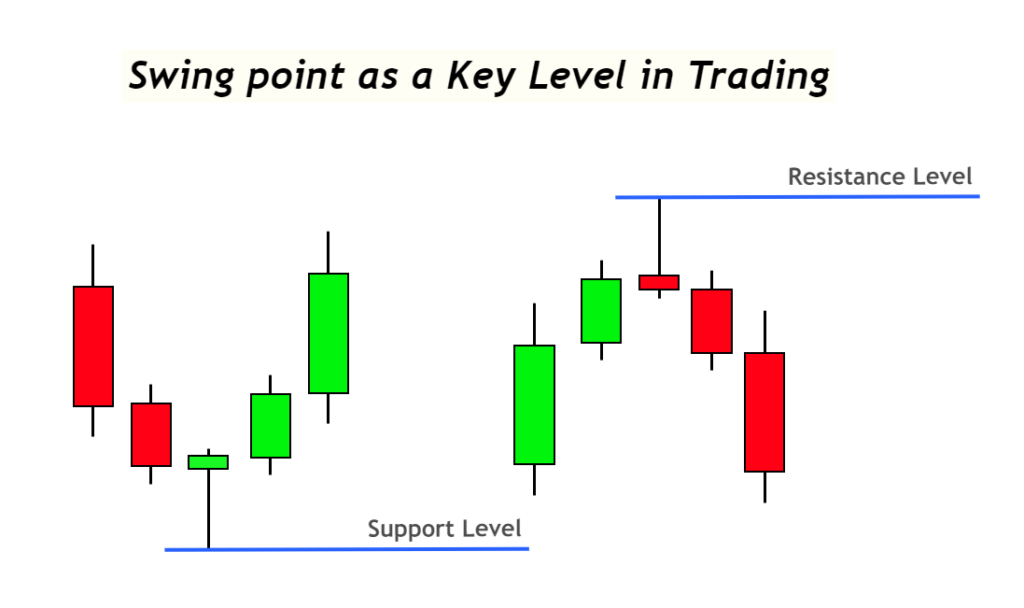
Swing high is the highest price in the specific number of candlesticks range. It is used as a key level on the price chart. Many retail traders use the swing high points as resistance or key level. Because These are psychological levels, retail traders benefit from these price levels.
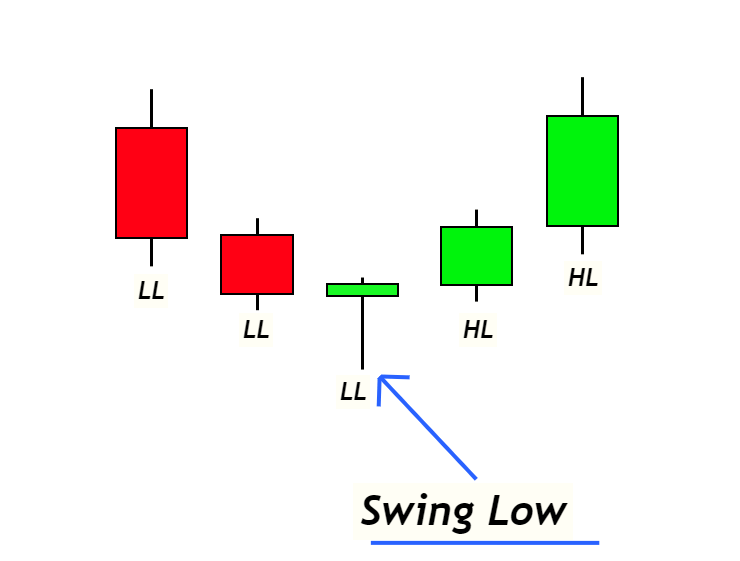
Swing low
When two consecutive lower lows form on the left side of a candlestick and two consecutive lower highs form on the right side of the candlestick, the lowest price of the middle candlestick is called the swing low.
Swing Low is the lowest price in the specific range of candlesticks on the price chart. It also acts as a swing low and retail traders use it as a support level.
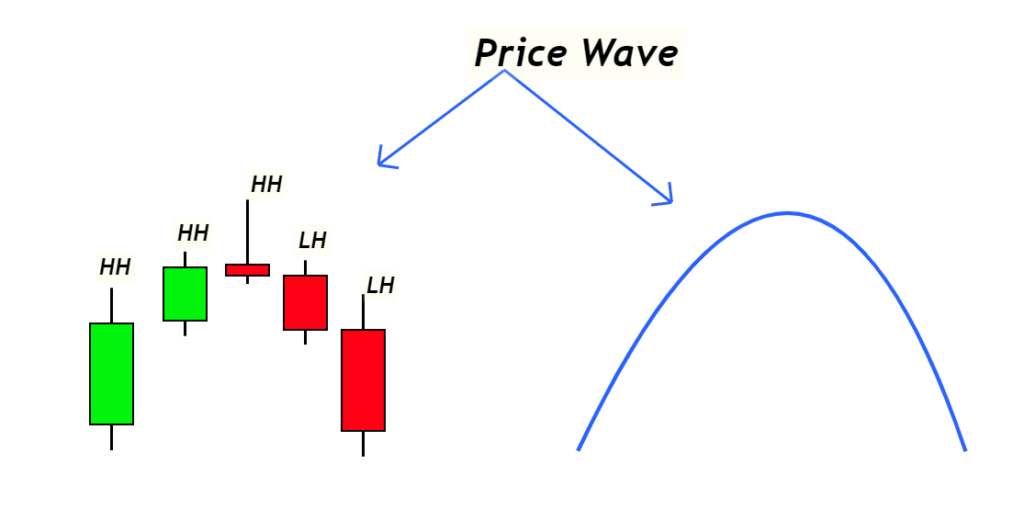
What is a price wave, and how is a price wave related to swing points in trading?
Price always moves in the form of sine waves on the candlestick chart. It is like the ups and downs of nature. And the market is purely natural. That’s why when we relate the price patterns with nature, we’re reading the price action in reality.
A Sine wave in mathematics consists of the highest and lowest points. Similarly, on the candlestick chart, the Sine wave forms with the highest and lowest price. The highest price is called swing high, and the lowest price is named swing low.
The sine wave is an ideal waveform, but in fundamental markets, the wave will approach the perfect pattern. For example, during a bullish trend, the bullish price move will be greater than the bearish price move. Whereas, during a bearish trend, a bearish price move will be greater than a bullish one. That’s why the wave patterns only approach the ideal sine wave.
Importance of swing high and low in trading
The primary benefit of swing highs and lows in price action trading is that it tells us about the beginning of a new trend.
Because when a swing low forms, it symbolizes a beginning of a new bullish trend. In comparison, the formation of swing high shows the start of a new bearish trend.
Let’s understand with an example.
A wave is further a combination of an impulsive and a retracement wave. So when a wave pattern completes on the chart with a swing low or high, it is a high probability signal of trend reversal like in the image below.
Another important fact of swing points is that it helps to draw the trendlines and support resistance zones.
Because the touch points of a trendline are always the swing price points, you should always draw a trendline meeting the swing lows or swing highs. If a price point is not a swing point, you should avoid drawing trendlines from such points. This will help us to draw a valid trendline.
There are many other benefits of swing points in price action trading, like finding key price levels, identifying trend waves, etc. You’ll know many other benefits when you’ll practice this price pattern on a live price chart.
Conclusion
Understanding the swing points is mandatory for all price action traders because if you don’t identify the swing points, you will make many mistakes in finding other chart patterns. It is an essential concept. Without swing points, you will not be able to draw trendlines, Elliott waves, and chart patterns correctly.
That’s why I will recommend every retail trader practice the swing points to learn to trade using price action. It is a beginner’s step to master price action trading.
Ok