

Definition
The Symmetrical triangle pattern is a reversal/continuation chart pattern that resembles the shape of a sideways triangle on the chart in trading.
A sideways symmetrical triangle means the price will consolidate inward on the chart and each next wave will be shorter than the previous wave. Like an inside bar candlestick pattern.
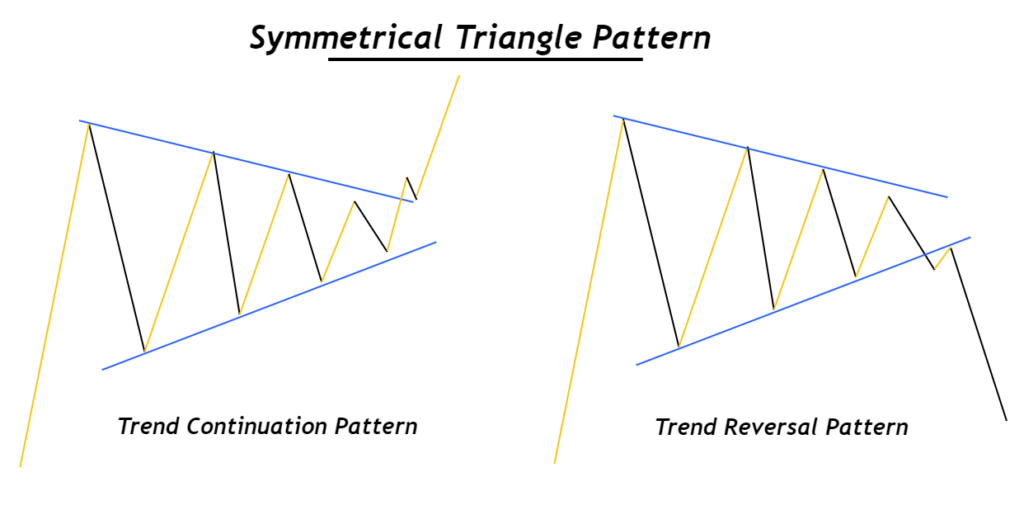
It acts as both a reversal and continuation chart pattern. The breakout of the triangle pattern decides the direction of the price trend.
How to identify symmetrical triangle on chart?
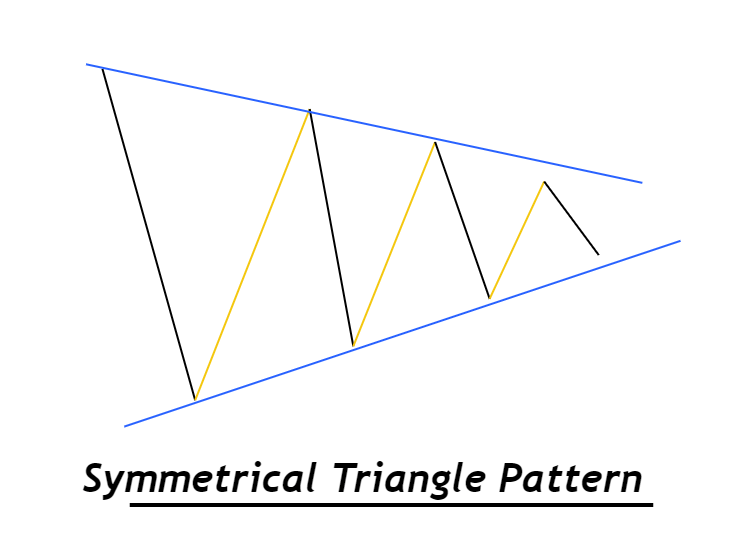
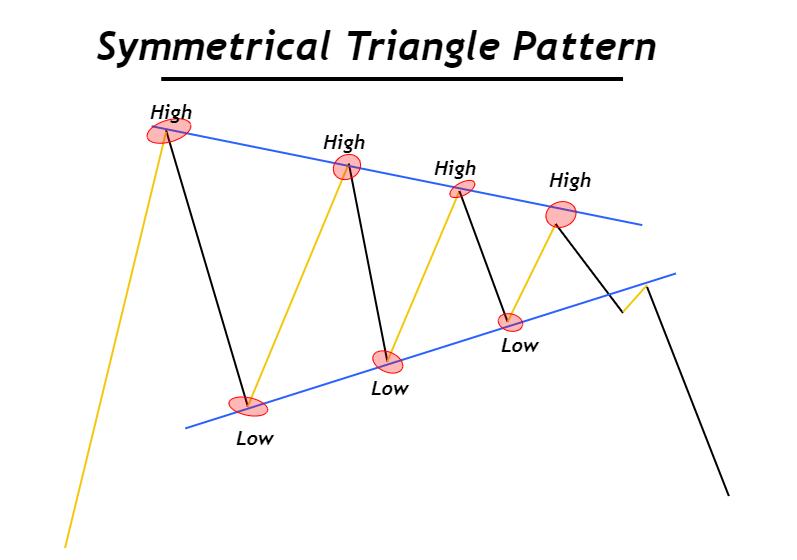
A price pattern in which each next wave is shorter than the previous wave is called a symmetrical triangle pattern. There are certain rules you need to practice to find out perfect patterns on the chart.
- There must be at least four waves in series to identify a good symmetrical pattern.
- It must form at a key level for example support and resistance or supply and demand level
- Draw trendlines meeting the highs and lows of waves.
Look at the image below for a better understanding of this triangle pattern concept.
Psychology of symmetrical triangle pattern
In the psychology heading, you will learn about the reason behind the formation of a price pattern. Without knowing the real logic, it does not make sense to trade a pattern either in a bullish or bearish direction. That’s why reading the price will help you to trade with a strong logic.
Why does a symmetrical price pattern form?
It is an indication of indecision of price. It means the price is looking for a direction. Market makers are deciding the future direction of price either bullish or Bearish.
So symmetrical triangle pattern is a signal that market makers are deciding the direction. The breakout of the symmetrical pattern shows the direction.
- If the upper trend line of symmetrical pattern breaks, then price trend will be bullish. It means after a long decision, market makers have decided a bullish price direction.
- If the lower trendline of symmetrical triangle pattern breaks, then price will start a bearish trend. It means after decision, institutional traders have decided a bearish price direction.
This is the main reason for this chart pattern formation. You will make better decisions while trading when you will read the price.
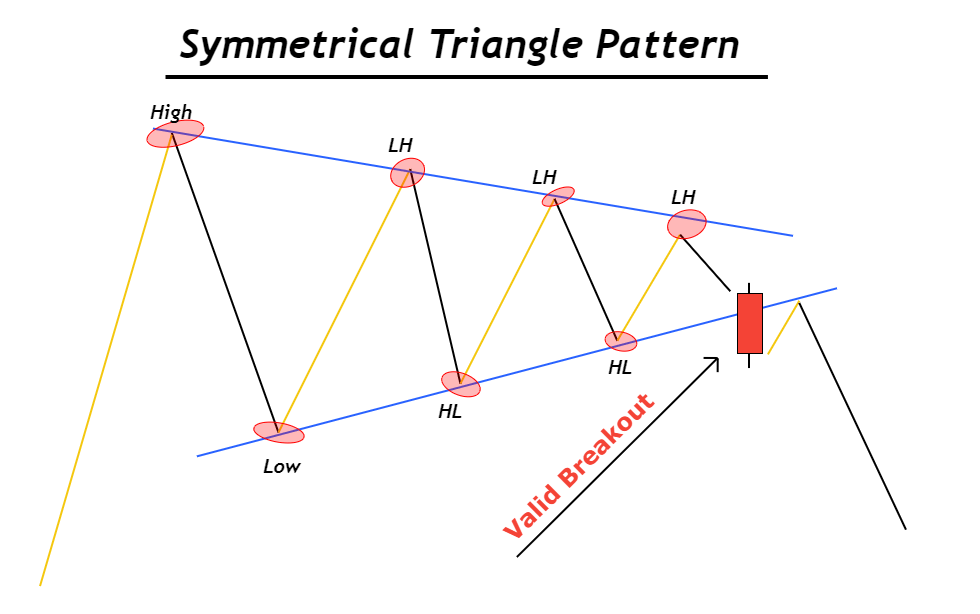
How to identify a valid breakout?
Identifying a valid breakout of chart patterns is very important because market makers will try their best to capture the retail traders with simple false breakout strategies.
There are two simple methods that will help you to tackle false breakout.
- Trading with trend only
- Big candlestick breakout
The most common method to avoid false breakout is by trading only in the direction of the trend. Because market makers give false breakouts against trends always. So you should become a patient trade and wait for the market makers to break only in the direction of the trend.
Another method to avoid false breakout is by looking for a breakout with a big body candlestick. A big body of candlestick represents the price momentum. So a breakout with large price momentum indicates a valid breakout. Candlestick should have a small wick and large body than the last 20 to 50 candlesticks.
Symmetrical Triangle trading plan
This chart pattern is not mostly to do trading because it offers a very low risk-reward ratio. But it is used with the confluence of any other chart pattern to increase the risk-reward ratio. You can use this pattern with another strategy. Use it for identification of market direction like market makers do.
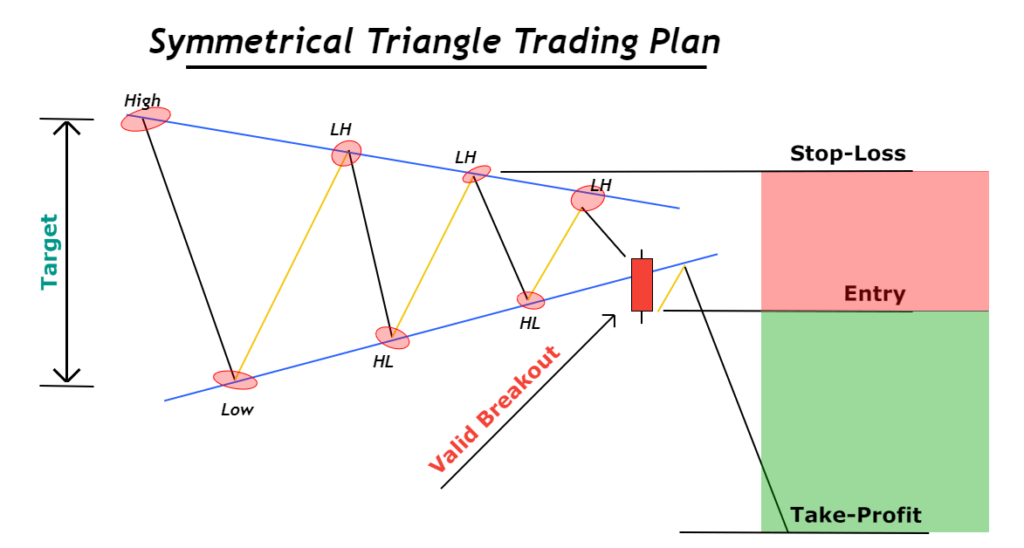
When to open an order
Open an order just after a valid breakout of trendline forming a Symmetrical Triangle pattern. Buy/sell order depends on the breakout conditions. Upward breakout means buy order and downward breakout means sell order.
Stop-loss level
The Stop-loss level is always above the second last lower high of price waves (in case of a downward breakout). On the other hand, place stop loss below the second last higher low of price waves (in case of upward Breakout)
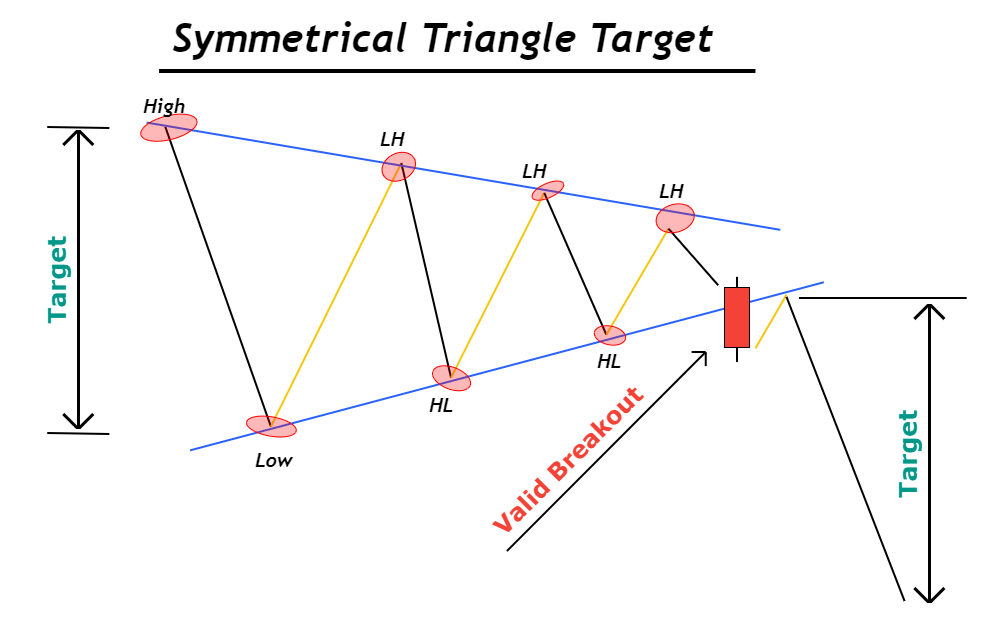
Target level
Measure the height of the base of the symmetrical triangle. Now mirror that measured height above or below the breakout point. It will indicate the take profit level.
Look in the image below for a better understanding of the pattern
Pro Tip: The risk-reward ratio for a symmetrical triangle pattern should not be less than 1:1.
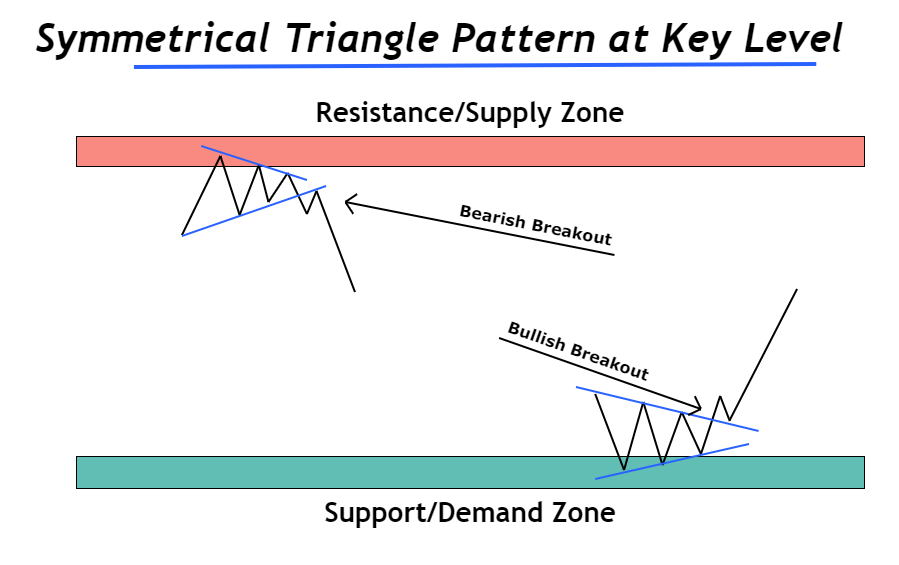
Best working conditions for symmetrical triangle pattern
Before trading, filtering the best working conditions will increase the probability of winning in a trade. There are few conditions that are the best working conditions for this chart pattern.
- Symmetrical Triangle pattern should form at key levels. For example formation at key levels. A bullish of symmetrical pattern should happen at support or demand zone. And a bearish breakout should happen at Resistance or supply zone
- It should form at the top or bottom of price chart. For example, formation of symmetrical pattern during overbought or oversold conditions will increase the probability of winning.
- This chart pattern will not work during sideways price movement. It works best in trending conditions only.
Conclusion
The Symmetrical Triangle chart pattern is the best price action pattern that will help you to forecast the future direction of the market. It will also inform you about the conditions of a price or an asset.
Reading the price is the ultimate guide to price action trading. By trading with logic. You will become a profitable trader.
Before adding a confluence with strategy, first, backtest it.
FAQs
It works in all timeframes but we will recommend you to trade any timeframe above 15M. Because below 15-minute timeframe, it will become difficult to identify false breakouts due to the high frequency of trading in lower timeframes.
The Breakout of the chart pattern will decide either this pattern will act as a continuation chart pattern or reversal chart pattern because of symmetrical price behavior.