
Definition
The Strat patterns are a set of specific price bar sequences used to identify trend directions, potential market reversals, and trade entry points in a multi-timeframe trading approach.
Rob Smith developed the strat patterns trading strategy using price action. He uses the concept of broadening and contracting nature. Because waves contract and expand, it is a natural process. He applied this method in trading and made a very high-probability trade setup using multiple timeframes and other confluences.
In this article, I will explain the strat patterns in detail. Believe me; it is a very high-probability trading system for forex, stocks, and indices traders. So make sure to read the full article without skipping any step.
How to identify the strat patterns?
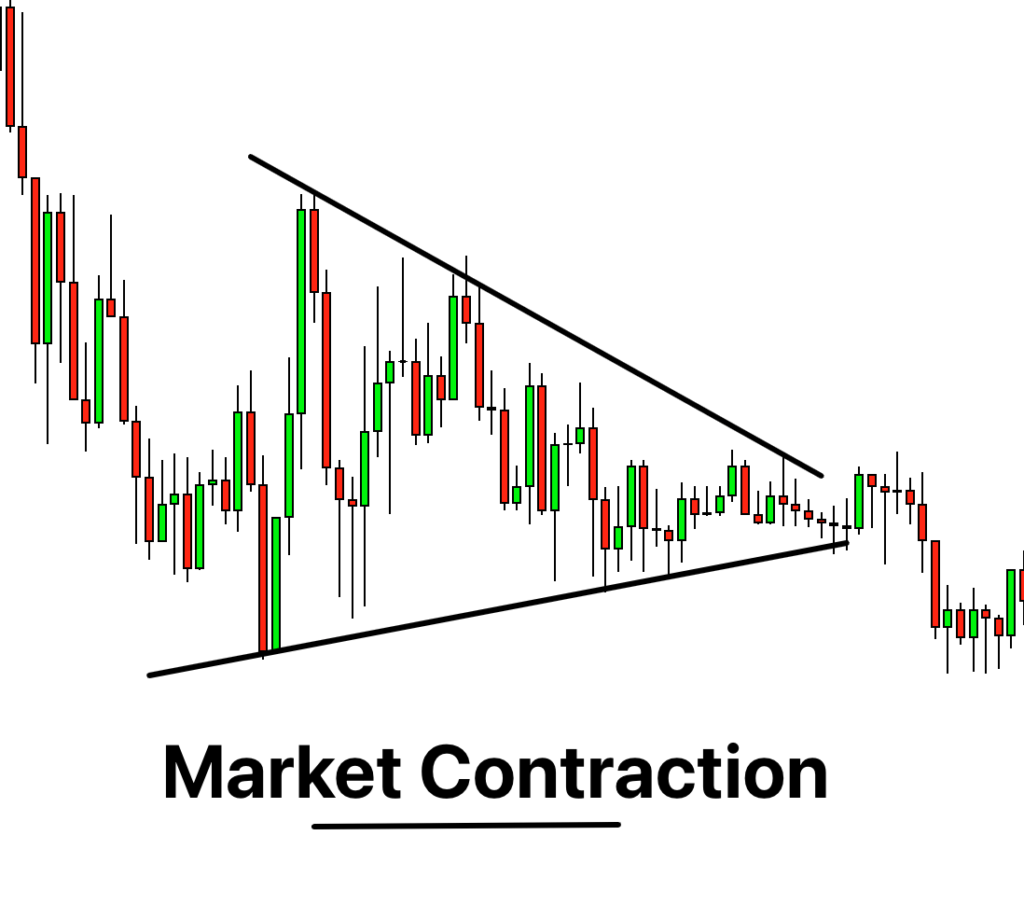
To find the strat patterns on the chart, you must first learn about broadening and contraction.
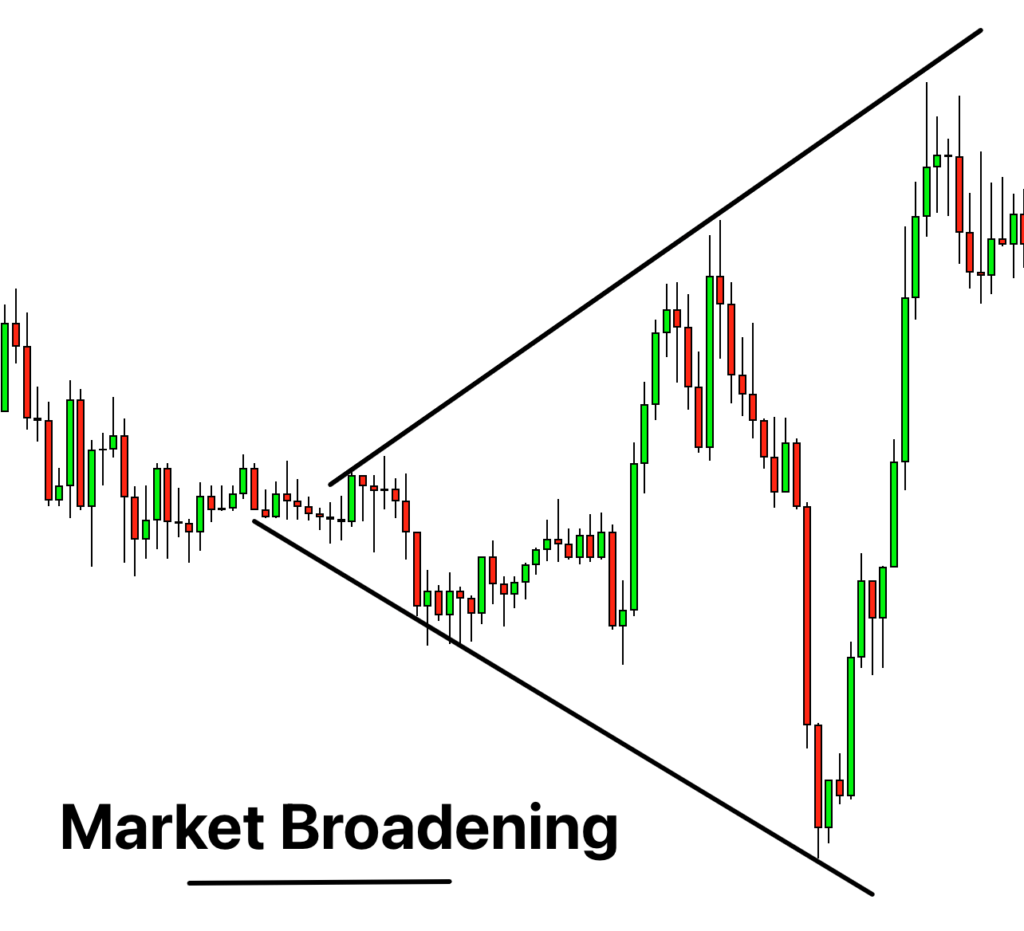
Broadening: According to the strat strategy, broadening is expanding the market. It means the price will make a bullish trend or bearish trend.
Contraction: in the contraction, the price will move inward towards a point. Each progressive wave will be smaller than the previous one.
Rob Smith has used these two natural concepts to forecast the market. These concepts represent a specific structure in the form of candlesticks on the chart. So he assigned a number to each candlestick and then used the combinations to make high-probability trades.
Types of candlesticks
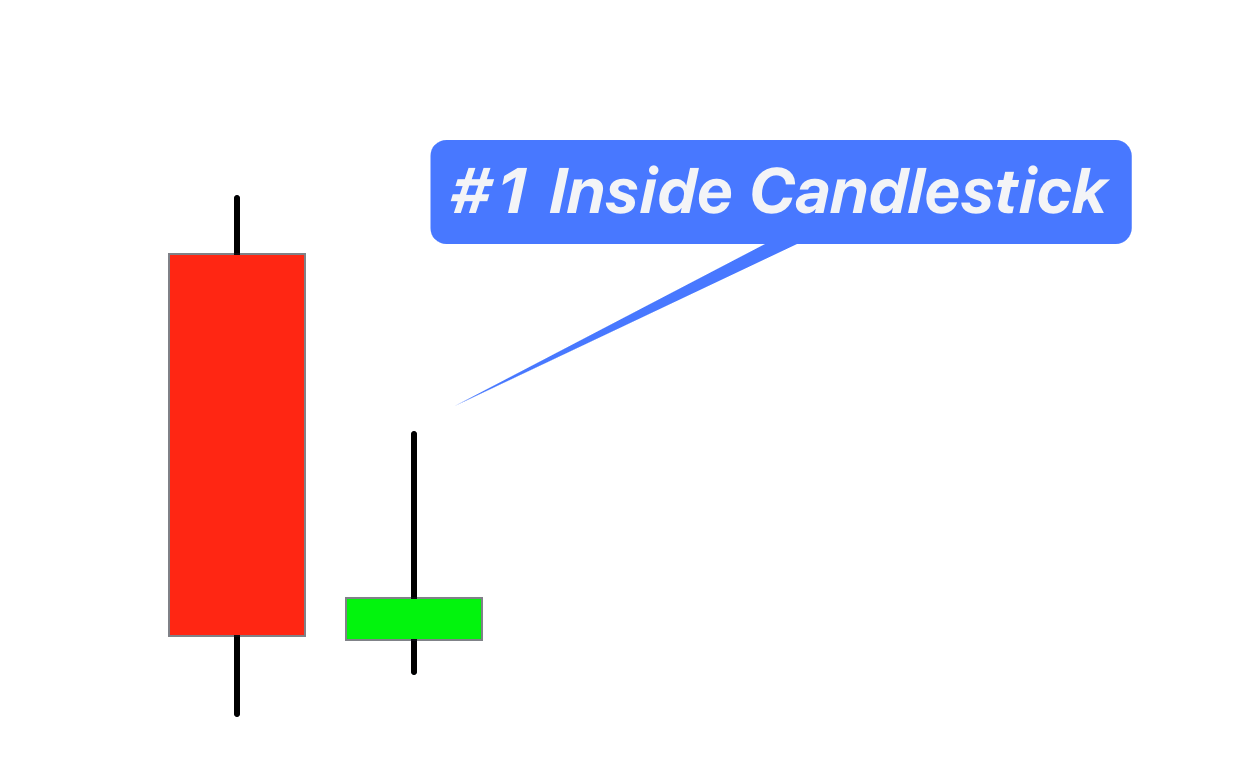
In the strat strategy, there are three major candlesticks:
- #1 inside candlestick: and an inside bar candlestick that forms within the range of the previous candlestick. It is a signal of indecision in the market.
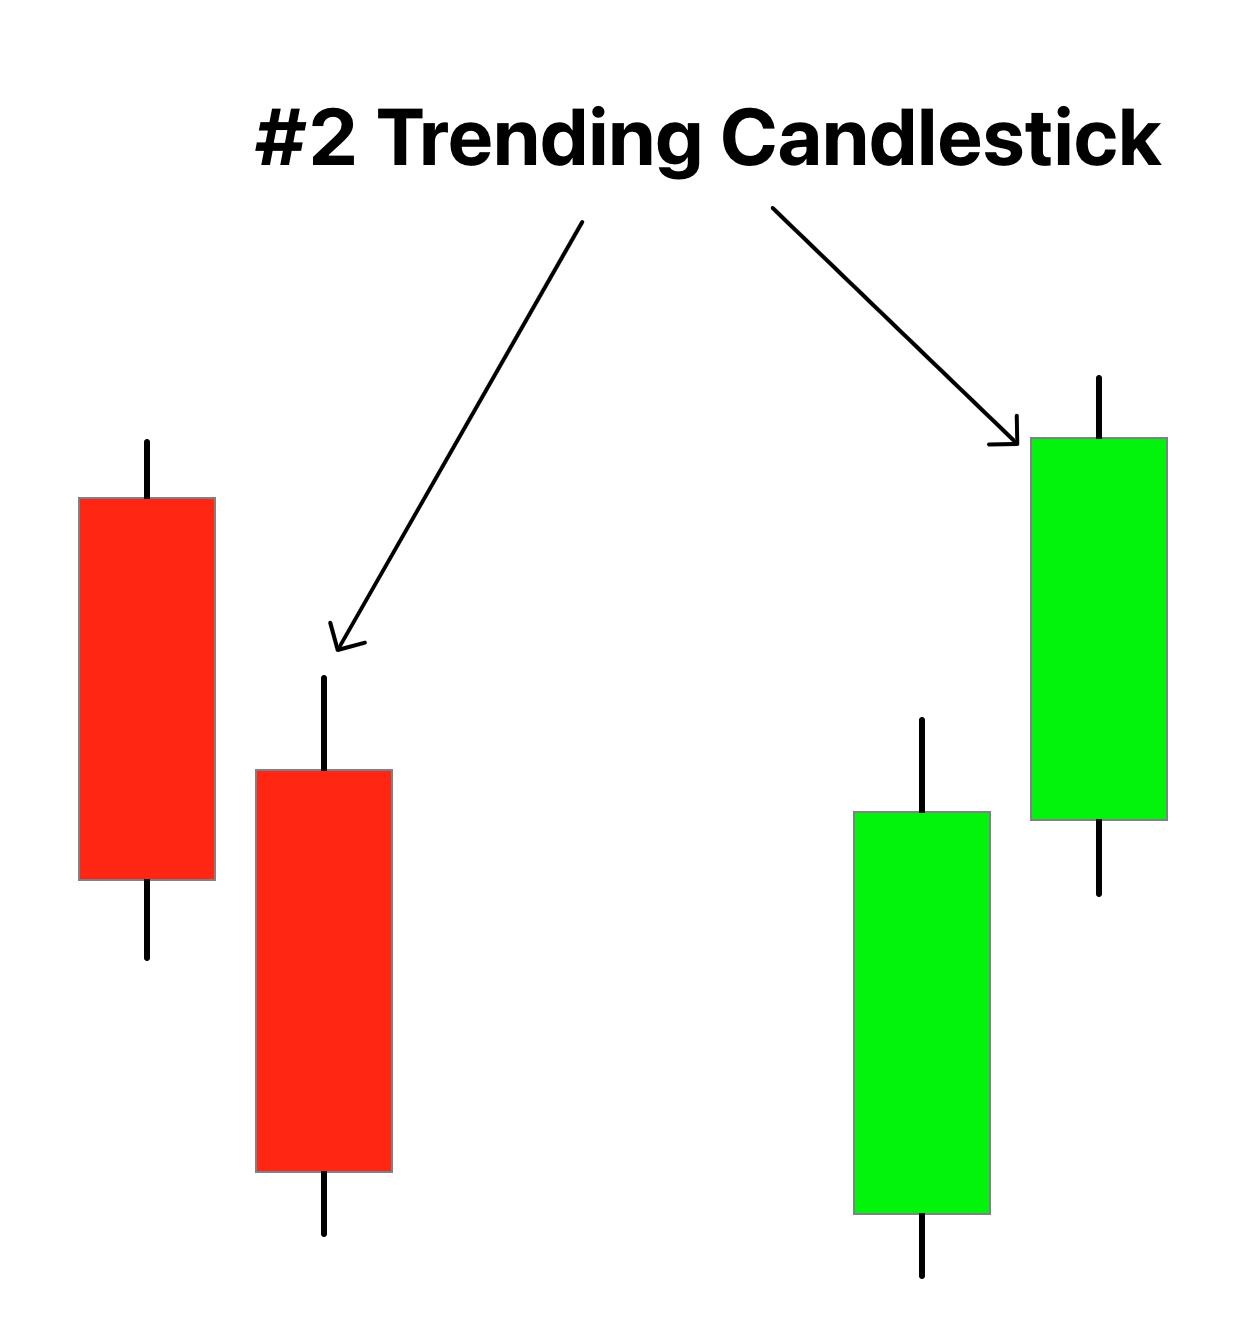
- #2 Trending candlestick: this candlestick shows the bullish or bearish trend in the market. The trend will be bullish if the closing is higher than the opening. However, the trend is bearish if the closing is lower than the opening. This candlestick must have a big body as compared to the wicks.
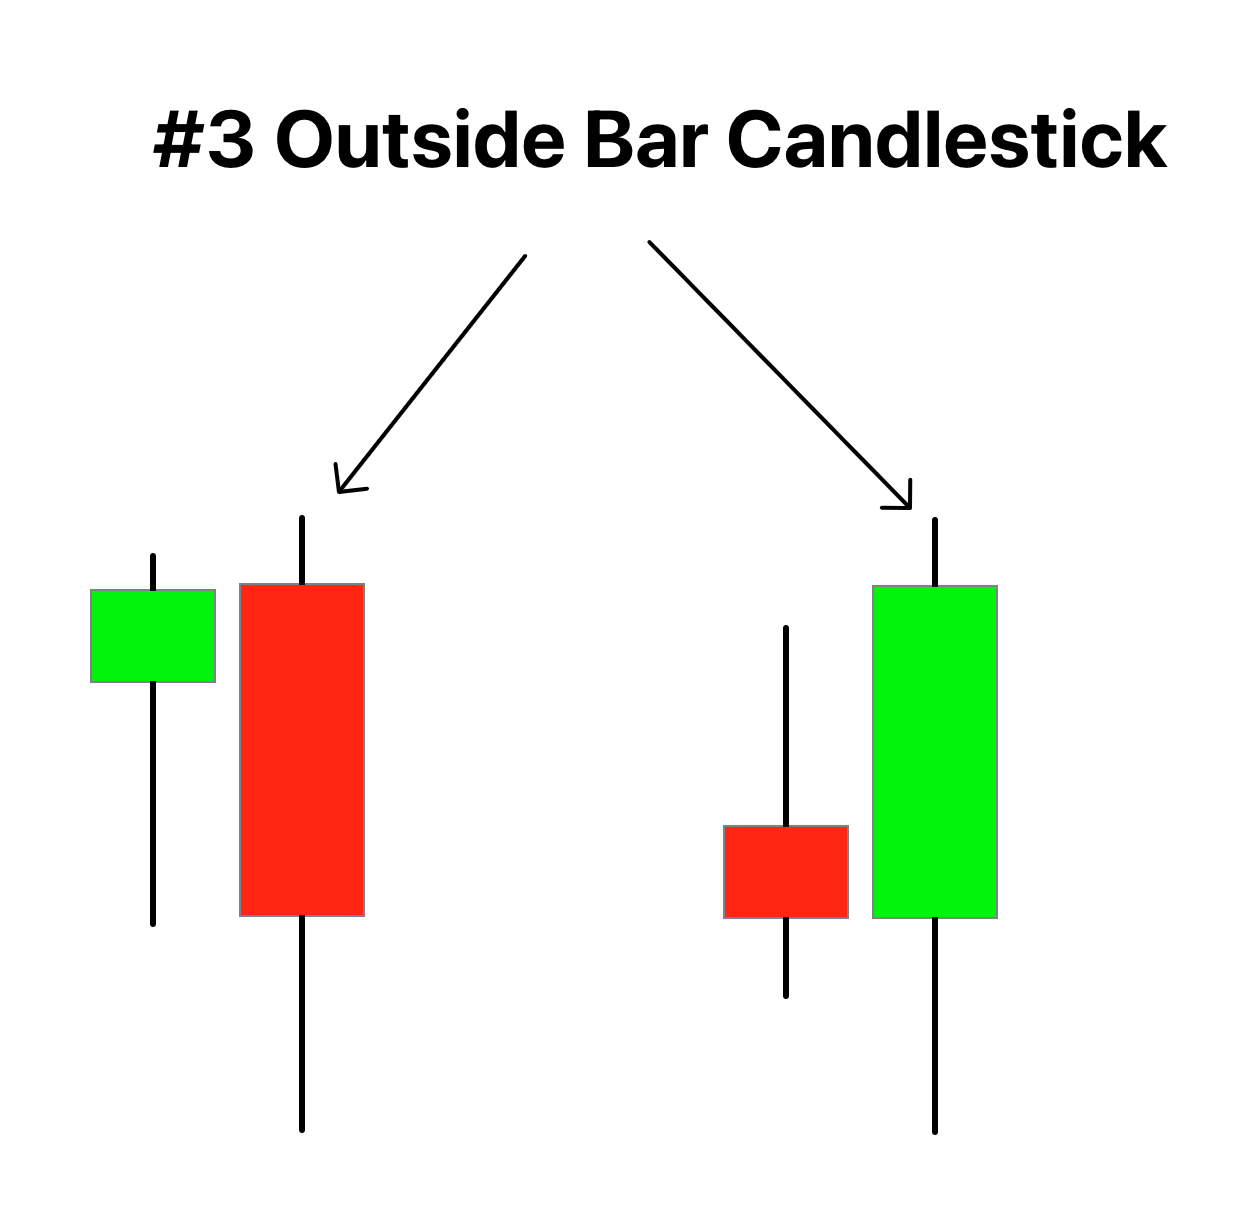
- #3 Outside bar candlestick: this candlestick makes higher high and lower low and fully engulfs the previous candlestick from high to low. It shows the broadening formation and signals the upcoming big trend reversal in the market.
The strat patterns
Based on the above three candlesticks, the strat patterns are divided into two categories.
In force patterns
These patterns forecast the current market. It shows where the price will move, either up or down. We will use this forecast to trade in the lower timeframe.
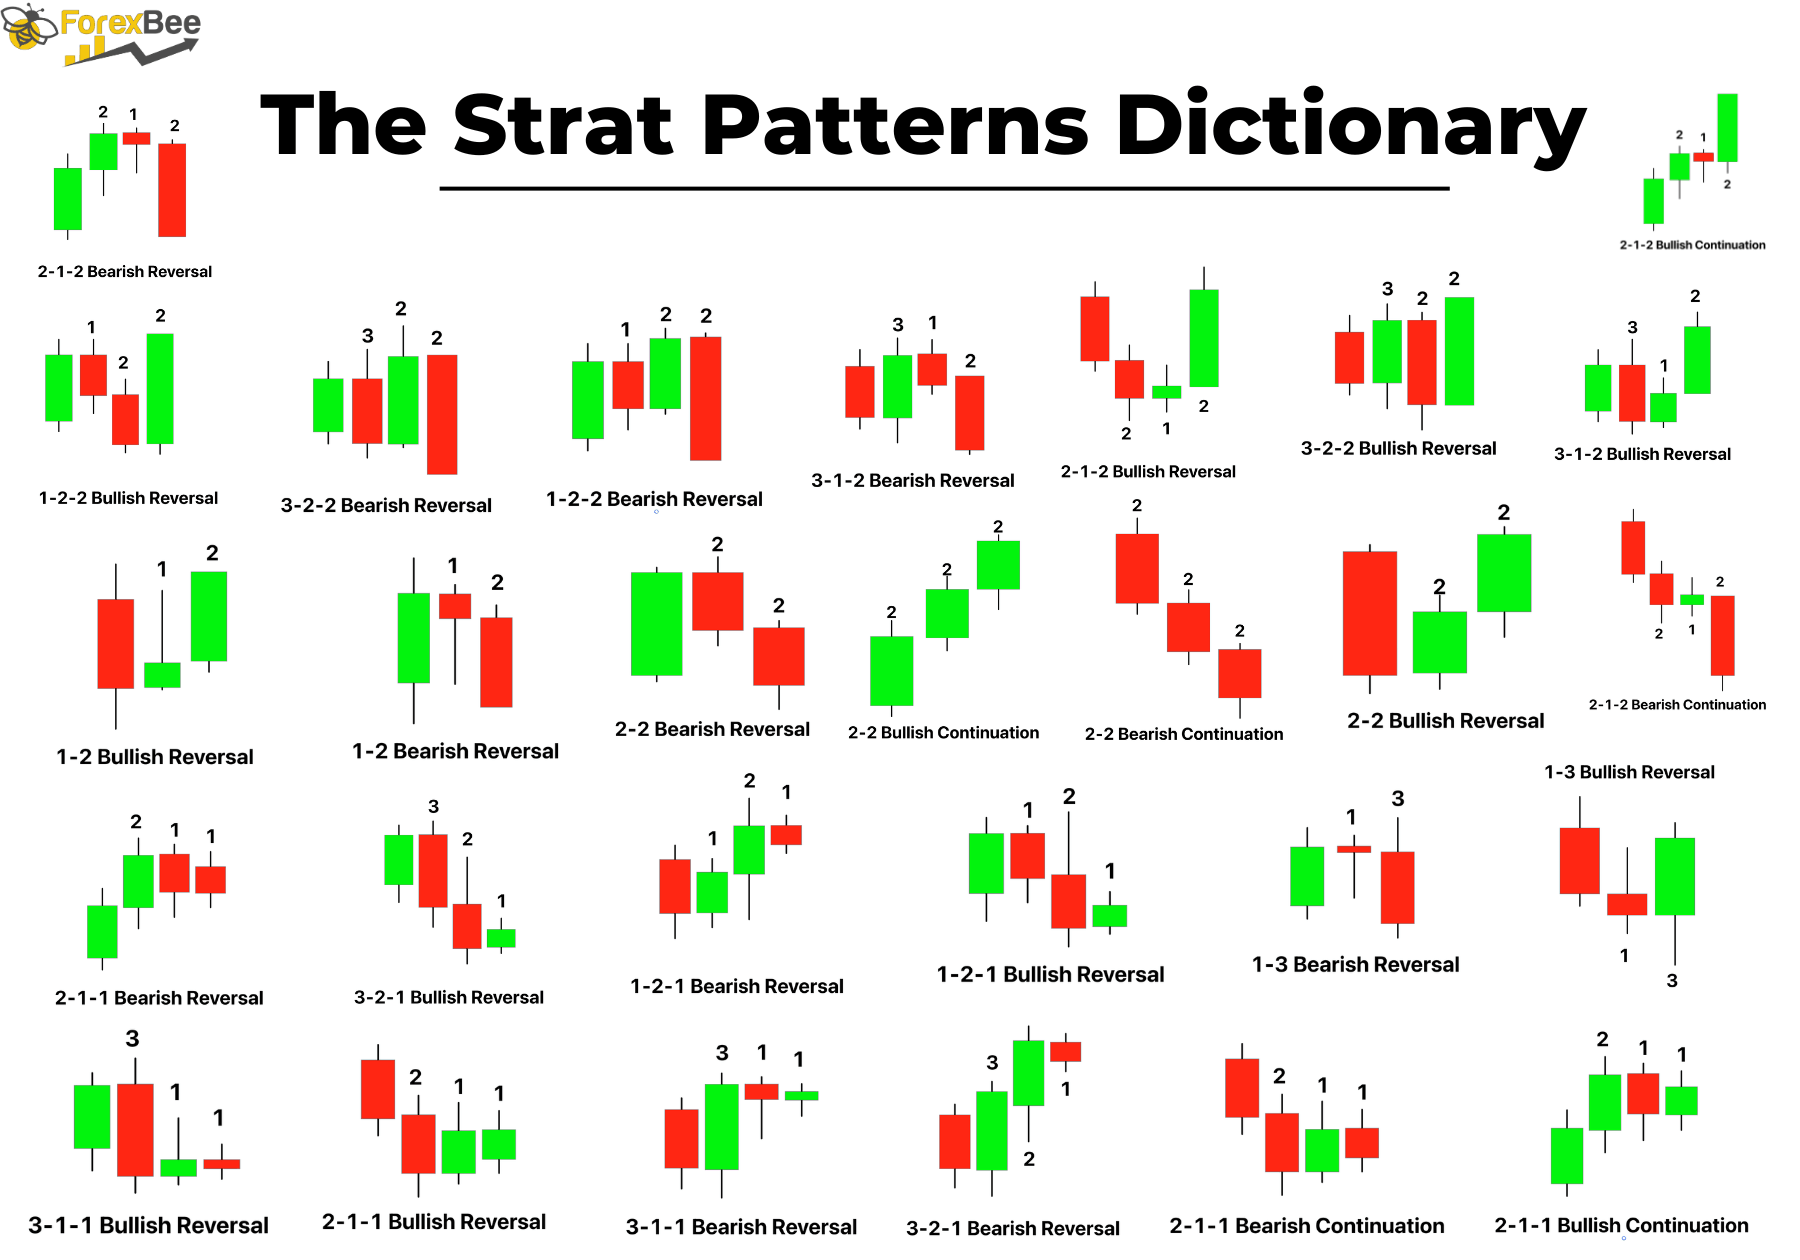
The in-force patterns are the following:
| The Strat Pattern | Forecast | Image |
|---|---|---|
| 1-3 bearish reversal | Bearish | 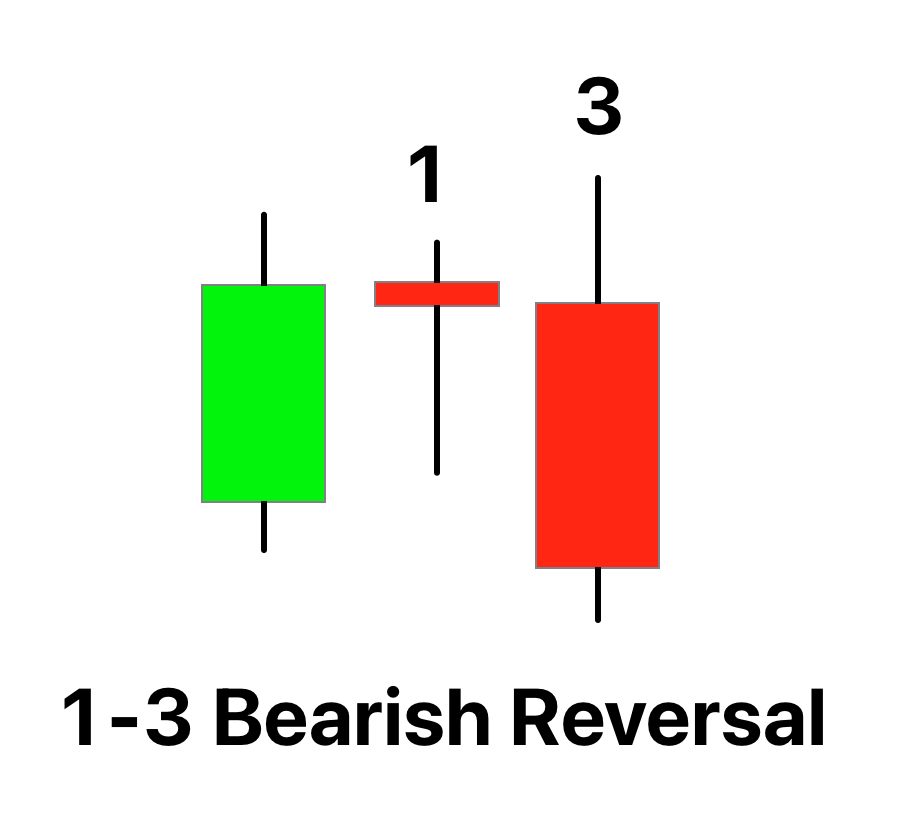 |
| 1-3 bullish reversal | Bullish | 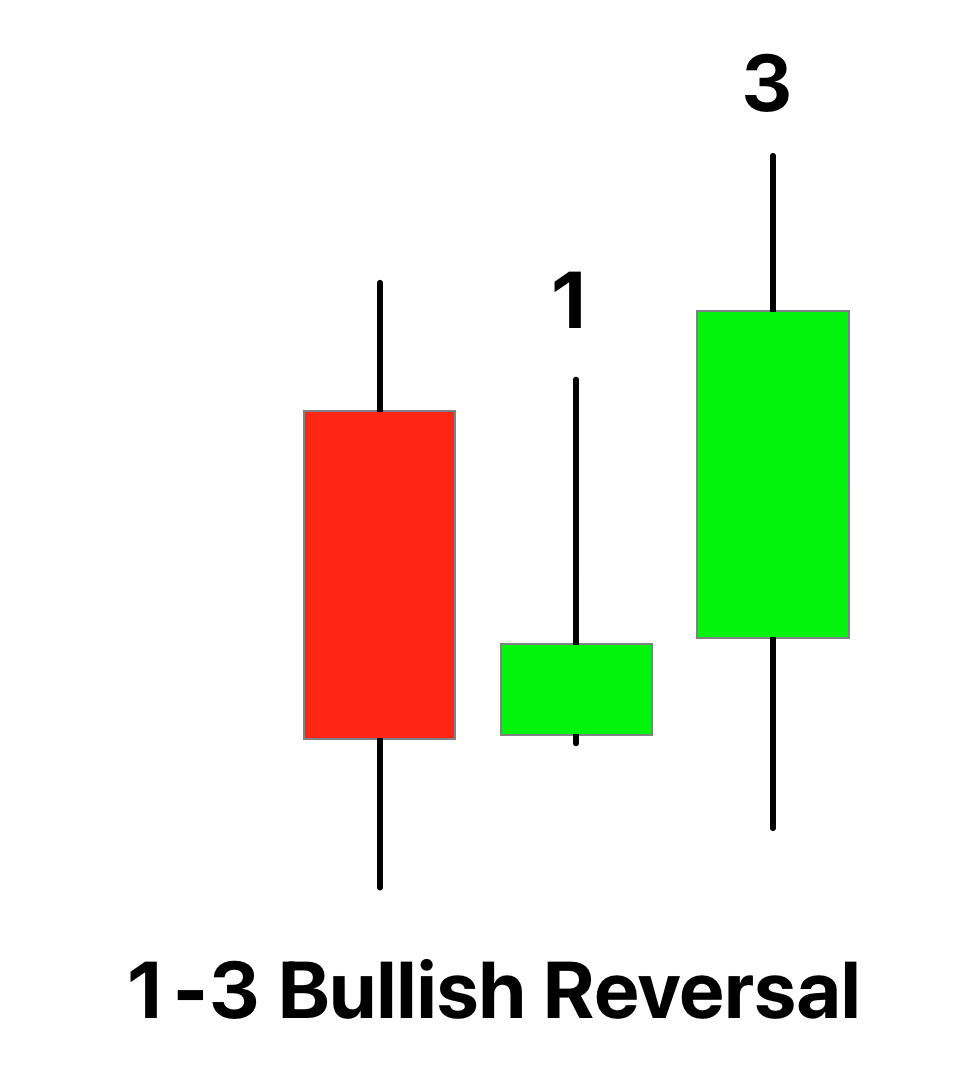 |
| 1-2 bearish reversal | Bearish | 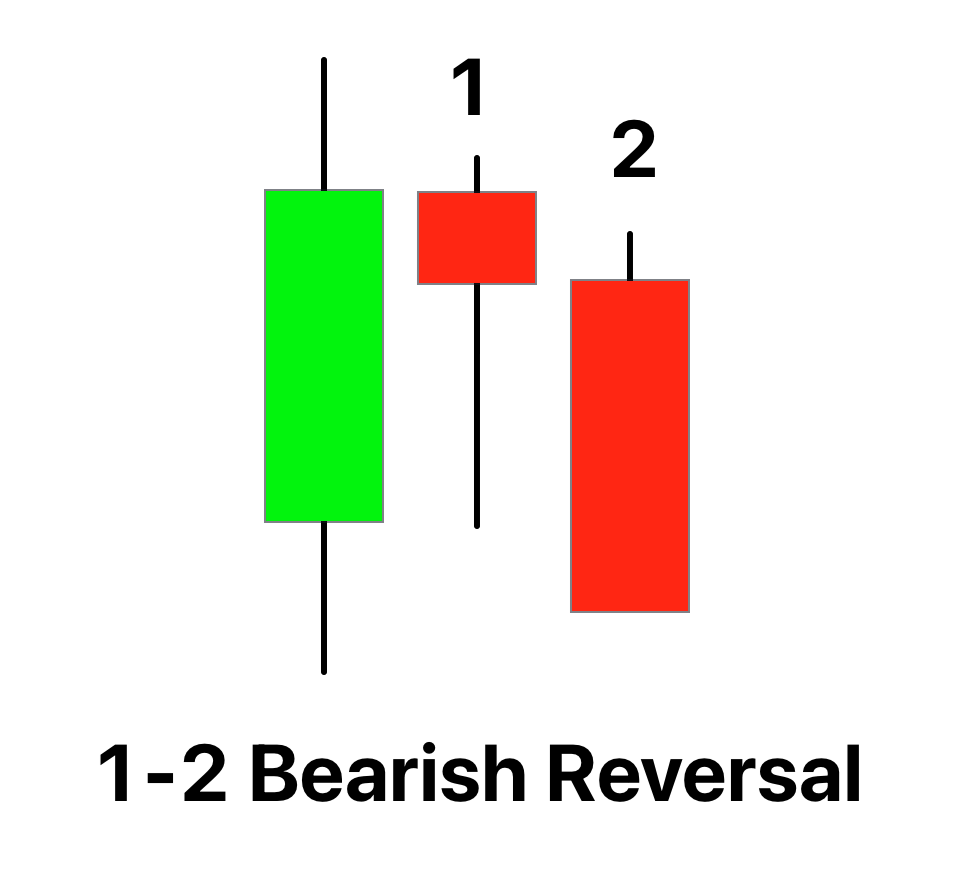 |
| 1-2 bullish reversal | Bullish | 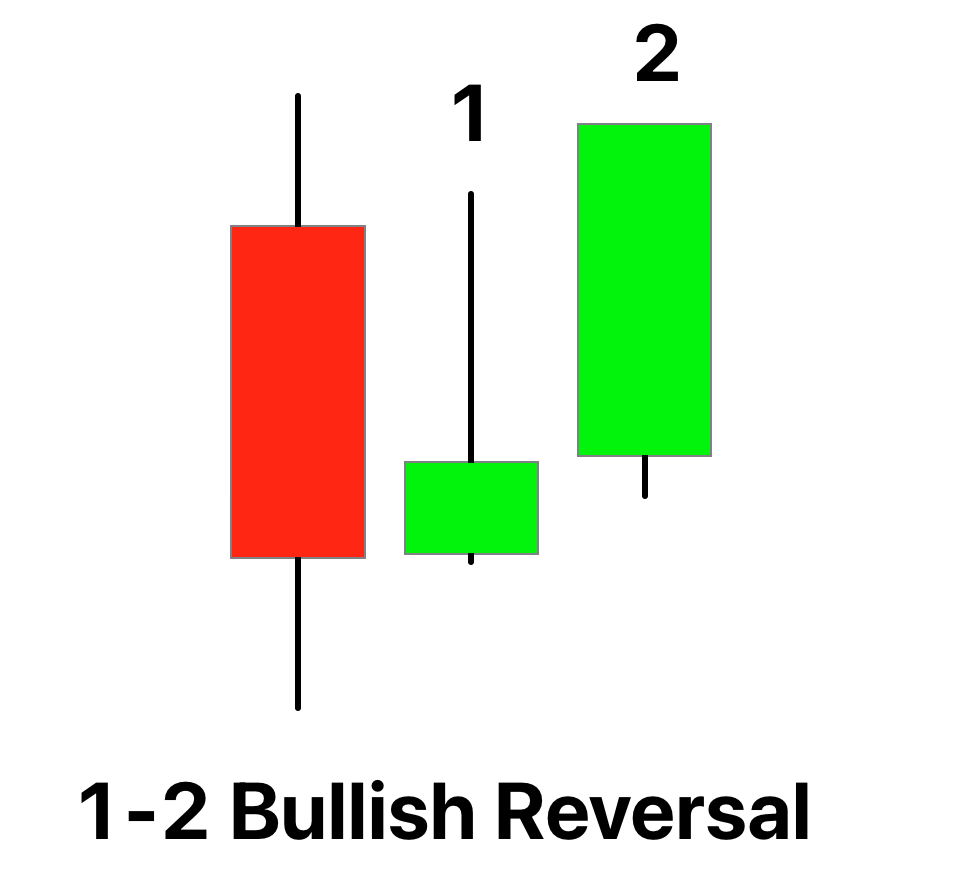 |
| 2-2 bearish continuation | Bearish | 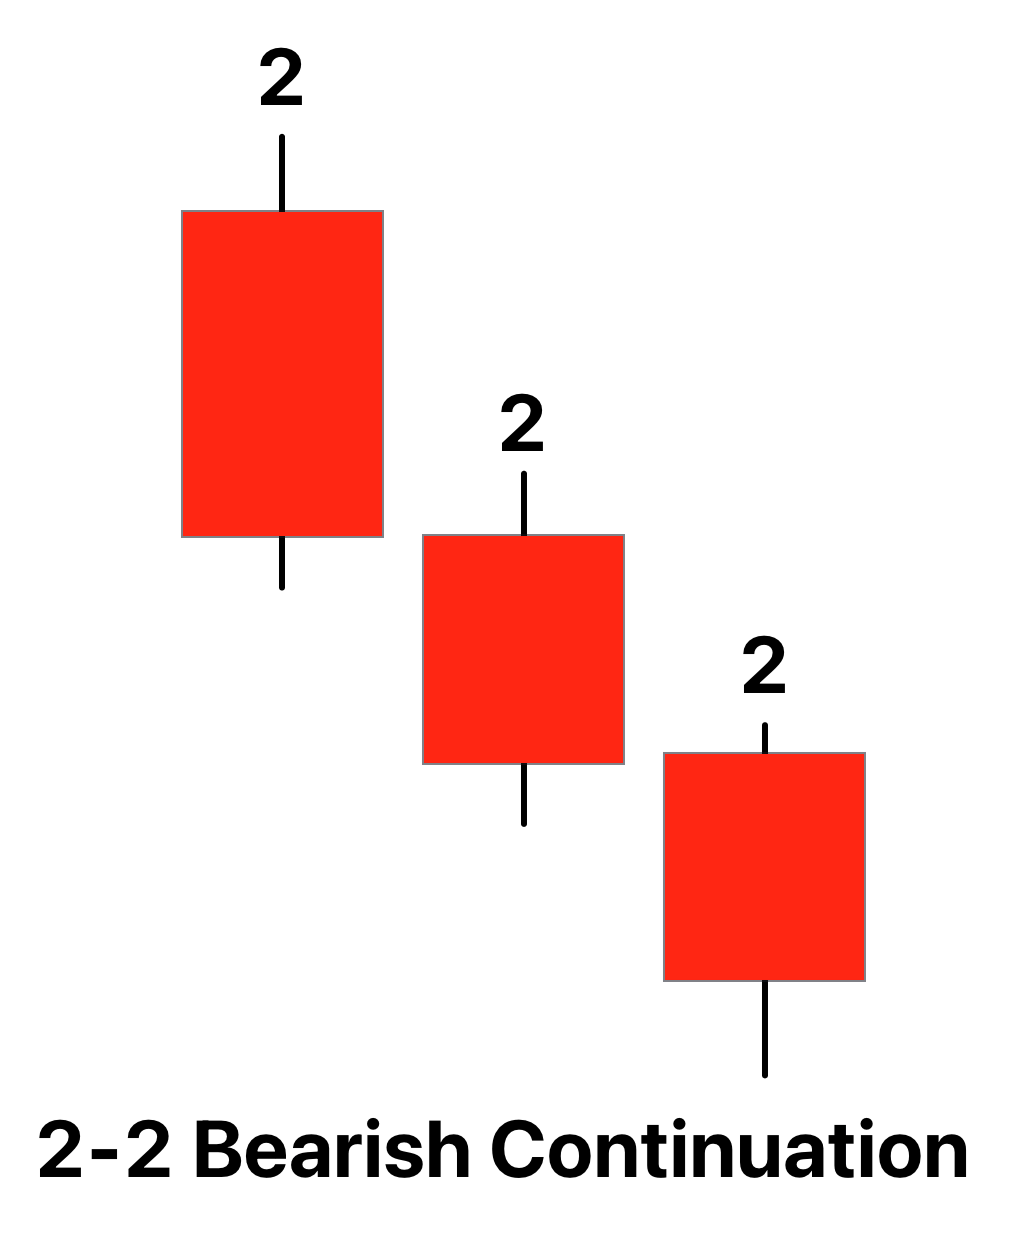 |
| 2-2 bullish continuation | Bullish | 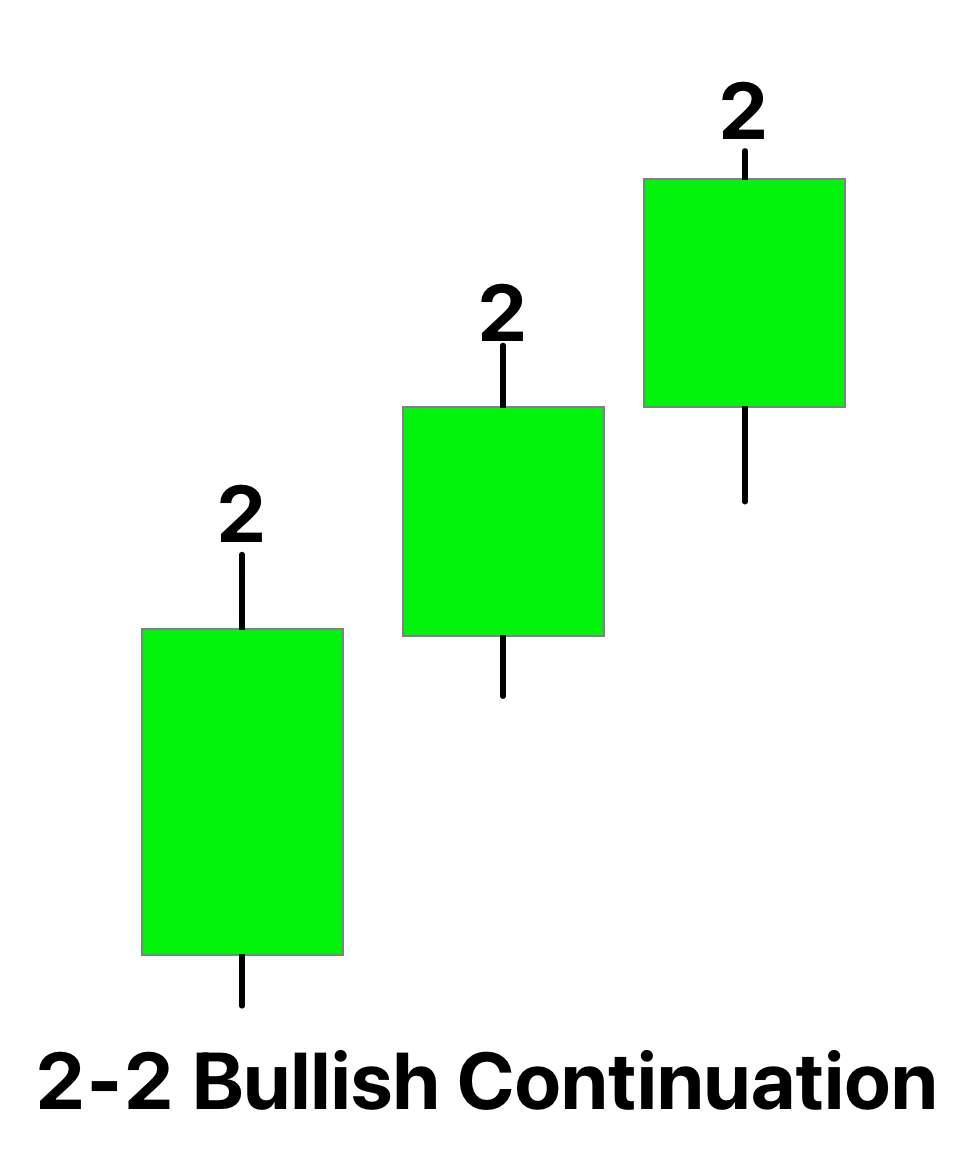 |
| 2-2 bearish reversal | Bearish | 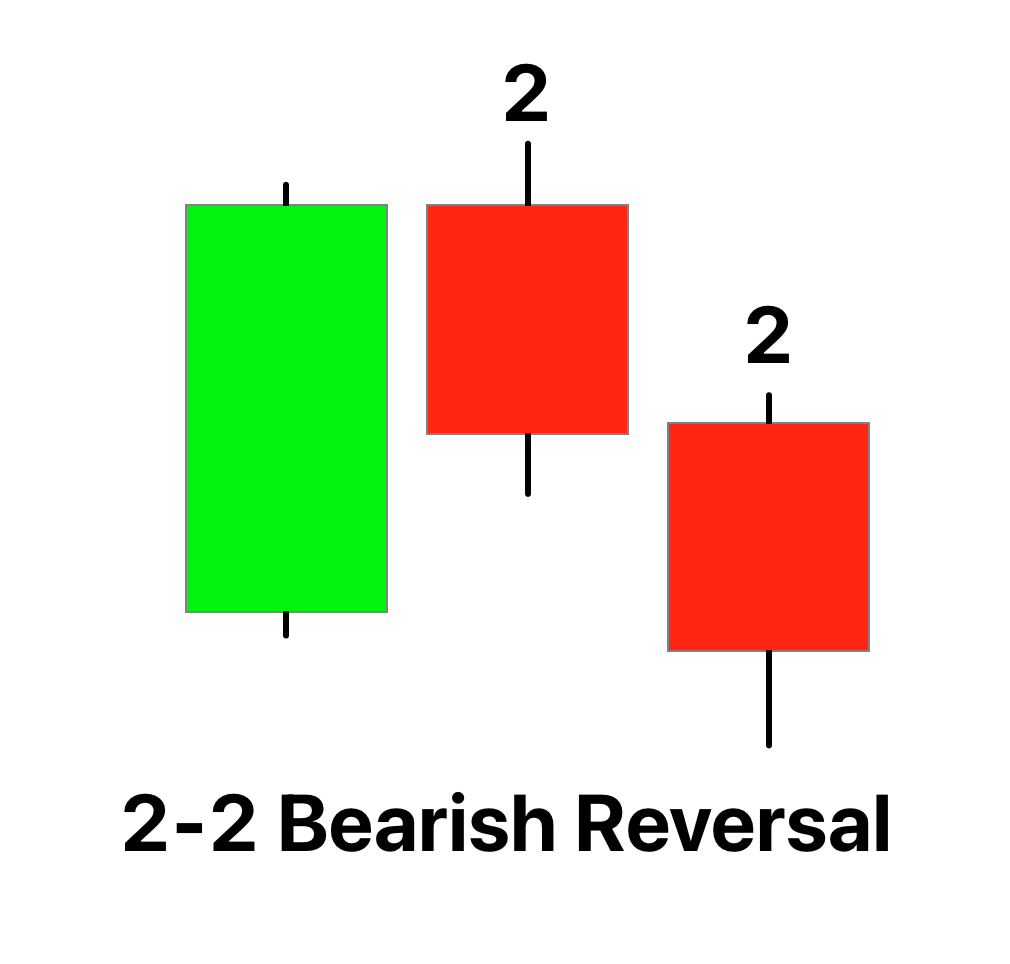 |
| 2-2 bullish reversal | Bullish | 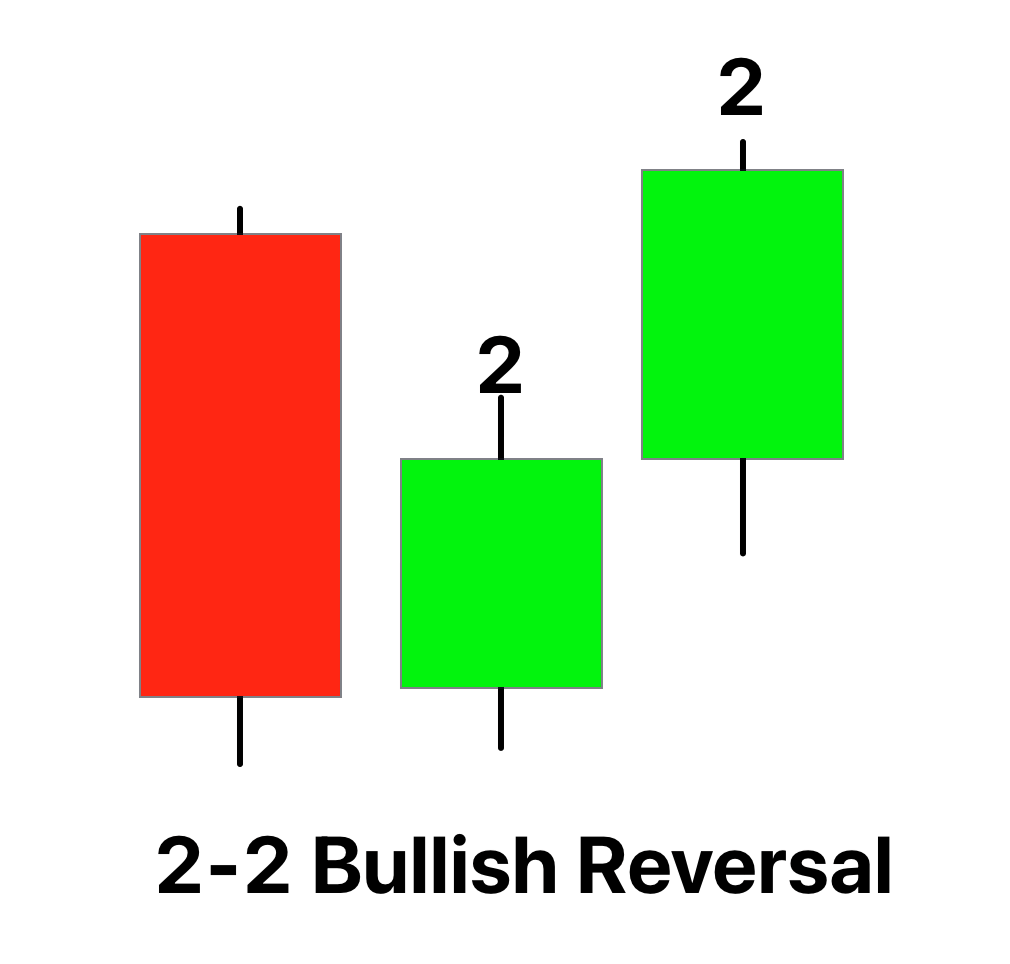 |
| 1-2-2 bearish reversal | Bearish | 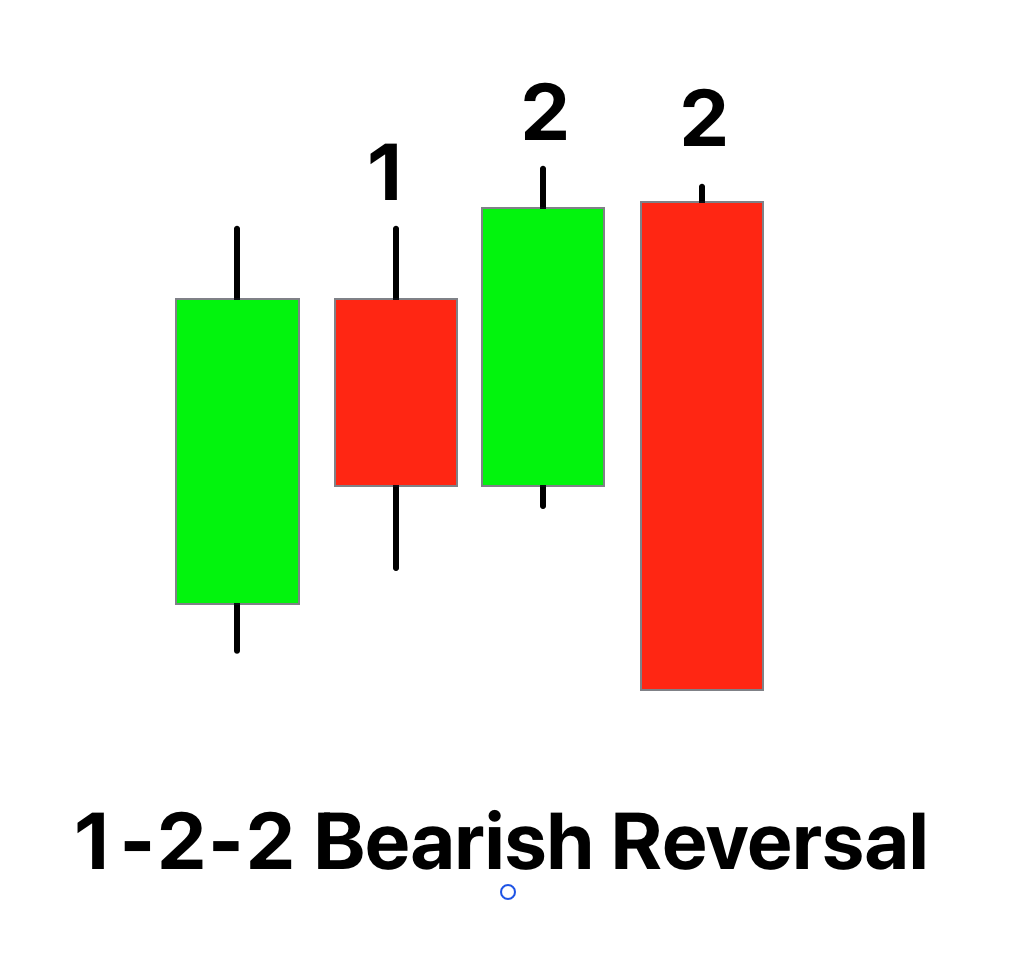 |
| 1-2-2 bullish reversal | Bullish | 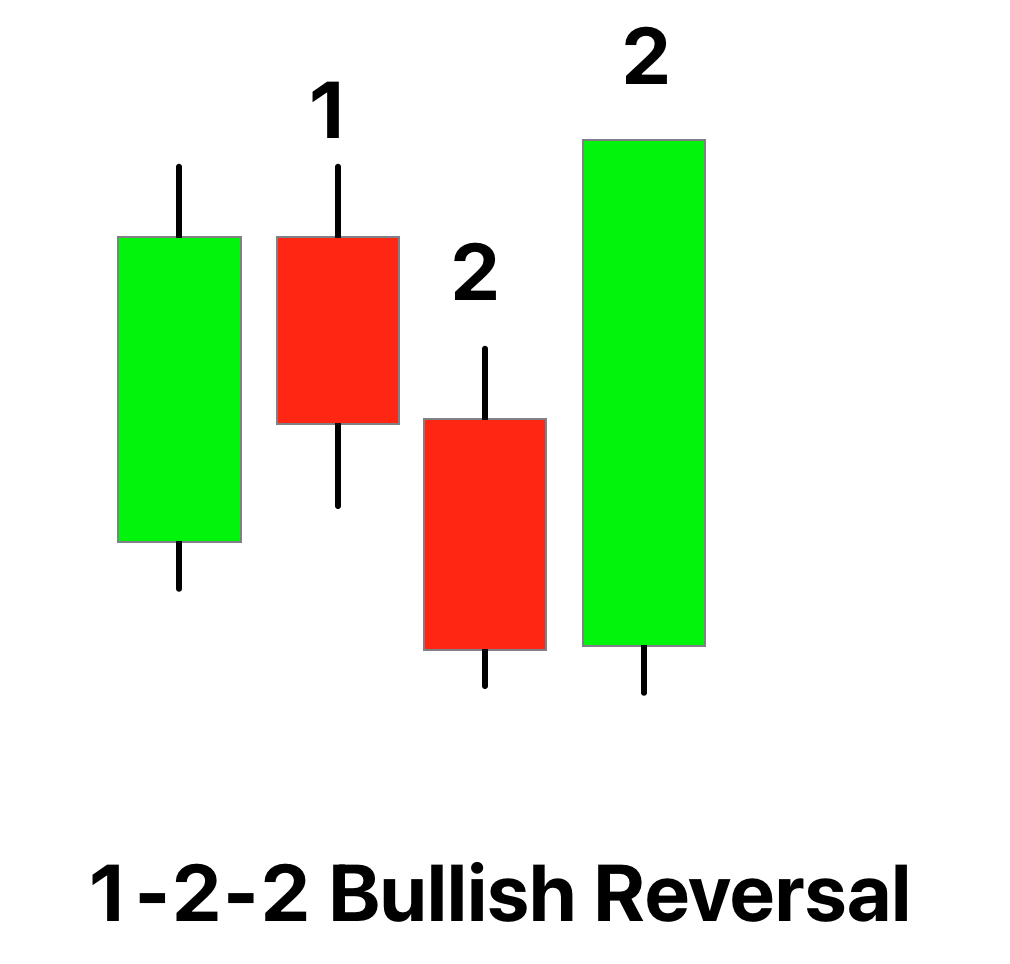 |
| 3-2-2 bullish reversal | Bullish | 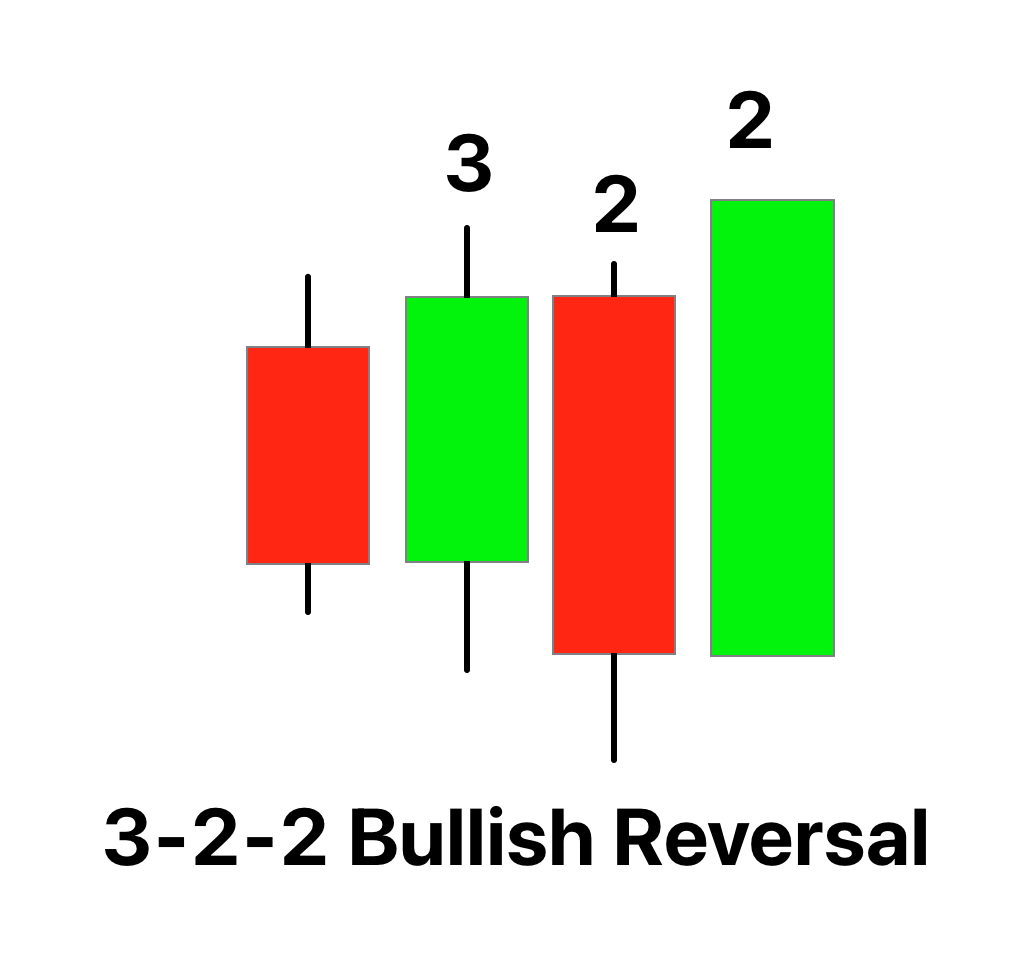 |
| 3-2-2 bearish reversal | Bearish | 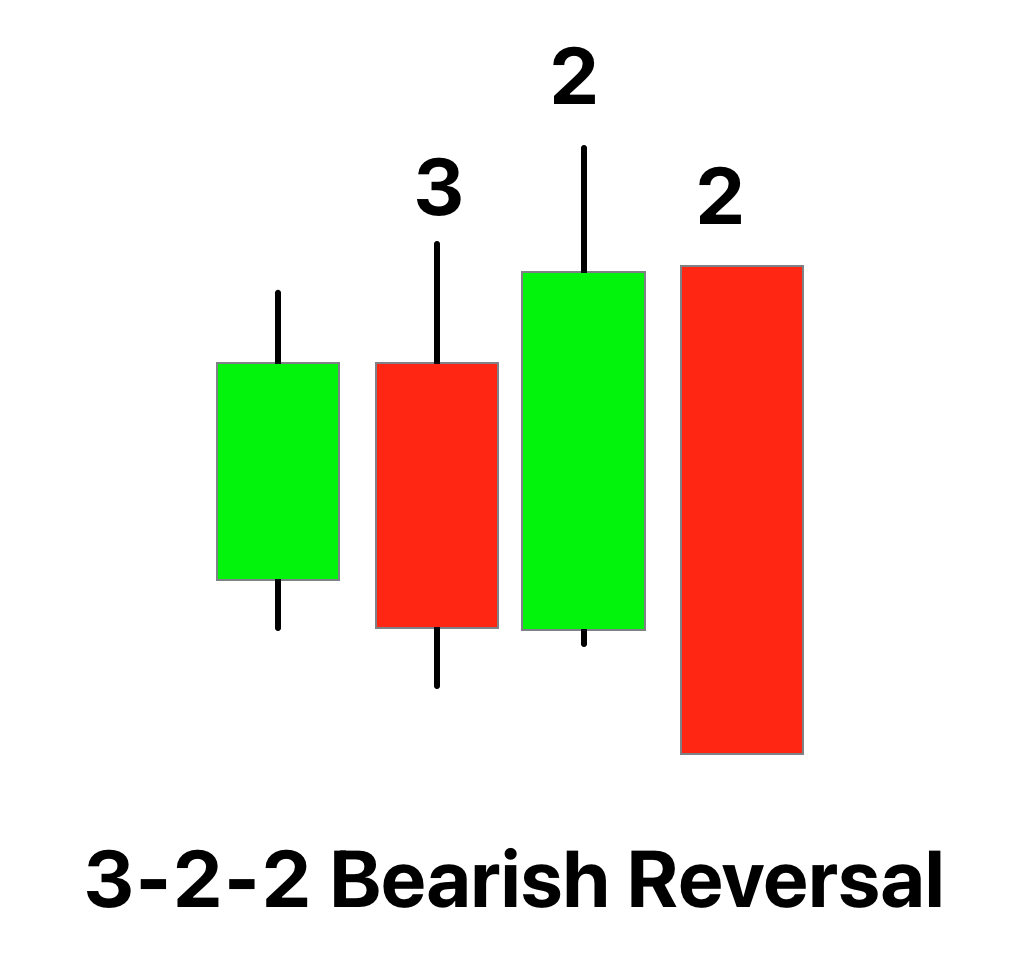 |
| 3-1-2 bearish reversal | Bearish | 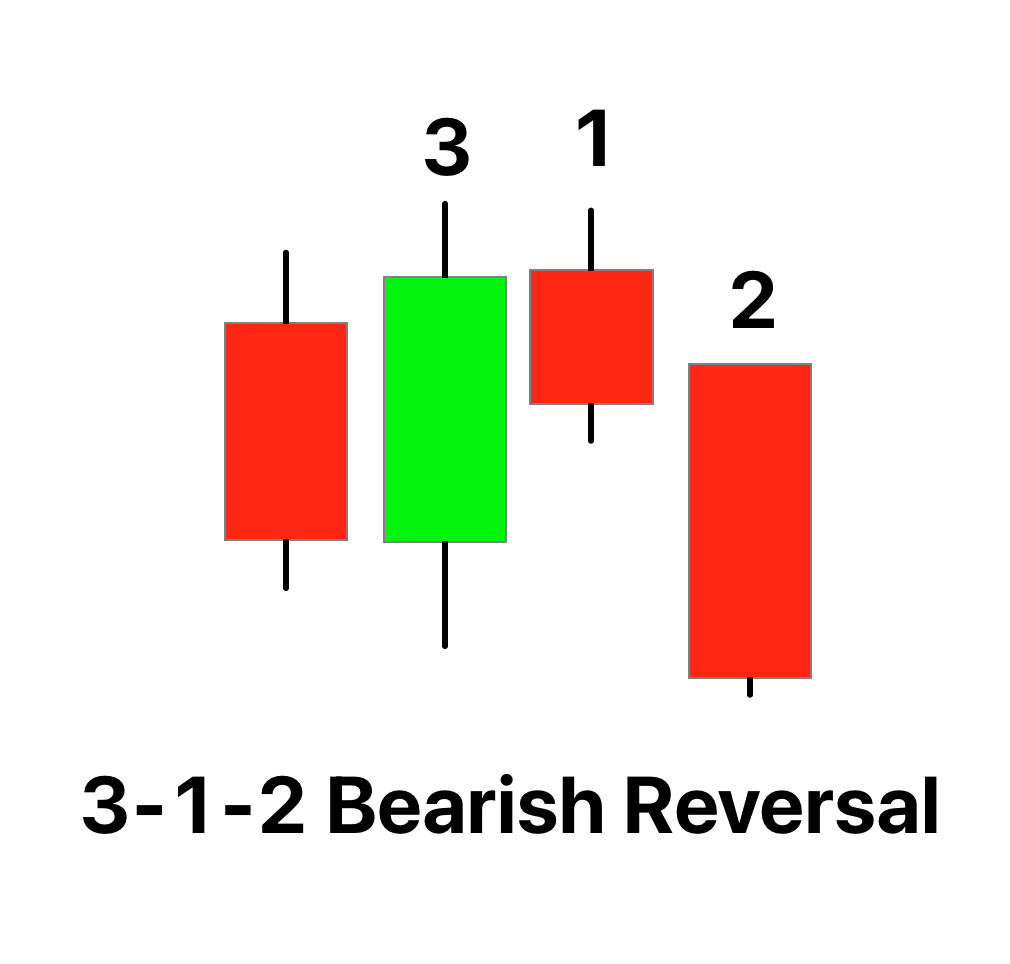 |
| 3-1-2 bullish reversal | Bullish | 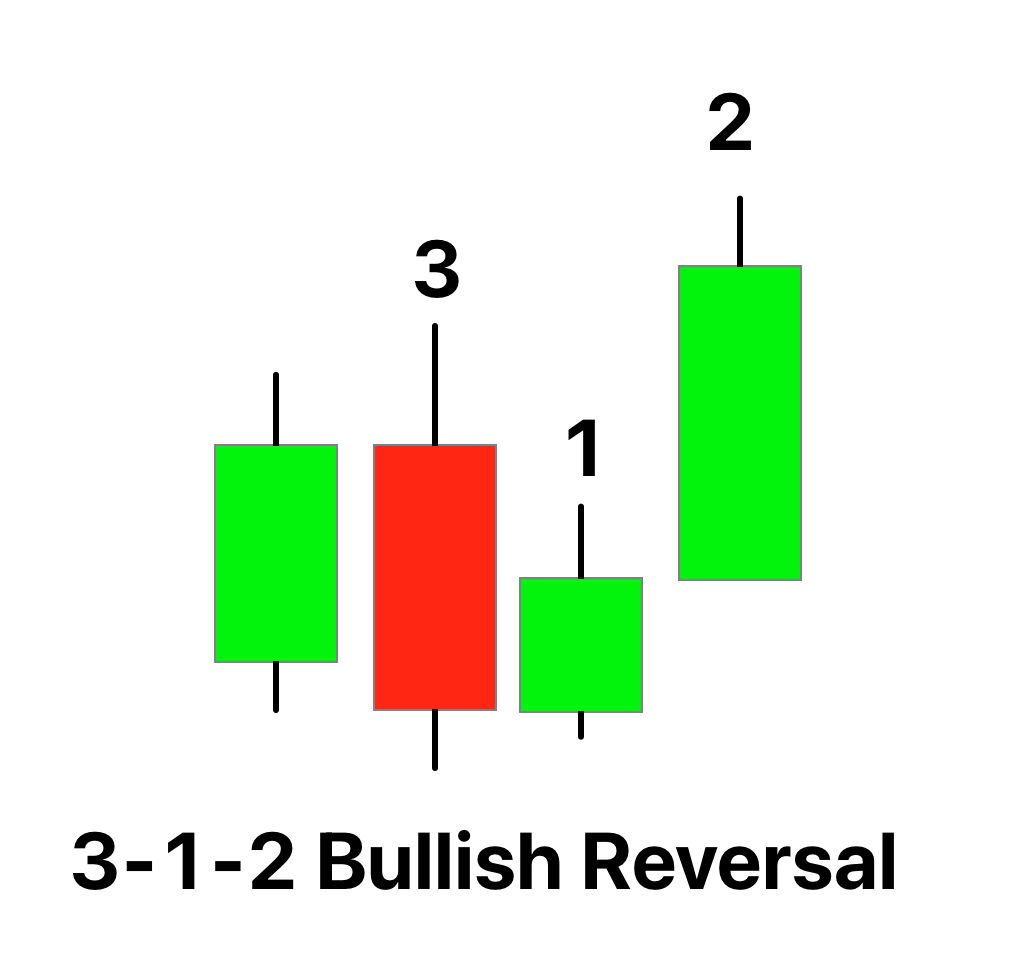 |
| 2-1-2 bearish reversal | Bearish | 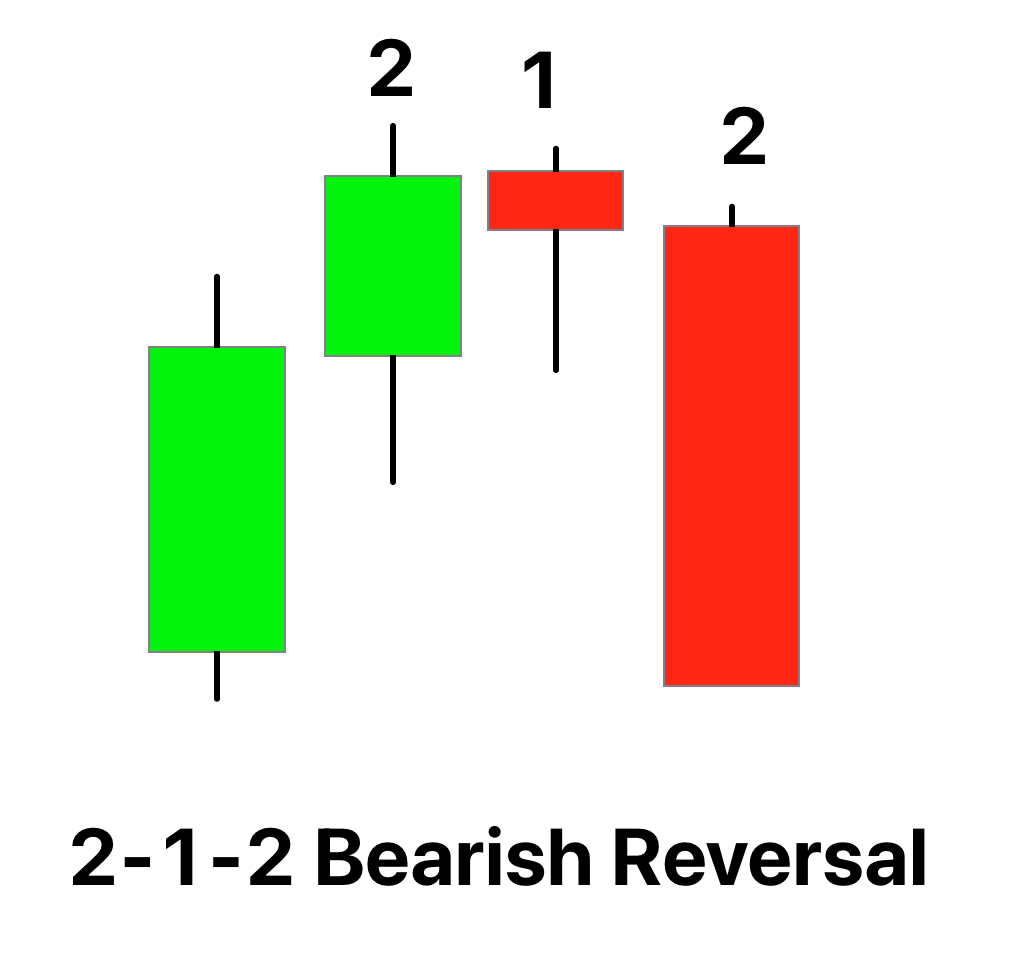 |
| 2-1-2 bullish reversal | Bullish | 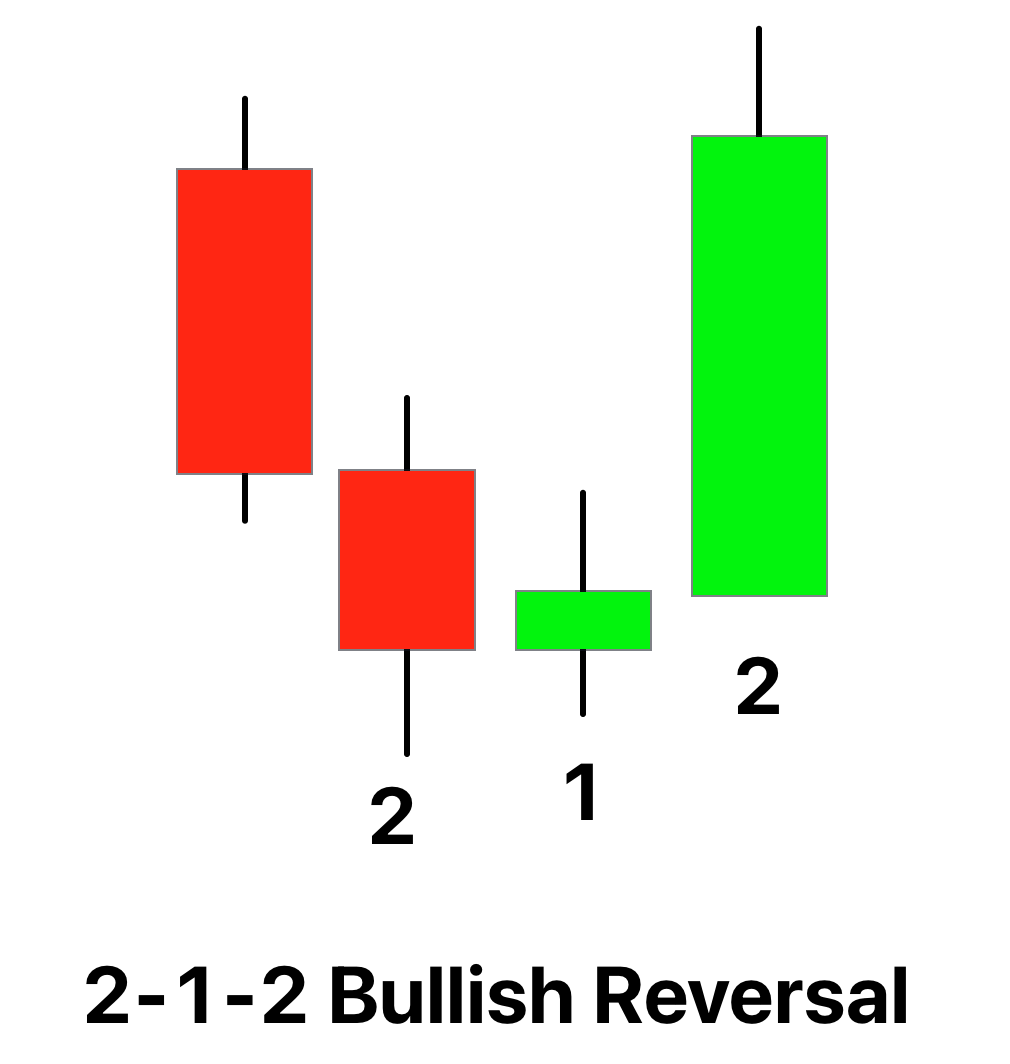 |
| 2-1-2 bearish continuation | Bearish | 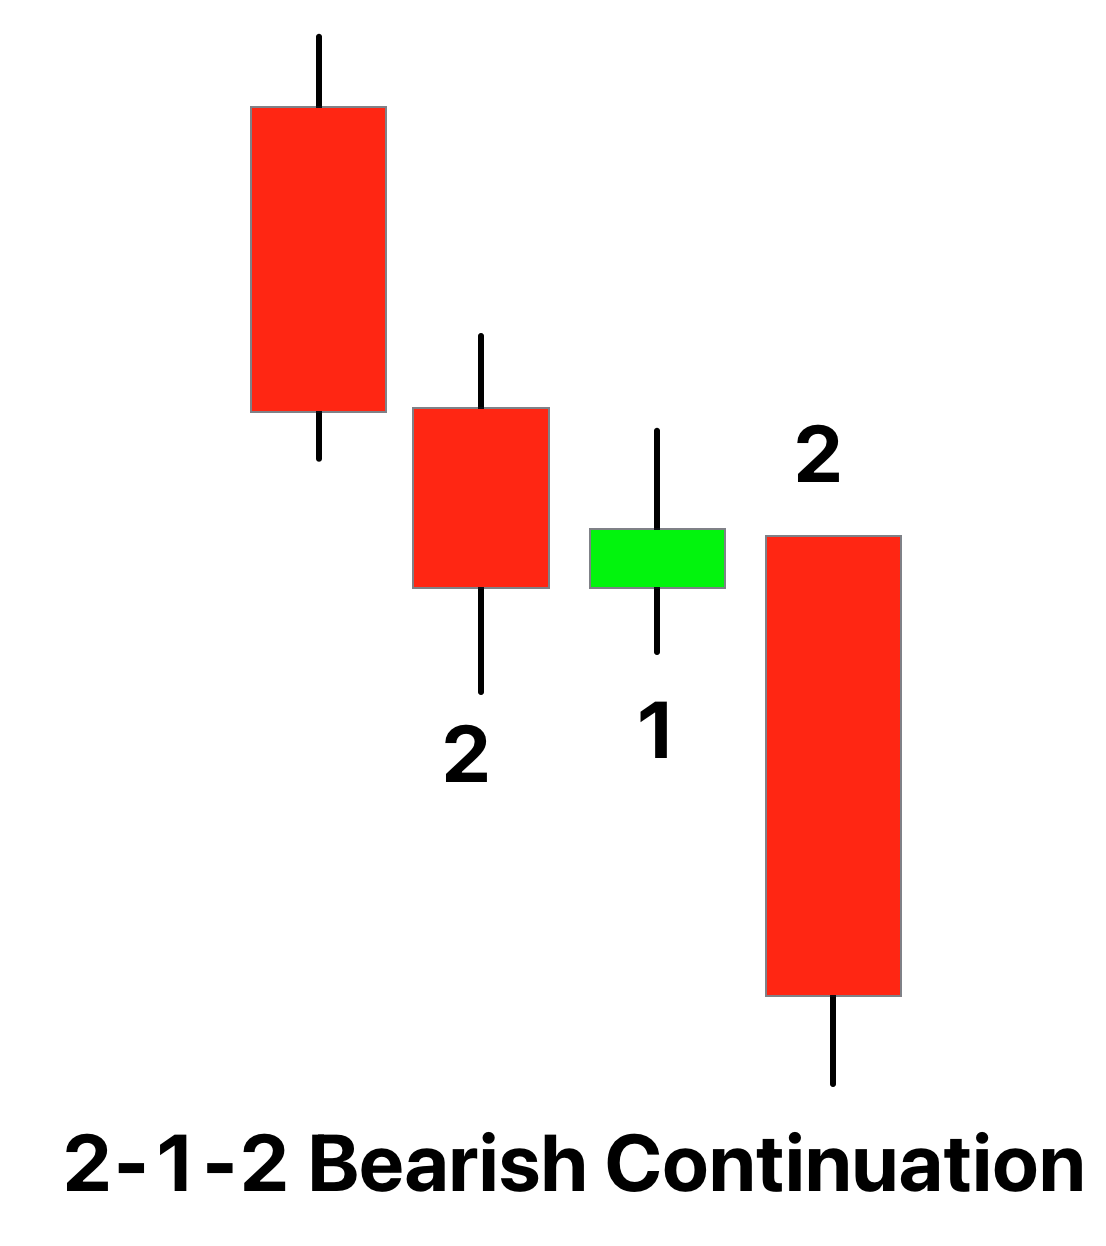 |
| 2-1-2 bullish continuation | Bullish | 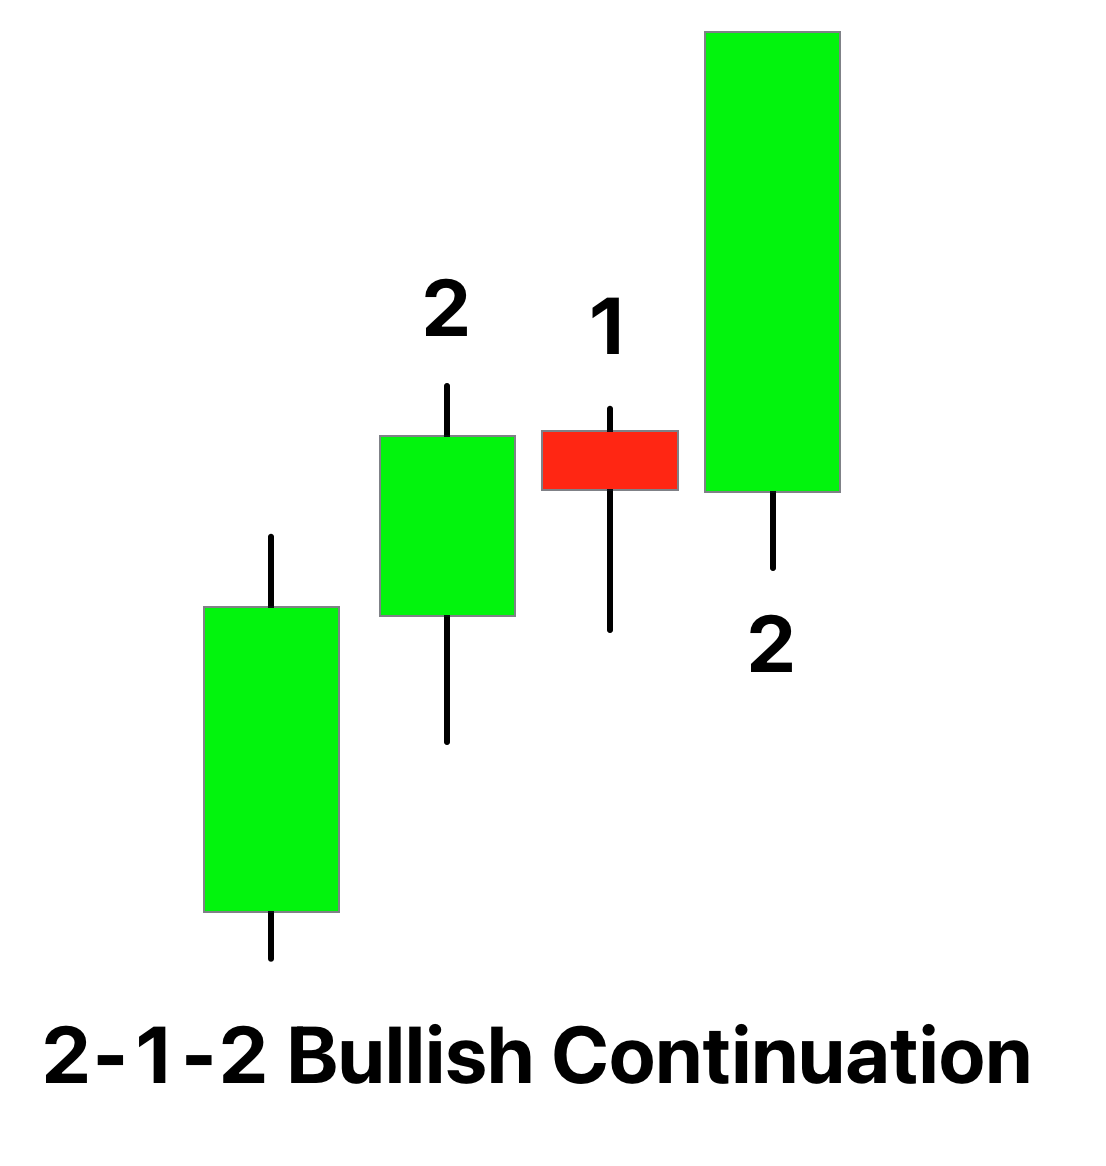 |
Actionable patterns
These patterns give the entry and stop loss levels. So we can open a trade, add stop loss, and take profit level. These patterns are used in the trading strategy.
Actionable patterns are the following:
| The Strat Patterns | Forecast | Image |
|---|---|---|
| 2-1-1 bullish continuation | Bullish | 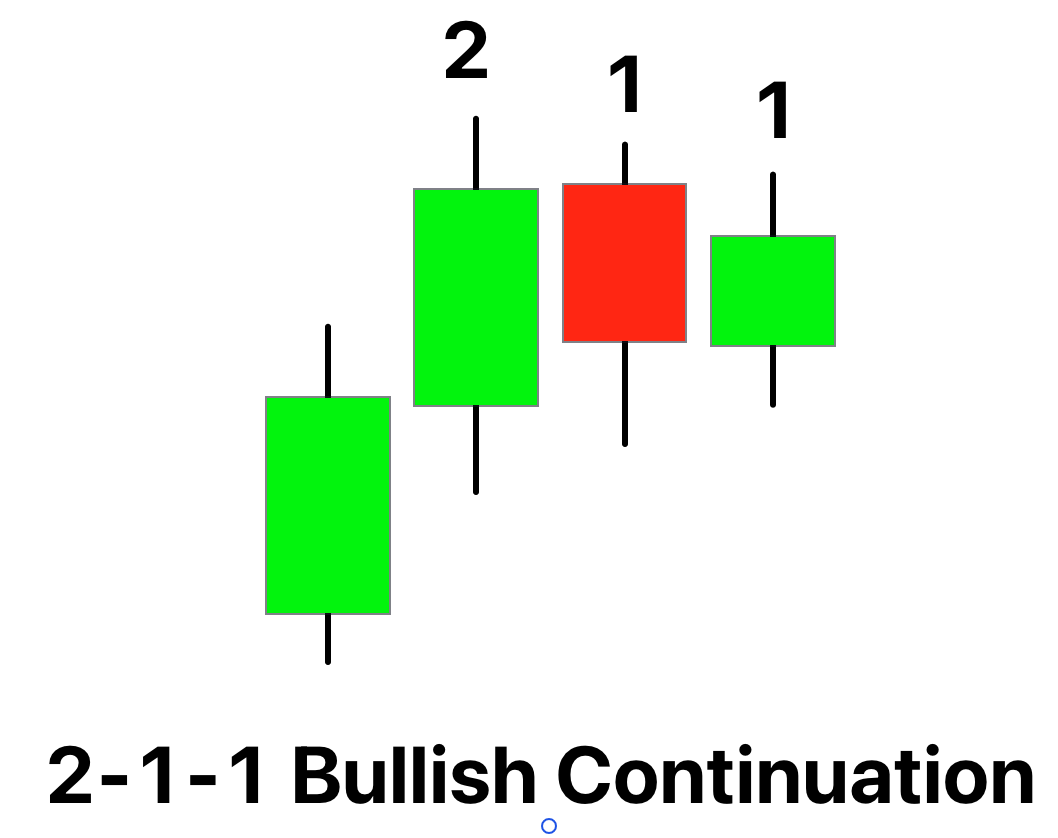 |
| 2-1-1 bearish continuation | Bearish | 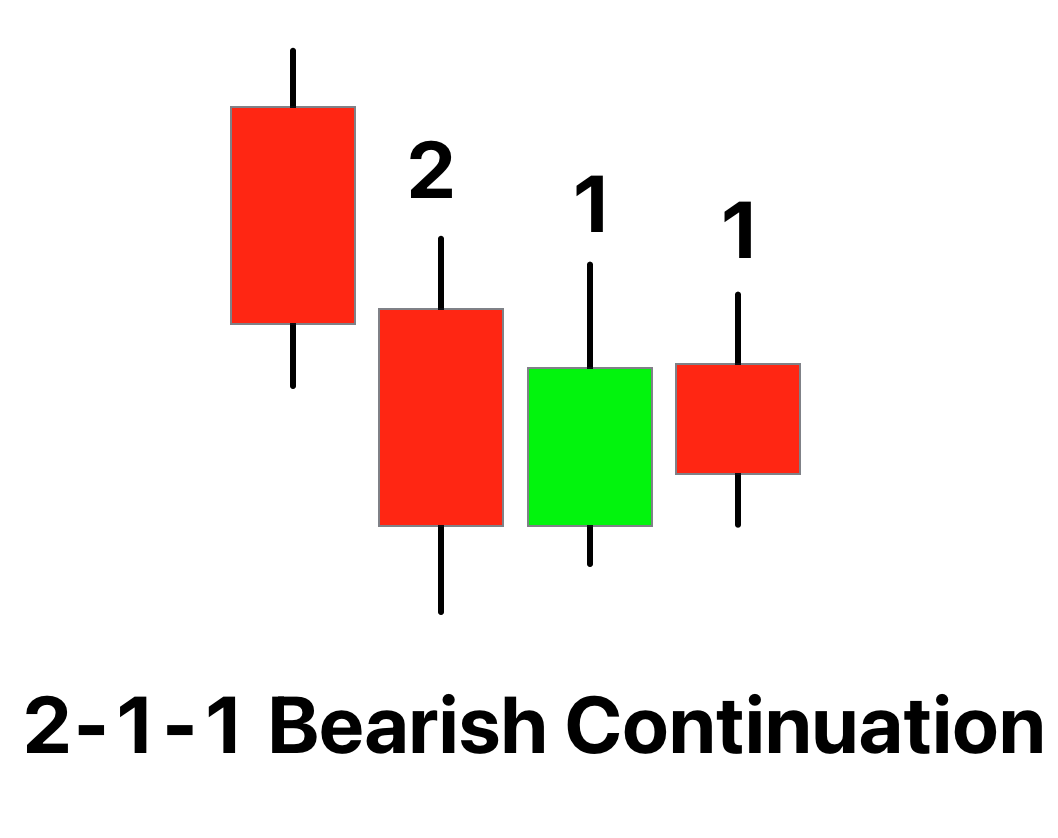 |
| 2-1-1 bullish reversal | Bullish | 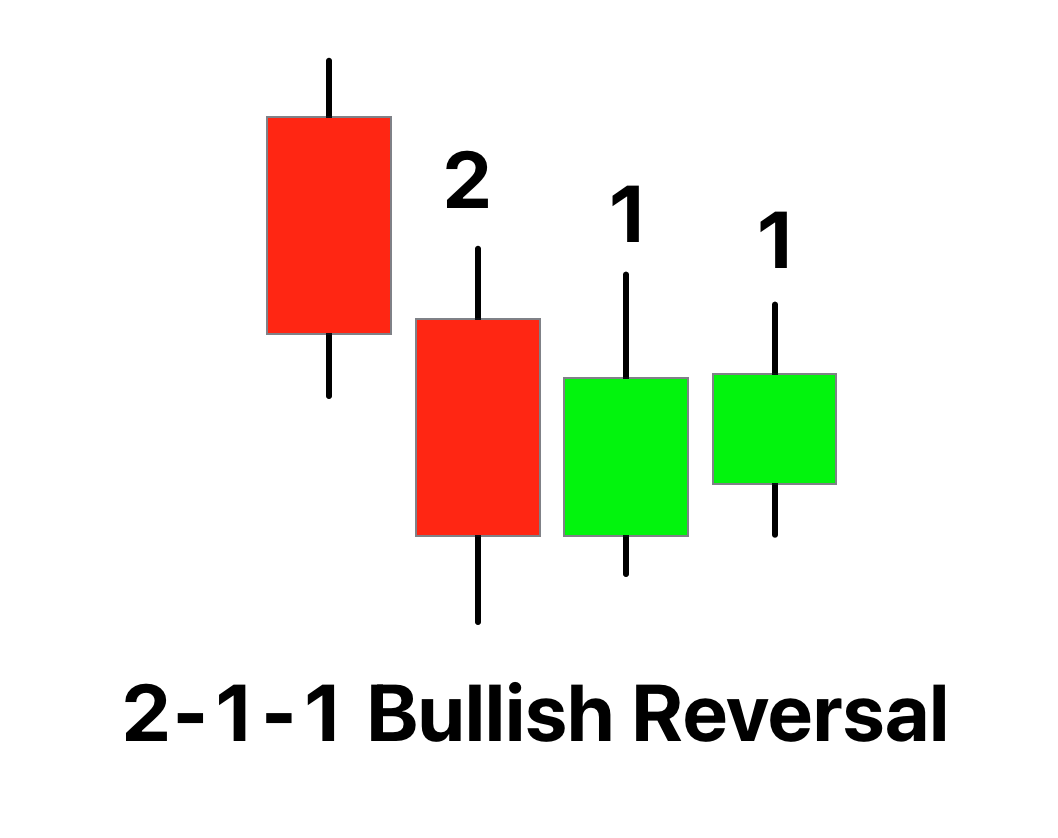 |
| 2-1-1 bearish reversal | Bearish | 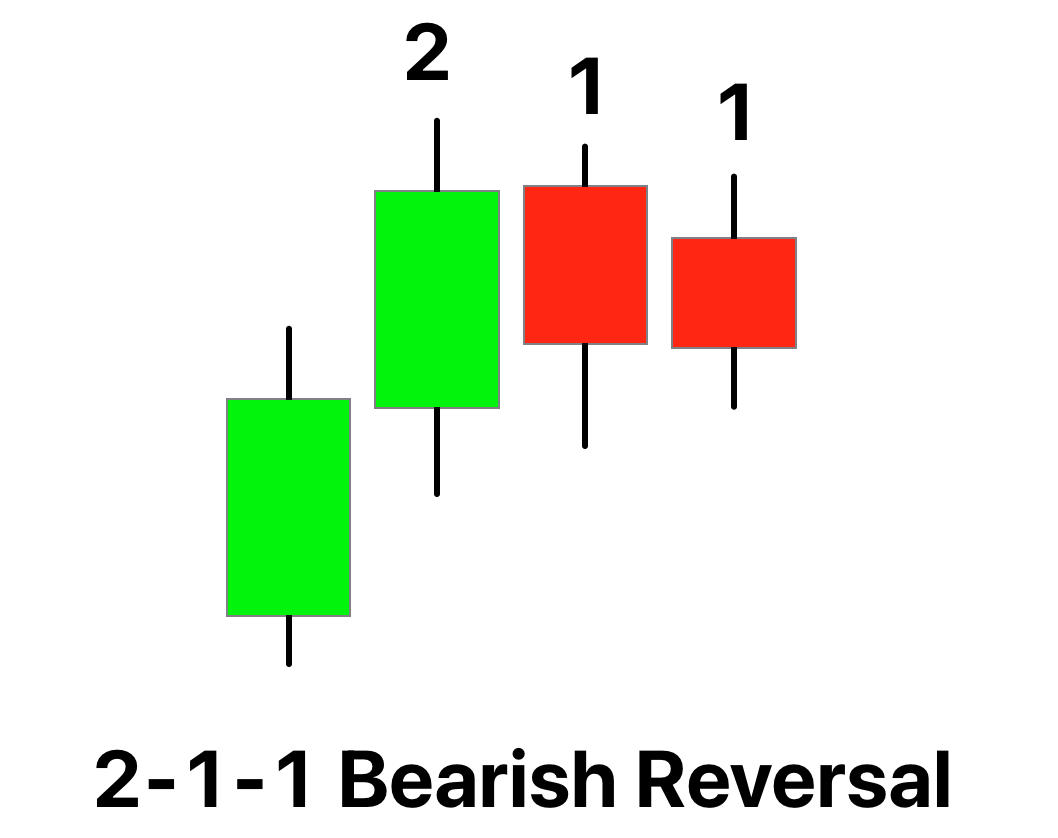 |
| 3-1-1 bullish reversal | Bullish | 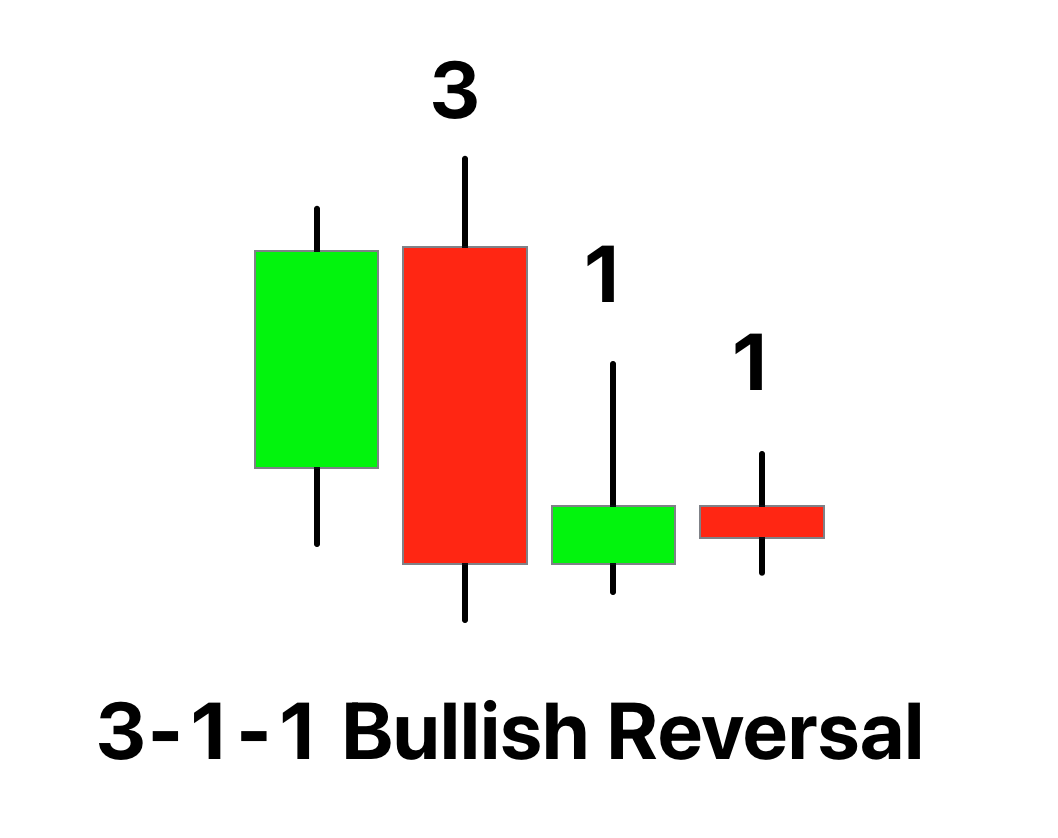 |
| 3-1-1 bearish reversal | Bearish | 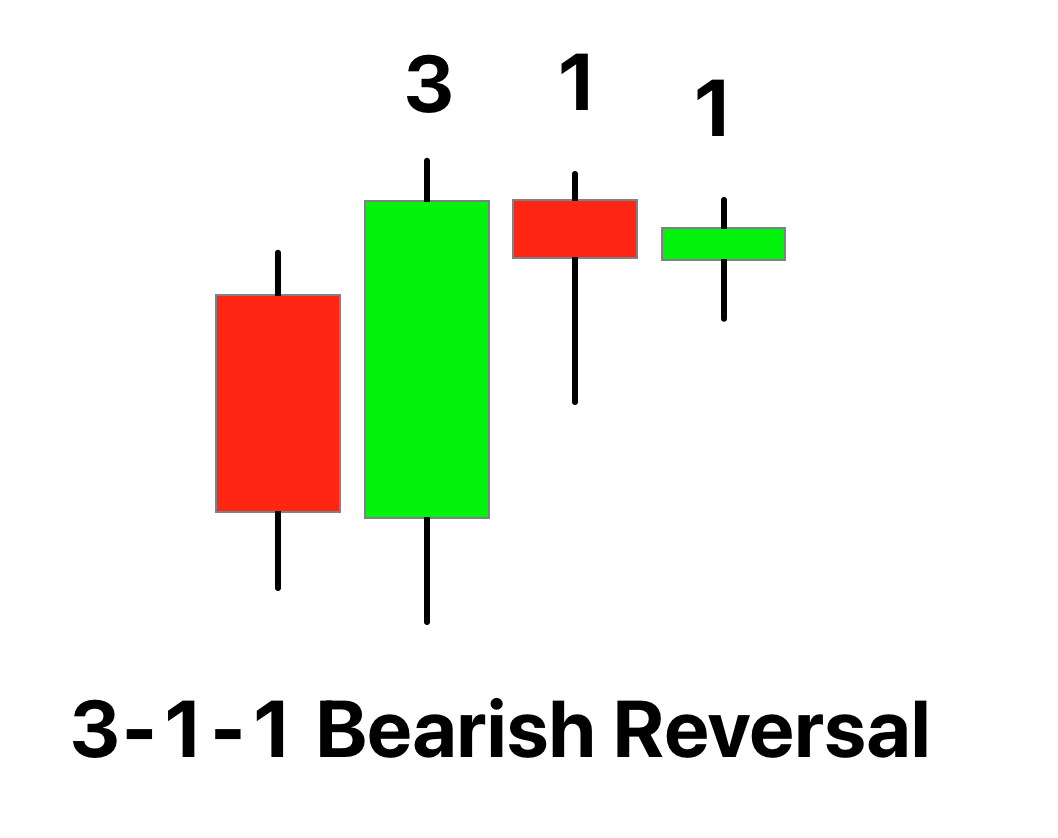 |
| 3-2-1 bullish reversal | Bullish | 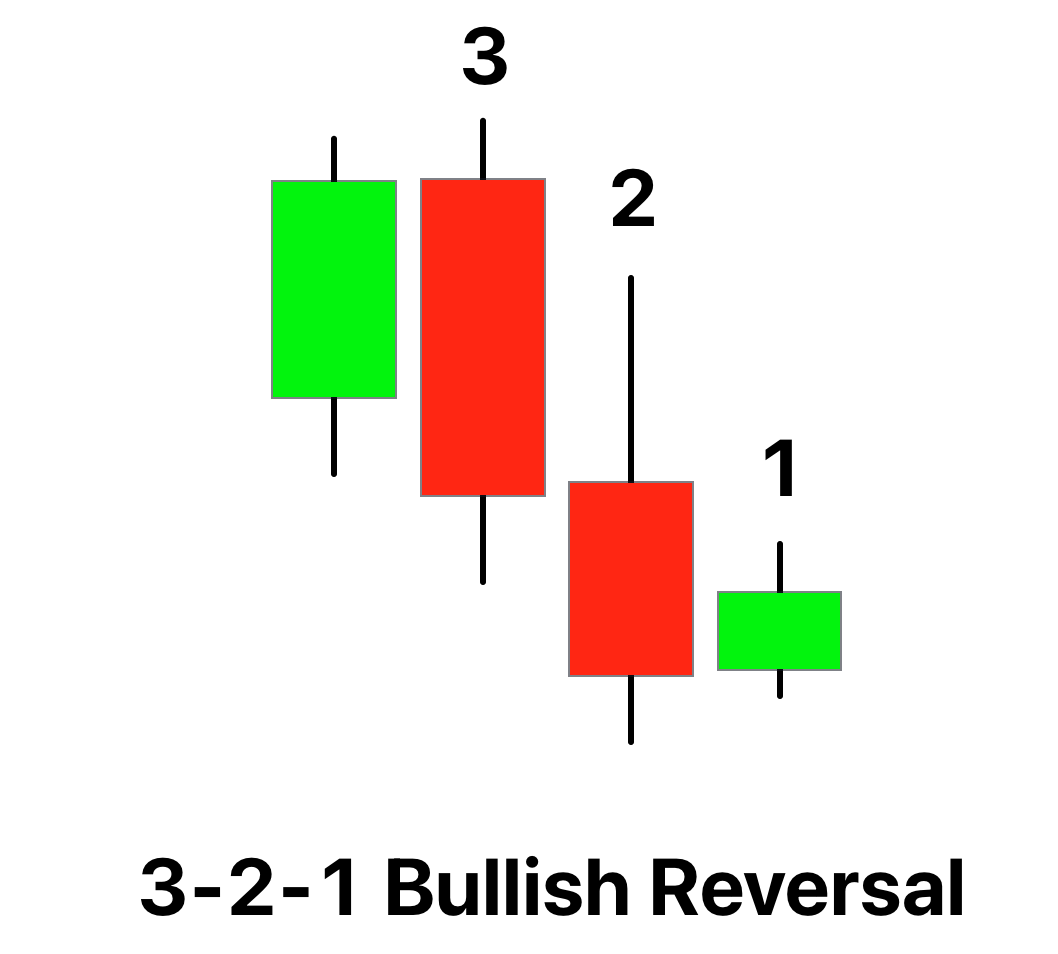 |
| 3-2-1 bearish reversal | Bearish | 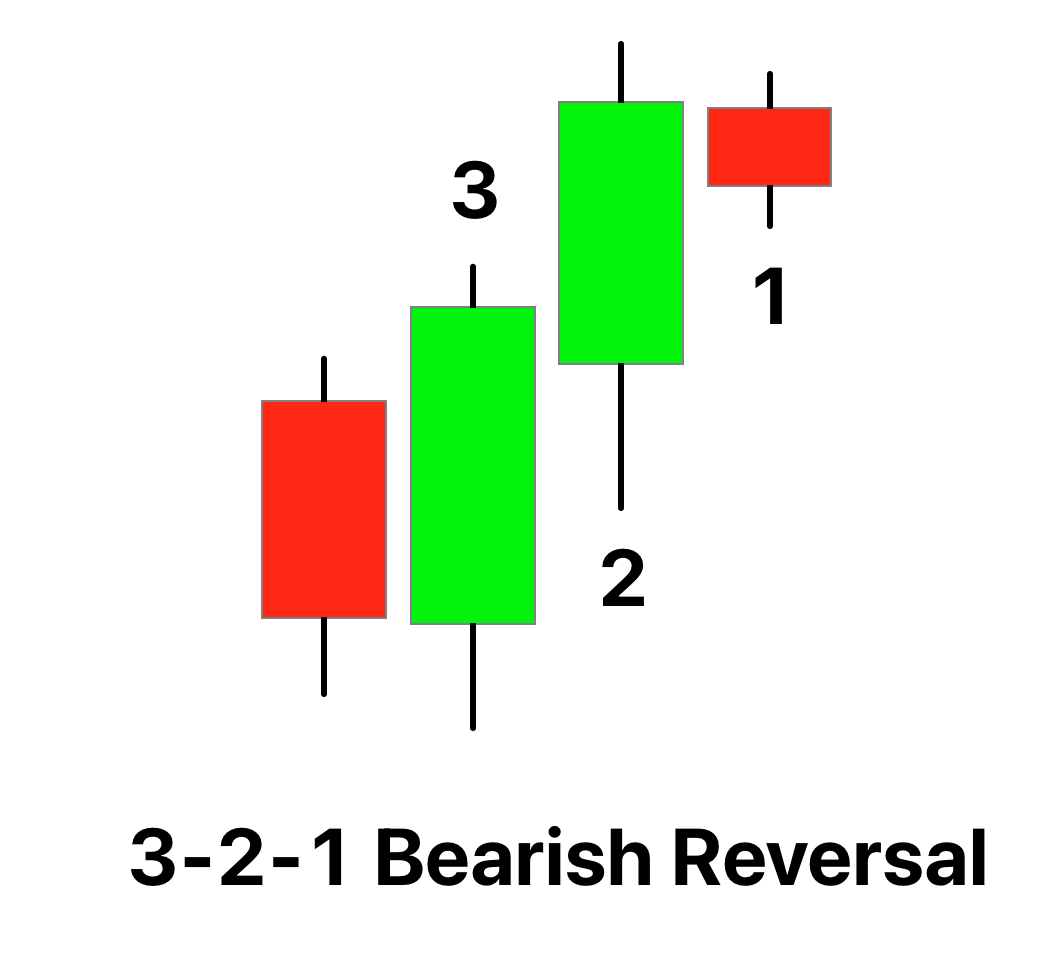 |
| 1-2-1 bullish reversal | Bullish | 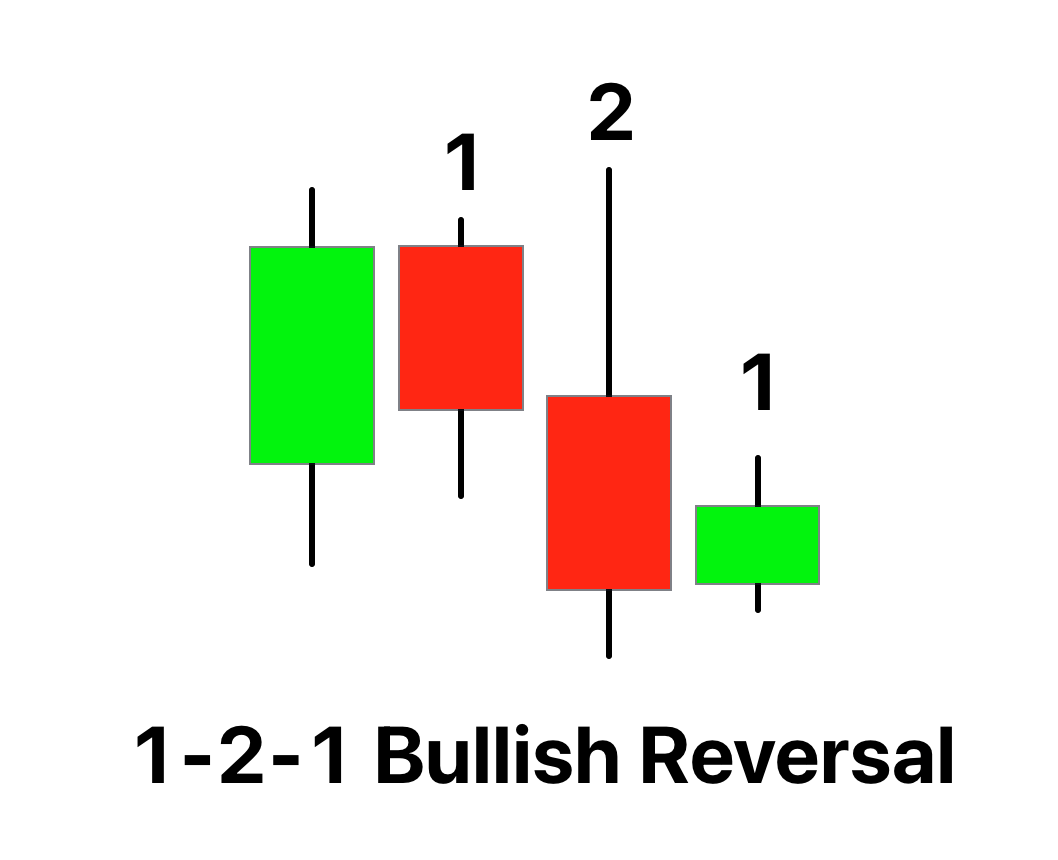 |
| 1-2-1 bearish reversal | Bearish | 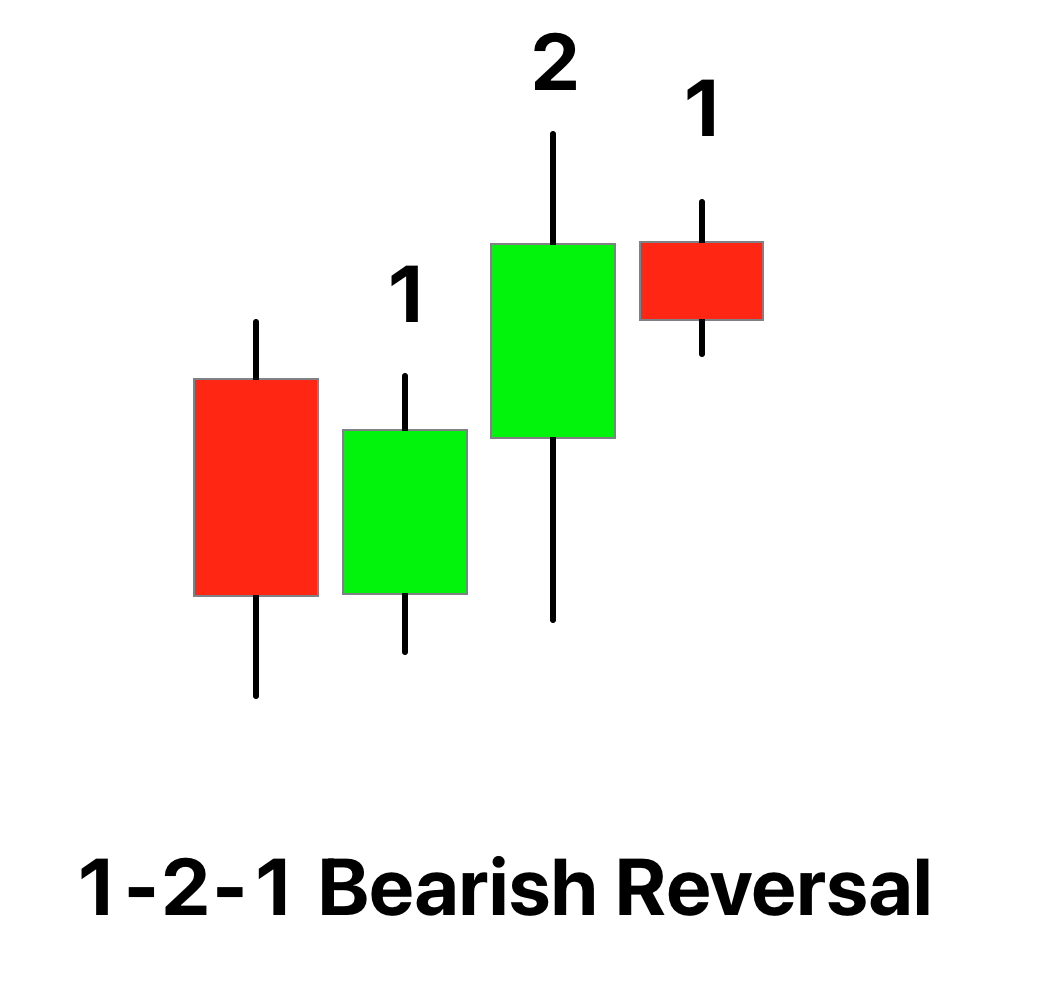 |
After learning the types of strat patterns, we will now move forward to understand the multiple timeframe analysis.
Multiple timeframe analysis in the strat patterns
According to Rob Smith, when the analysis of two higher timeframes and one current timeframe aligns, then the probability of winning of trading setup increases.
The Strat utilizes multiple time frames for trading. There are three main time frames:
- Tides (Monthly and Weekly Charts)
- Waves (Daily Charts)
- Ripples (Hourly and Lower Time Frame Charts)
In the multiple timeframe analysis, we will check the formation of the strat patterns in the same direction, either bullish or bearish. When all the patterns align, it is called going with the flow.
Now let’s explain with an example.
- Monthly chart: let’s support 2-2 bullish continuation pattern forms on the monthly chart. It means the trend is bullish, and the price is making higher highs on the monthly chart.
- Weekly chart: on the weekly chart, 2-2 pattern forms. It means the trend is also bullish on the weekly timeframe.
- Daily chart: let’s suppose on the daily chart, 3-1-2 bullish reversal pattern forms.
Now analyzing all three timeframes, you can see that the direction of all the timeframes is aligning. The daily setup also shows a bullish direction, and we will place a long position on the breakout of the inside bar or the #1 candlestick. This will be a very high-probability trade setup.
What is the purpose of the strat patterns?
In technical analysis trading, one trader can become profitable only by following institutional traders or big banks. If a trader goes against the big institutions, he will lose.
The strat patterns help traders follow the big institutions in trading and the natural concepts that always work. It’s the beauty of nature that everything follows a particular pattern, and these patterns will continue to work forever like rob smith used the pattern of expansion and contraction.
The multiple timeframe analysis helps to determine the direction of big market traders. At the same time, the strat patterns help find potential trade setups with entry, stop loss, and take profit price levels.
I will highly recommend learning this strategy because it’s simple and valid.
The strat patterns trading strategy
A trading strategy includes the entry price, stop loss, and take profit price. However, the first step of the trading strategy is the alignment of timeframes. When the timeframes align, you will have to trade only those strat patterns that forecast in the direction of higher timeframe trends.
Open a trade: open a buy trade on the break of the inside bar in bullish patterns. While open, sell trade below the low of the inside bar or #2 candlestick.
Take profit: The high or low of the previous candlestick will be used as the take profit level.
The entry, take profit, and stop loss levels depend on many factors, and these parameters are different for each strat pattern. That’s why it isn’t easy to cover the trading strategy of each pattern in detail in this article.
However, the ForexBee team is also working on the strat patterns course, which will benefit forex and stock traders.
The bottom line
A retail forex trader should always learn to trade in the direction of market makers and use natural patterns because they always work.
Besides this, a trader should also follow a proper risk management plan that is also most important. I will suggest trading with a 2% risk per trade.
If you have any questions, please comment below, and I will try my best to answer.
Why is there no 2 – 1 – 3 pattern? Is it rare perhaps, but I found one.