
Definition
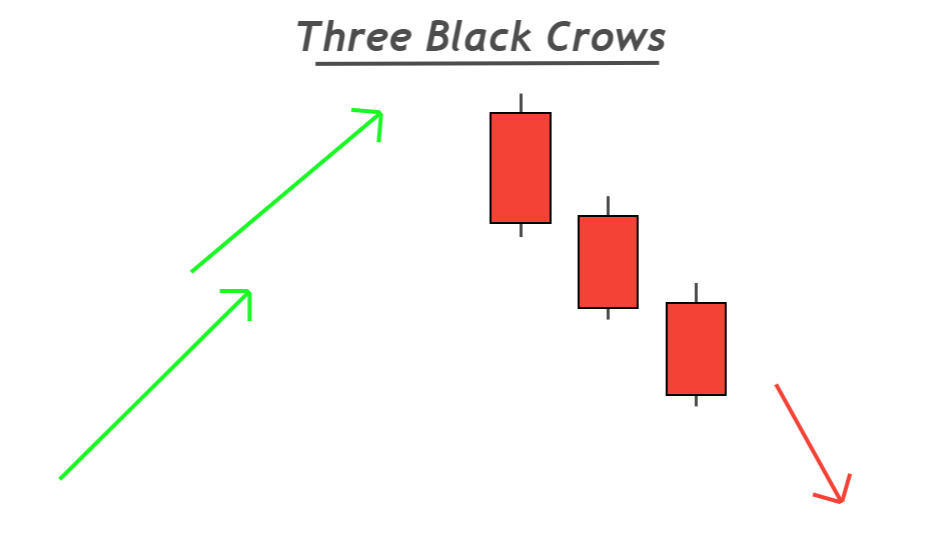
Three black crows is a bearish trend reversal candlestick pattern that consists of three big bearish candlesticks making lower lows and lower highs. These three candlesticks form in a row, and they have small shadows relative to the body size of candles.
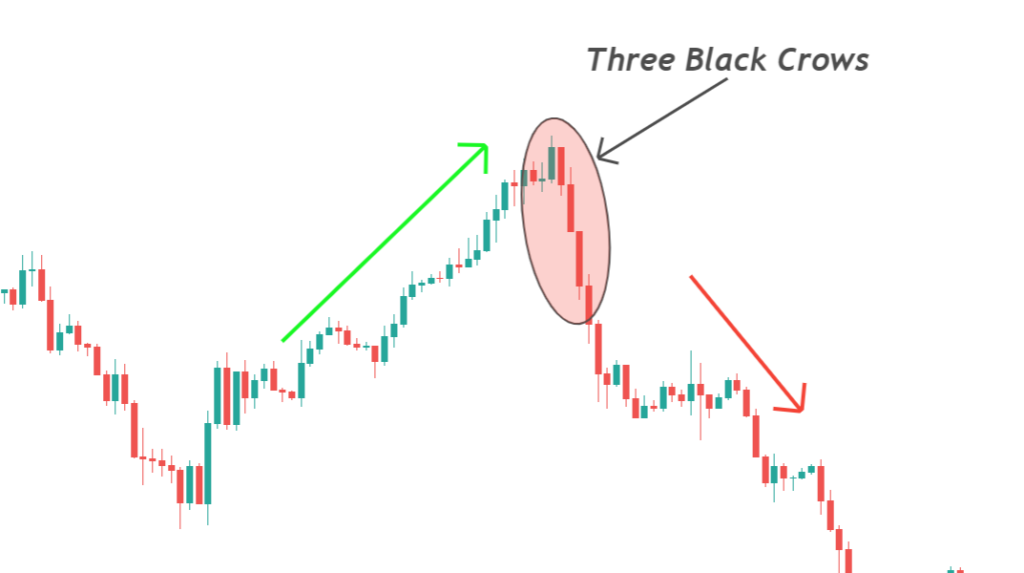
Three black crows candlestick pattern should form at the top of the price uptrend to get a high winning rate. The probability of winning will decrease when this candlestick pattern forms in the sideways or choppy market.
How do you find three black crows patterns?
An ideal candlestick pattern has specific rules to follow. These rules make it easy for a trader to spot a perfect pattern on the price chart.
You’re not going to trade each candlestick pattern in trading, but you will have to trade only refined patterns to get a high winning ratio.
Here’s the guide for three black crows
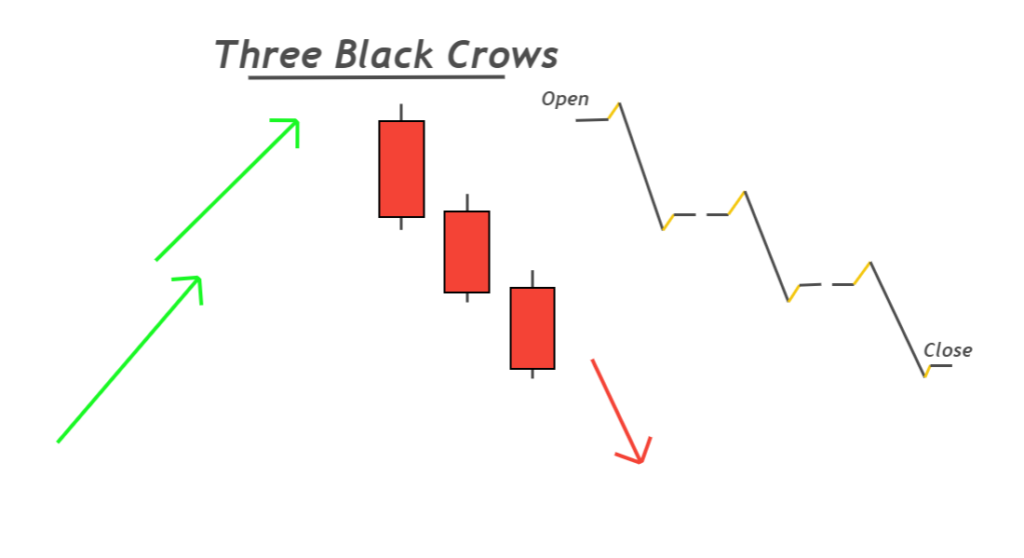
- The body-to-wick percentage of each candlestick should be greater than 60% because the big body shows the momentum of sellers.
- The last two bearish candlesticks should form lower lows and lower highs. It represents the beginning of a bearish trend.
- The shadows or wicks of these three candlesticks should be small. Large shadows are an indication of indecision of the market. That’s why do not trade a pattern with large shadows above or below the candlestick.
Pro tip: In technical analysis, we try to predict the market by using the footprint of big institutions and traders’ price action strategies.
Best working conditions for three black crows patterns?
I have filtered a few confluences that will increase the rate of winning. By adding confluences, you filter the odds from a trading pattern to get better results. You have to figure out by backtesting what type of confluence you should add.
Here are the three confluences for this candlestick pattern.
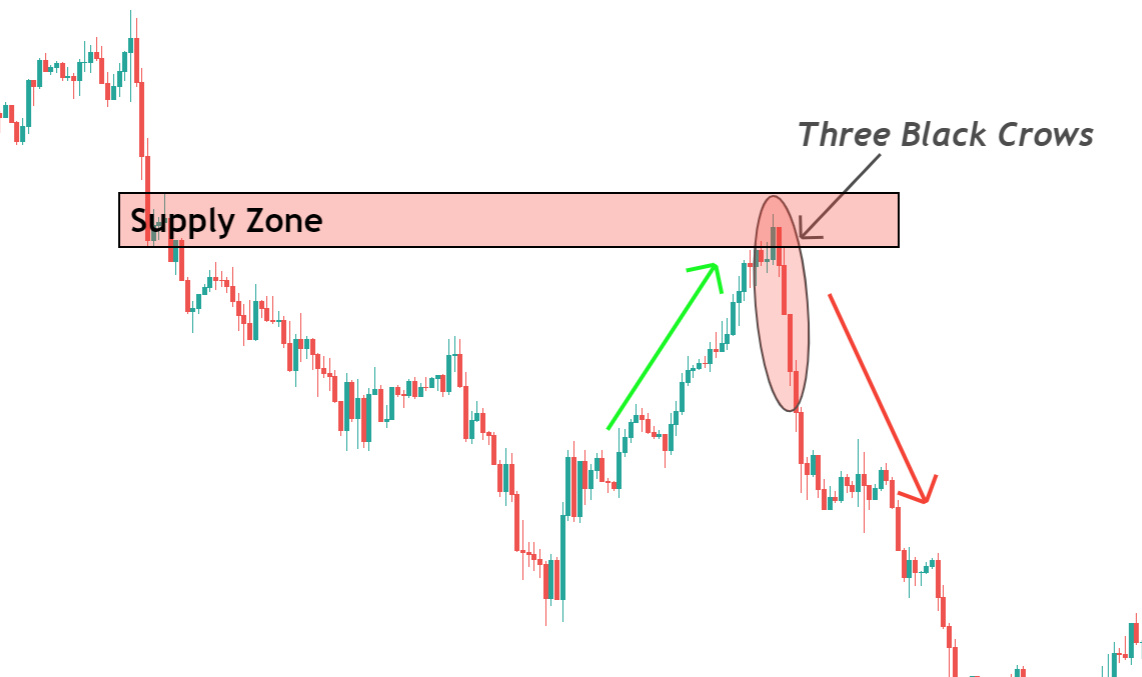
- The prior trend of the market before the formation of three black crows should be bullish. It will not work in a choppy market.
- It should form at the key resistance levels or supply zone.
- Use the RSI indicator to identify overbought conditions and trade this pattern only.
Three black crows: Information Table
| Features | Explanation |
|---|---|
| Number of Candlesticks | 3 |
| Prediction | Bearish trend reversal |
| Prior Trend | Bullish trend |
| Counter Pattern | Three white soldiers |
What does the three black crows pattern tell traders?
This candlestick pattern is a confirmation of bearish trend reversal in the market.
Let’s read the price…
During the uptrend, price value will increase. A series of higher highs and higher lows in the price swings will form in technical analysis.
Price always moves in the form of wave cycles. Higher highs and higher lows in an indication of an uptrend. It means buyers are stronger than sellers in the market.
On the other hand, a series of lower lows and lower highs indicates a bearish trend.
A bearish trend reversal in the price happens when after HHs, LLs form. The three black crows pattern also shows a bearish trend reversal on lower timeframes because of three bearish candlesticks in a series.
So a Three black crows candlestick pattern confirms a bearish trend reversal in the price.

Find High Probability Trades with this ADVANCED Candlestick Patterns Course
The Ultimate Candlestick Patterns Course That Will Help You To Trade Better
How to trade three black crows?
According to my experience, a trade entry should not be taken based on this candlestick pattern because of a few limitations
- Low-risk reward ratio
- It does not project a take profit level
Sometimes, the body of three bearish candlesticks brings down the market to a large extent, making it difficult to open a sell position in an already oversold asset.
So how can we use this candlestick pattern in trading?
There is an excellent solution to use this pattern in trading to get high rewards. That’s the higher timeframe analysis.
Three black crows trading strategy
This strategy analyzes a currency pair or an asset on a higher timeframe like H4, Daily, or weekly. Then find out this candlestick pattern on these timeframes using the conditions discussed above and trade in the direction of three black crows on the lower Timeframe.
For example, John got a signal of three black crows candlestick on a daily Timeframe. This signal has generated an idea of a bearish market trend on a higher Timeframe. He will now switch to the lower Timeframe like 15M or 30M. Then he will apply a trading strategy and open sell trades only because the trend is bearish on a higher Timeframe.

Now this trading strategy has a higher winning rate with a large risk-reward ratio, and he’s happy.
The Bottom Line
This higher timeframe strategy will increase the number of winning trades. All candlestick patterns are not always used for trade entry purposes. It would help if you uniquely used these patterns to make a profitable strategy.
Before trading on a live account, make sure to backtest three black crows candlestick patterns.