Definition
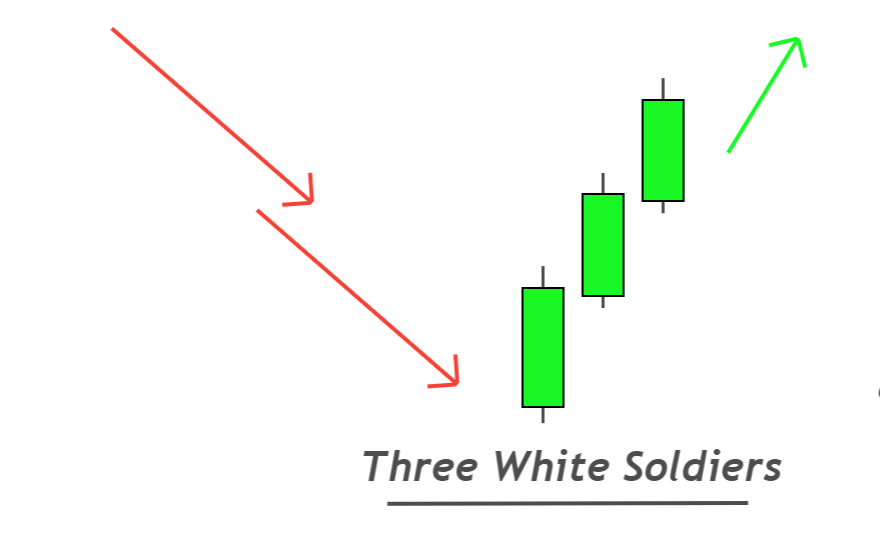
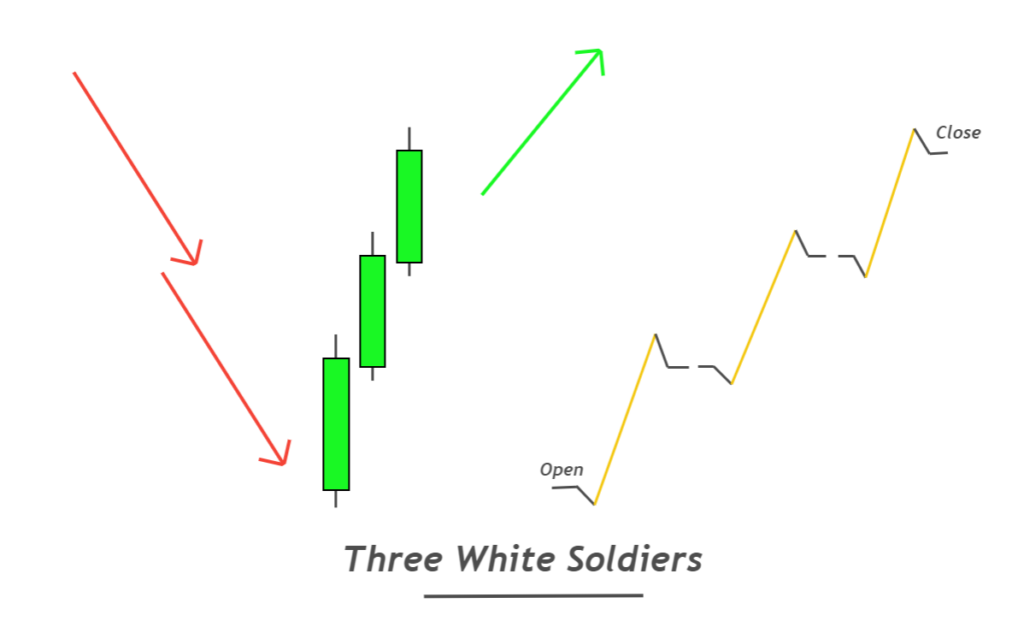
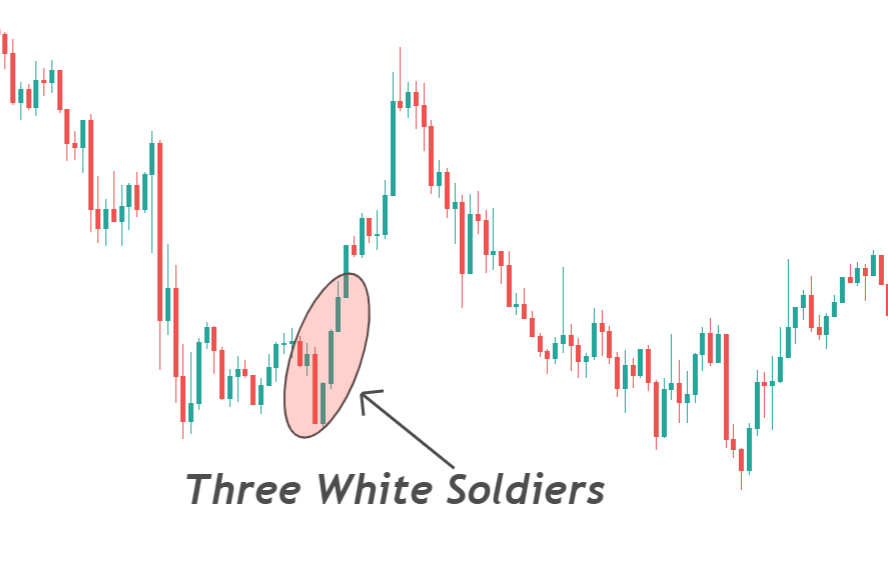
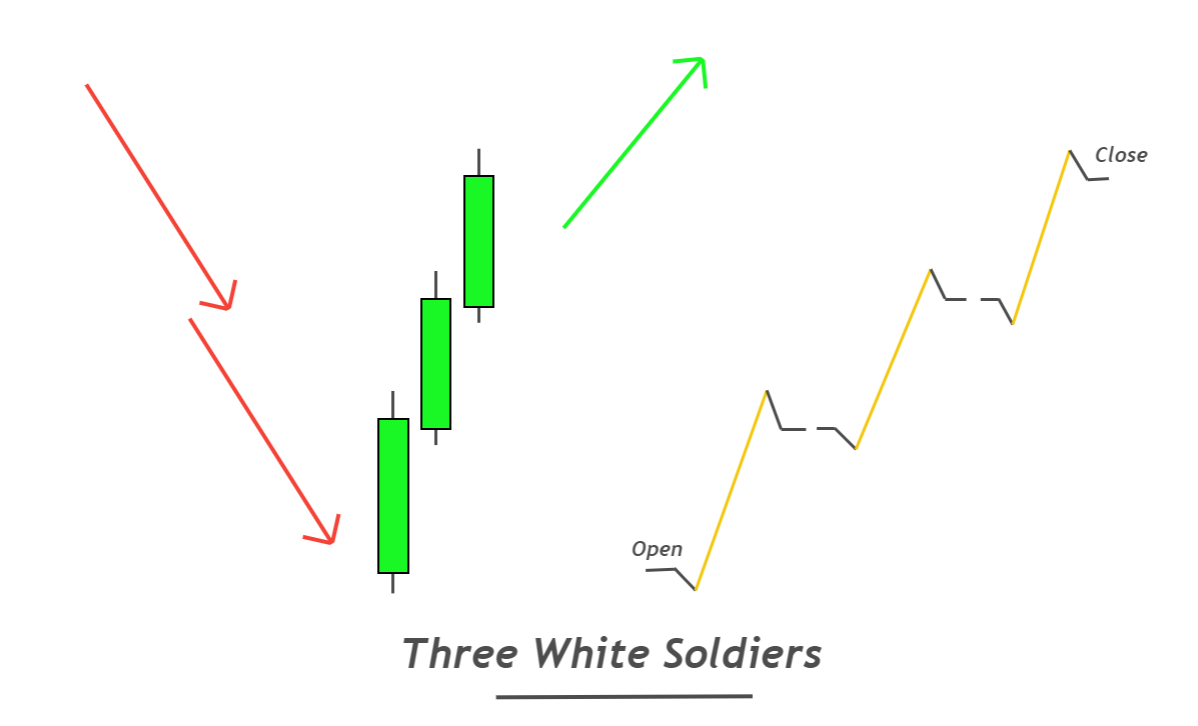
Three white soldiers is a bullish trend reversal candlestick pattern that consists of three bullish candlesticks making higher highs and high lows. These candlesticks form in series with small wicks and shadows representing a massive momentum of sellers.
It is the best candlestick pattern used in higher timeframe analysis to detect price trend reversals on lower timeframes. The three black crows candlestick pattern is opposite to the three white soldiers’ pattern.

How to identify three white soldiers’ candlesticks?
You need to follow a few guidelines to find a good candlestick pattern on the price chart. Following the rules is compulsory to avoid false candlestick patterns on the price chart.
Follow the following rules
- Three bullish candlesticks should form in series on the price chart, making higher highs and higher lows. This step confirms the bullish price trend.
- The body-to-wick percentage of each candlestick should be greater than 60%. These three candlesticks should have small wicks/shadows representing the market’s massive momentum of buyers.
- It should form at the bottom of a downtrend because it is a bullish trend reversal candlestick pattern.

Pro tip: In an ideal three white soldiers candlestick pattern, each candlestick’s time and body size will be equal.
Three white soldiers: Information Table
| Features | Explanation |
|---|---|
| Number of Candlesticks | 3 |
| Prediction | Bullish trend reversal |
| Prior Trend | Bearish trend |
| Counter Pattern | Three black crows |
What do the three white soldiers’ candlesticks tell traders?
This pattern indicates that a new bullish trend is about to start. There is a complete logic behind the formation of this candlestick pattern.
Let’s read the price…
The body of the candlestick represents the momentum of buyers or sellers. Bullish candlestick having a large body shows that buyers control the market because the price increases.
Buyers and sellers are two major forces of the market. If buyers are more robust than sellers, the price will increase and vice versa.
So, when three big bullish candlesticks form in a row, it conveys a message that buyers have increased the price in three consecutive sessions and sellers have failed to decrease the price three times consecutively.
That’s why when a three-white soldiers candlestick pattern forms at the bottom of the chart, sellers have lost momentum completely, and buyers are ready to create a bullish trend. This is the logic behind this candlestick pattern.


Find High Probability Trades with this ADVANCED Candlestick Patterns Course
The Ultimate Candlestick Patterns Course That Will Help You To Trade Better
Best working conditions for three white soldiers pattern
You will have to add confluences to filter ideal candlestick patterns from the crowd on the price chart. The confluences increase the probability of a price pattern. Because in this technique, you’re not going to trade each candlestick pattern. You will trade only refined patterns that meet specific rules.
Here are three confluences I have added. You can also use your confluences.
- The white soldiers’ candlestick pattern should form at the support or demand zone
- Do not trade this pattern during choppy or sideways market conditions.
- Trade this candlestick pattern in oversold market conditions, i.e., During RSI below 30.
Higher timeframe candlestick trading strategy
Due to certain limitations, it is not recommended to trade this candlestick pattern alone. However, I have made a strategy to trade this pattern effectively.
This strategy is based on a higher timeframe.
Open the higher timeframe like 4H, Daily, or weekly, then look for a three white soldiers candlestick pattern.
After identifying the pattern on the higher timeframe, switch to a lower timeframe like 15M or 30M, then apply your strategy in the bullish direction. You will only open buy trades with high-risk reward ratios.
Any strategy (RSI, Mas, MACD, etc.) can be used, but winning will increase.
The Bottom Line
Three white soldiers’ candlestick patterns do not frequently form because of strict conditions. On a higher timeframe, you will rarely find this pattern. So it is recommended to increase the number of currencies or stocks to get several trade setups in a month.
Make sure to backtest this candlestick pattern at least 75 times to master it.


