
What are Trend Channels?
Trend channels refer to price channels that show the trend of the price in the form of two parallel trendlines in forex trading. Price always moves in the form of channels and these channels continue to change with time.
These channels are used to identify the bullish trend, bearish trend, or sideways market movement. Price always respects these lines. They can also be used to trade with price action strategies.
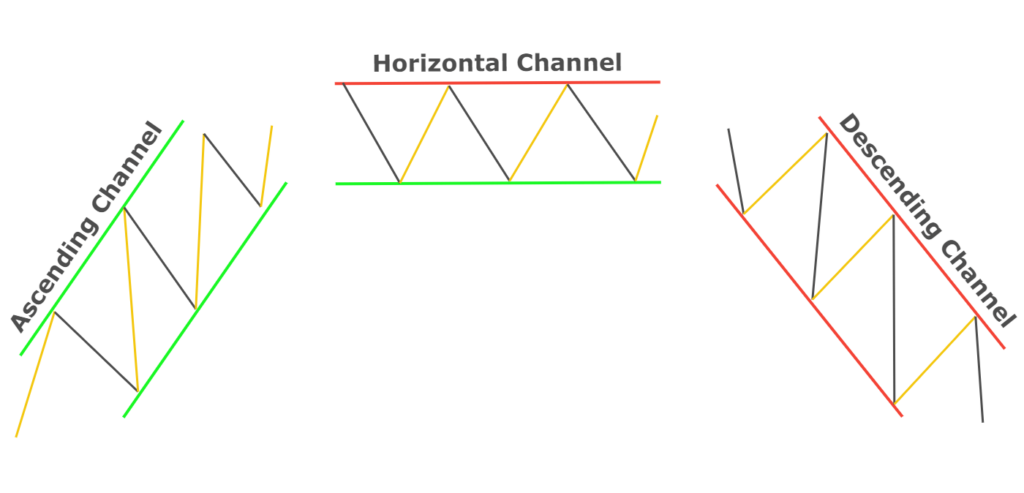
Types of trend channels
There are three major types of price channels on the basis of type of trend
- Ascending channel (Bullish trend)
- Descending channel (Bearish trend)
- Horizontal channel (Sideways or ranging)
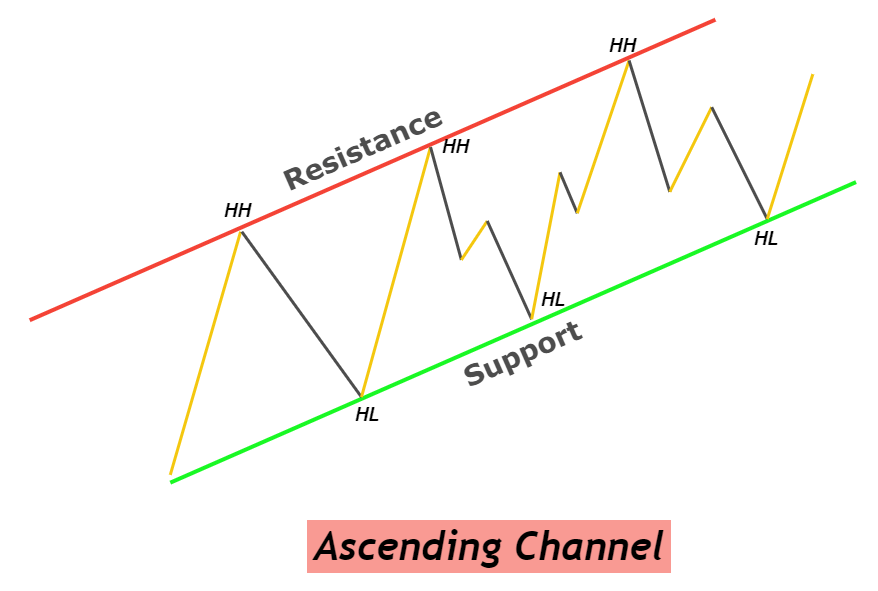
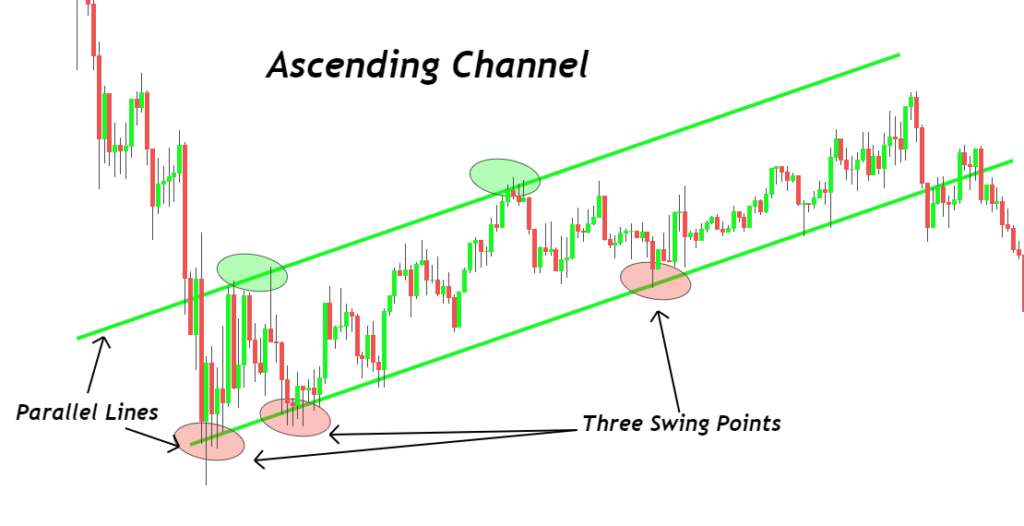
Ascending Channel Pattern
Ascending channel indicates a bullish trend on the price chart. It is formed by two parallel trendlines meeting the highs and lows of price waves (higher highs and higher lows).
If the price is moving in an ascending channel then the price trend will remain bullish until the breakout of the channel. The trendlines of the channel act as inclined support and resistance lines.
The upper channel line will act as a resistance line and the lower channel line will act as a support line. Price will move between support and resistance line.
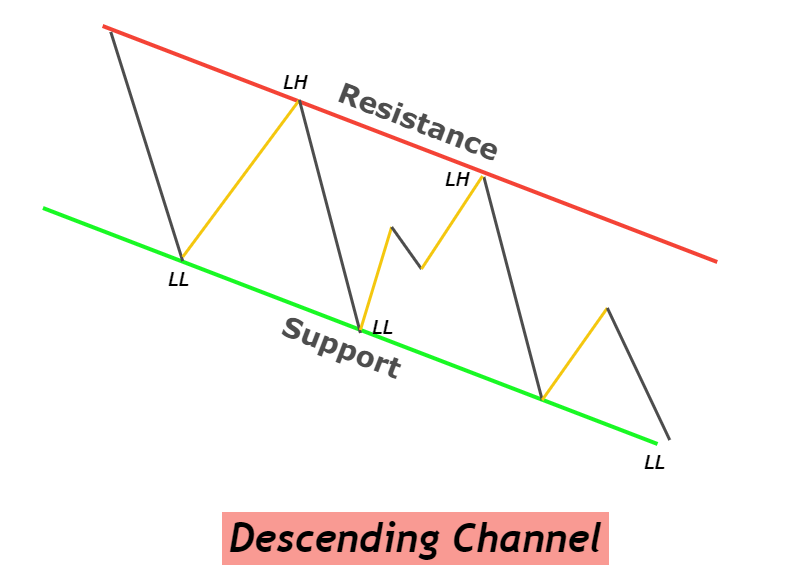
Descending Channel Pattern
Descending the price channel shows the bearish trend on the price chart. Two downward parallel trendlines meeting the lows and highs of price waves (lower highs and lower lows) will make a descending Channel.
The trend of a currency pair or any asset will remain bearish until the price breaks the descending Channel line. Due to strong trendlines, the price always bounces from these lines. Channels are used in identifying the nature of the market trends and most retail traders rely on this method of technical analysis.
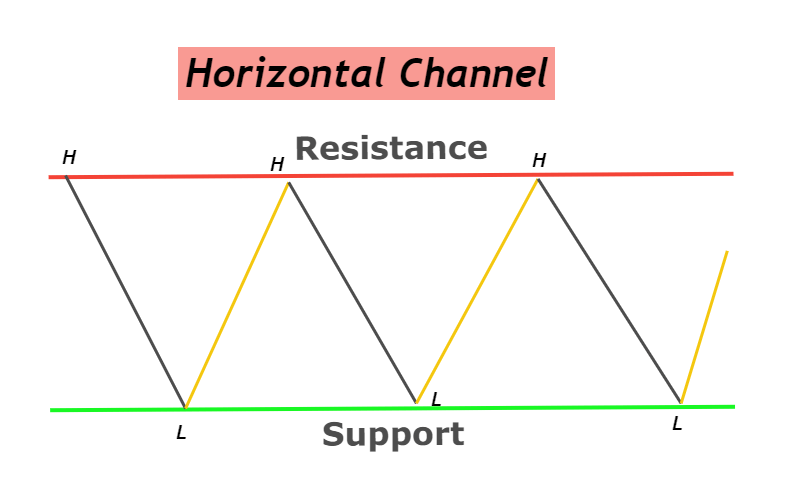
Horizontal Channel Pattern
A horizontal channel represents the sideways price movement. Sideways price movement is also named as ranging. Two horizontal lines meeting the top and the bottom of price waves will make a horizontal channel.
The ranging market structure tells a retail trader that there is neither a bullish nor bearish trend in the market. That’s why the price is moving up and down within a horizontal channel.
It is easy to trade horizontal channel patterns because there are only two simple rules in this strategy.
- Buy from the support or bottom of the channel
- Sell from the resistance or top of the channel
How to draw price Trend channels?
There are many ways to draw trend channels on the price chart. But we have filtered the best method that works.
Follow the following rules before drawing a price trend channel
- Look for at least three swing points on the chart. Swing points can be highs or lows.
- Draw a line meeting the three swing points. Adjust the line to minor extent to meet all the three points.
- Now clone the first line and adjust the line to the other side of swing points. For example, if first line is meeting the lows then second line should meet the highs of waves and vice versa.
- Candlesticks should not close outside the range of channel.
What does channel pattern tell a trader?
A price channel tells a trader that either the market will continue the trend or a trend reversal will occur. Trend continuation channel is further classified into three types as discussed in the above three types. Trend reversal is related to channel breakout. Because price keeps on changing its trend and it is a natural pattern.
That’s why Channel breakout is used to detect a trend reversal or change of type of channel. After the breakout, the price will change trend.
For example, price is moving in a bullish trend channel, then after the breakout, the price trend has two options either to make a new bearish trend channel or make a horizontal channel. And the price will keep on changing the type of channel with time.
Look at the image below for a better understanding of the pattern.
A channel defines the nature of price trends in a technical way.
Pro Tip: Before confirming a trend reversal you should confirm trend reversal by price action technique(higher high and lower low method).
Price channel Breakout
A price channel breakout is used to confirm trend reversal. When a candlestick closes outside the range of the price channel then a breakout will happen. A big candlestick breaching through the trendline and closing outside the channel is an indication of breakout and trend reversal.
- Ascending channel breakout will turn bullish trend into bearish trend or sideways price movement.
- Descending Channel breakout will turn bearish trend into bullish trend or sideways price movement
- If the upper line breaks in horizontal price channel then a bullish trend will start. On the other hand, if lower line breaks in horizontal price channel then a bearish trend will start.
For example, you are trading with a bullish trend in an ascending channel then after the breakout of the channel, you should avoid trading in the bullish direction. Because breakout is a sign of trend reversal
Why should you use Channels in forex trading?
It’s difficult for an intermediate or newbie trader to identify the type of price trend. Trading channels make it easy to analyze the trend. So a retail trader can only trade in the direction of the main price trend(institutional traders).
Simply trade with the trend, draw a channel based on the above criteria and trade with institutional traders.
Conclusion
It is always recommended to draw channels. Because these Channels will help a trader to pick pinpoint entries, adjust take profit levels, and stop-loss levels. By adding price action patterns with trend channels, you can get more profitable results.
Practice at least 100 times before analyzing trend using trend channels.