
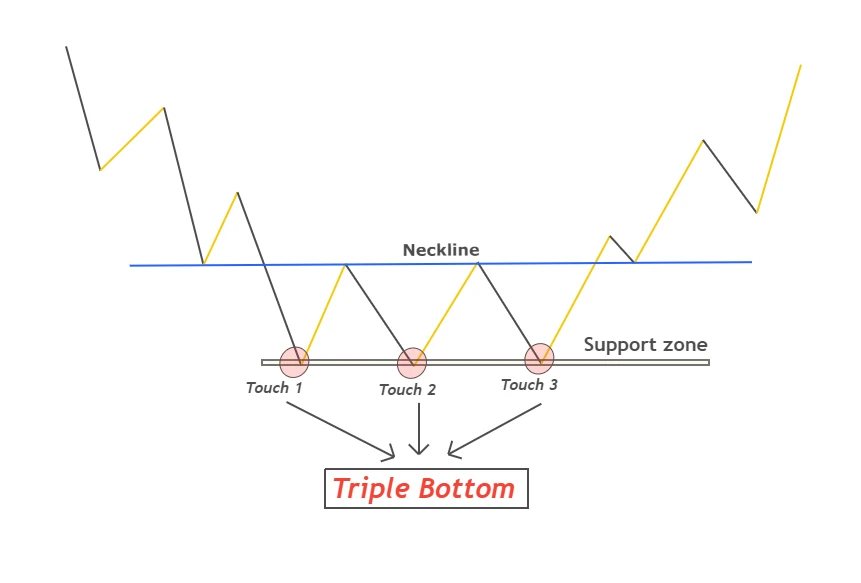
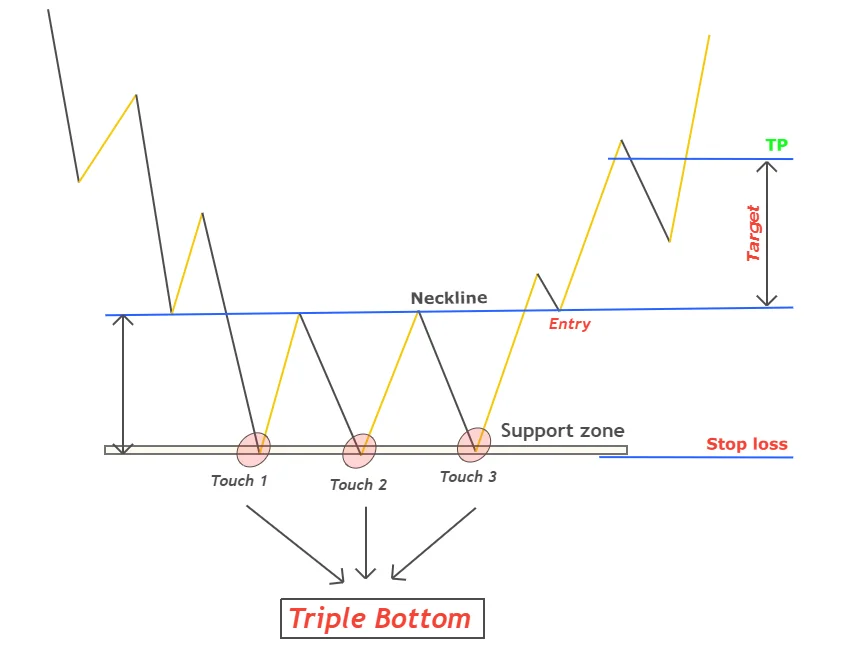
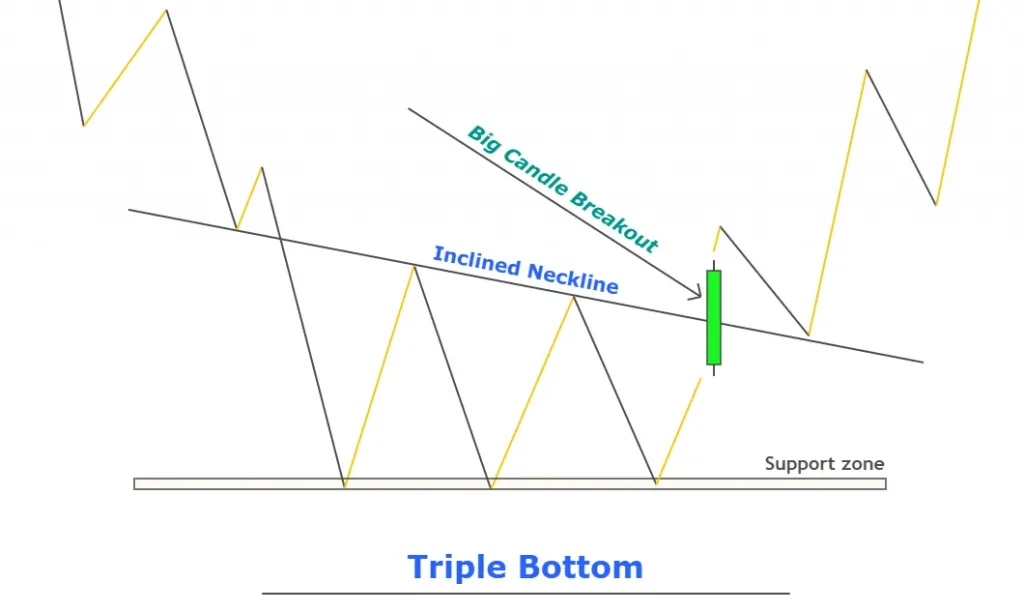
A triple bottom pattern in trading is a reversal chart pattern in which price forms three equal bottoms consecutively and after neckline/resistance breakout, price changes bearish trend into a bullish trend.
It is the most widely used chart pattern in forex/stocks trading and the most basic pattern in technical analysis. Analysts use this pattern to predict upcoming trend reversals in the market.
psychology of triple bottom pattern
The triple top pattern acts as a brake for a trend. before the formation of this pattern, bears are in full control and price is in a bearish trend. Then price bounces three times from a support level and it also forms a neckline above the pattern. three bounces or triple bottom indicates that buyers are willing to buy the price from that level. there are more buyers than sellers. At the third bounce, the number of buyers increases, and the number of sellers decreases.
but still, the trend is bearish until the breakout of the neckline. after neckline breakout, market makers eliminate the retail traders (sellers) and then the trend changes from bearish into bullish. Now buyers are in full control.
The triple bottom pattern represents the absorption of supply three times or the weakening of the seller’s power three times, and it also shows that buyers are gaining power with time.
How to identify correct triple bottom trading pattern?
Finding out a correct pattern in technical analysis is important. if you are trading a chart pattern in the wrong way then you will lose a lot in trading and psychological effects will overcome you.
there are three steps to identify a valid triple bottom chart pattern in trading.
- Identify bearish trend (formation of consecutive lower lows and lower highs).
- Draw a valid support zone using two swing waves
- sketch a valid neckline meeting the two touches of swings.
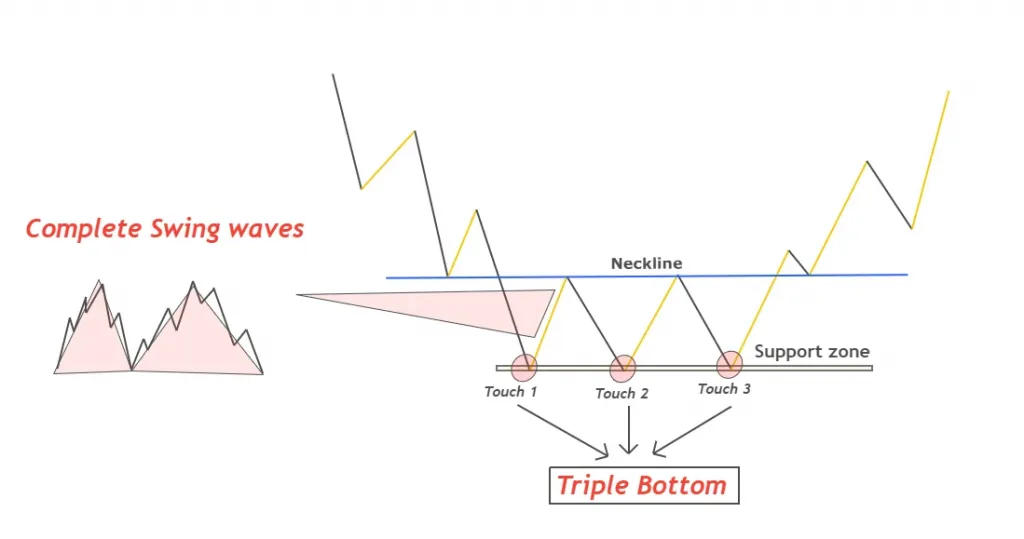
what is swing?
here in this chart pattern, swing means a complete wave pattern that consists of five impulsive and three retracement waves. you don’t need to calculate waves here, just try to identify one complete wave or swing.
the triple bottom pattern has three touches on the support level. three touches must be valid. Touches/bounces of price by two waves are considered valid. if there is only one wave but three touches then the triple bottom pattern has not been completed yet. because without two valid bounces, this pattern does not make any sense.
That is why trying to build up chart reading skills in trading will add you to the top 1% of profitable traders.
What is neckline?
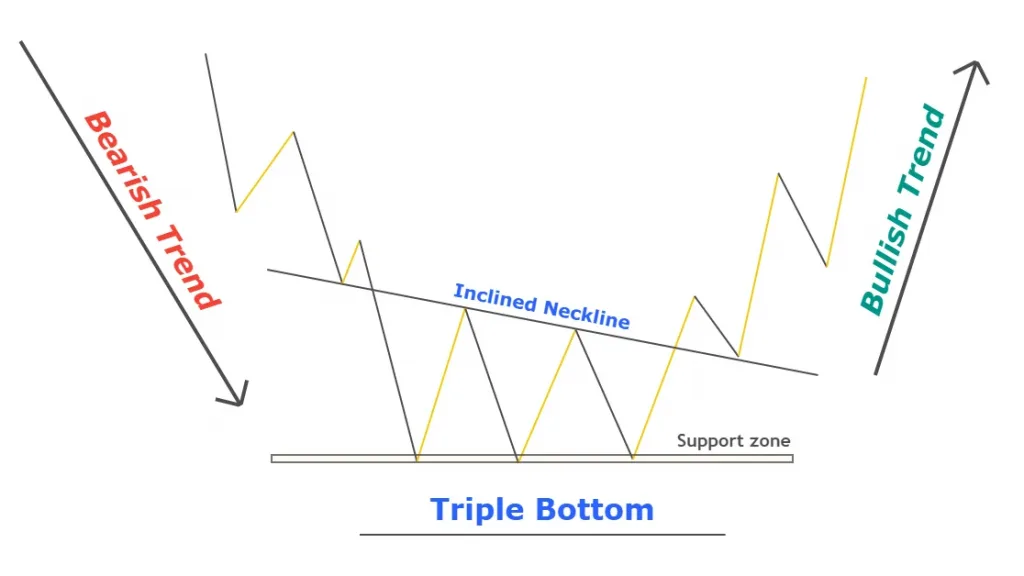
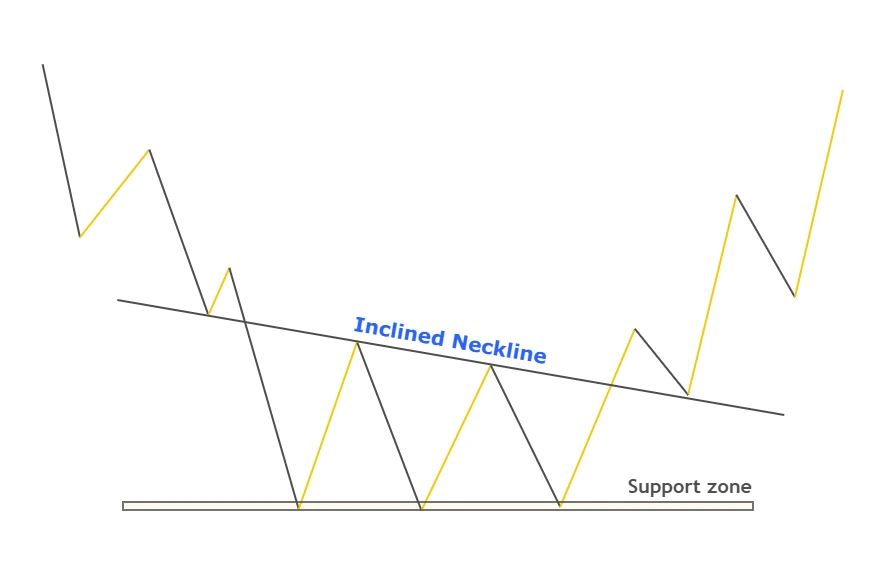
The neckline is a resistance level form at the top of the triple top pattern. The neckline is further divided into two types, and it depends on the market conditions.
- Inclined resistance (trendline)
- Horizontal resistance zone
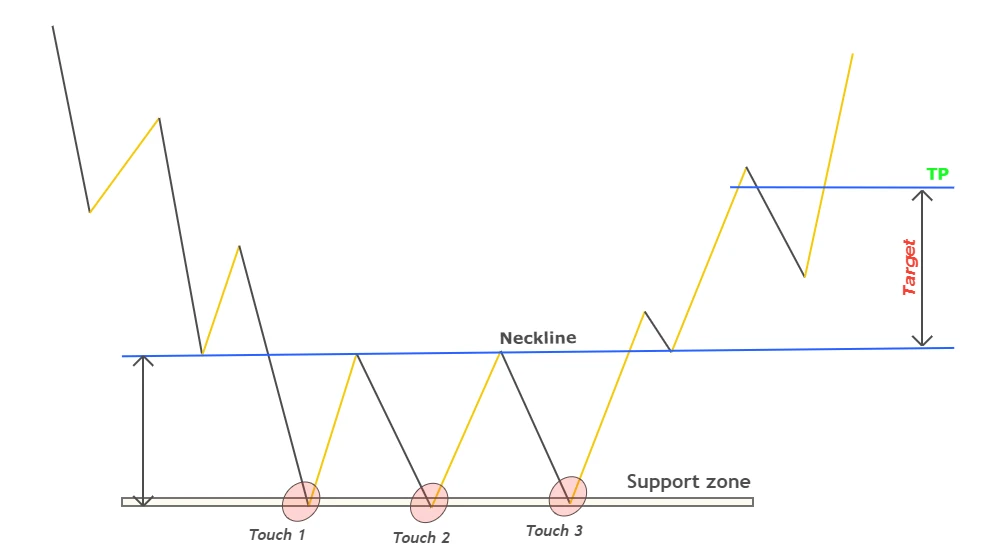
What are three bottom touches?
At the support zone, there are buyers that push the price up but because of the previous bearish trend, they are not able to change the trend in just one push. They try three times and after neckline breakout, the trend changes.
Every time price touches the support zone after a complete wave, it becomes one touch. According to this pattern, after three touches market decides its direction.
How to trade triple bottom stock chart pattern?
The triple bottom pattern completes after the breakout of the neckline. After neckline breakout, we will open a trade position and adjust our stop loss and take profit levels.
Entry
In the entry, there are two options available.
- First is to open order just after breakout of neckline.
- Second is to open order on neckline retest.
Opening an order on retest is the safest option also it will offer you a good risk-reward ratio.
Stop loss
Place stop loss below the low of the triple bottom pattern.
Take profit
Calculate the average distance between the support and resistance and mirror it above the neckline and place take profit level.
Now let me explain the main point of this article, triple bottom pattern trading strategy
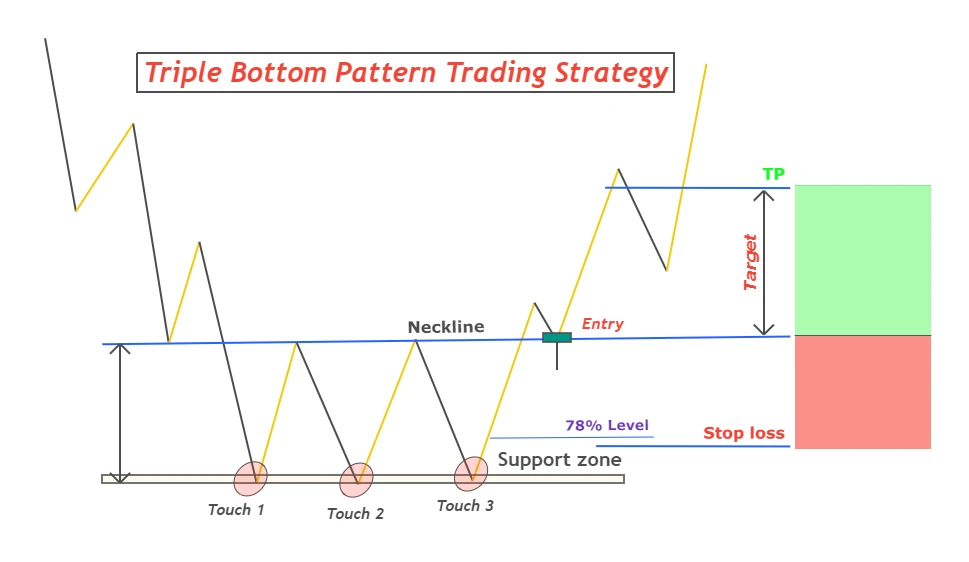
Triple bottom chart pattern trading strategy
To trade chart patterns effectively, I have made a strategy of the triple bottom pattern. Without a proper strategy, you will end up losing in forex/stocks. Strategy increases the winning ratio of a chart pattern, and it filters out the best triple bottom patterns from the crowd.
I have created few parameters to trade this pattern with the trend.
- Analyze higher timeframe trend by zooming out the chart. Higher timeframe Trend must be bullish.
- Check the oversold condition using the RSI indicator or using the price action. If you are beginner, I will recommend you use RSI indicator.
- Identify a correct double bottom pattern
- During neckline breakout, breakout candlestick must be a big candle.
- Wait for the price to retest the neckline. At the neckline look for a bullish pin bar. Bullish pin bar is an entry signal. Open order after spotting a bullish pin bar at the neckline.
- place stoploss below the 78% fibonacci level to increase risk reward.
- Take profit levels will remain same as explained in the above heading.
This is a simple triple bottom pattern trading strategy.
How to avoid false neckline breakout or fake out?
A false breakout is a very big problem that most beginner traders face and it is the most widely used strategy by market makers. To avoid fake-out in the triple bottom pattern, I will recommend following the big candlestick strategy.
Big candlestick has more than 80% body to wick ratio and it is usually bigger than few last candlesticks. If there is a neckline breakout with a Doji, then it will be a fake-out.
Broadening pattern vs triple bottom pattern
There is a clear difference between the triple bottom and broadening pattern in forex trading. Do not confuse it. Both have three touches most of the time. broadening chart pattern simply represents indecision but the triple bottom shows reversal.
Draw support zone correctly like shown graphically in the image below.
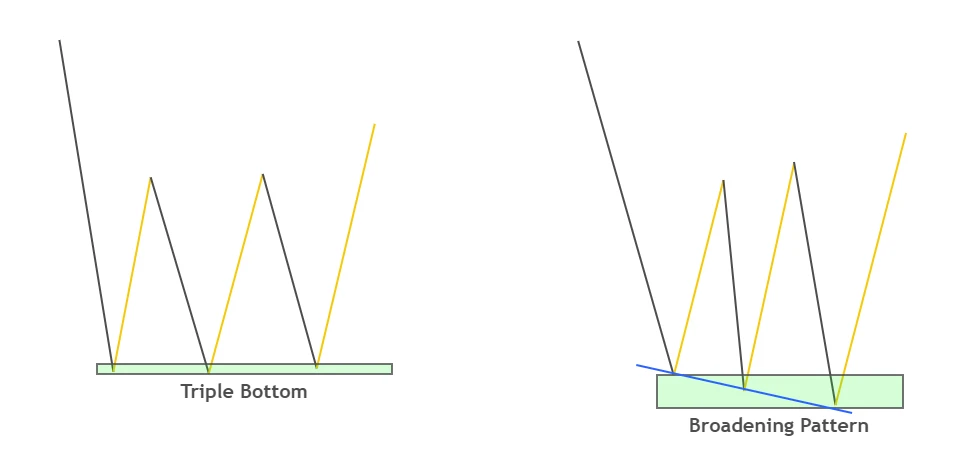
This is a tip for you to trade triple bottom patterns in the best way.
Conclusion
The end results are that triple bottom is the easiest pattern to trade in the financial market. You can become a profitable trade by following the triple bottom strategy. I will recommend you to find out the triple bottom on the higher timeframe and then trading in the direction of reversal on the lower timeframe to enjoy high risk-reward trading. This is the best method.
The best timeframe is the 4-hour candlestick chart or any timeframe above 4H. because it is the most basic pattern so it will give many false signals in a lower timeframe.
No, it is not a bearish pattern. This is a bearish reversal pattern and changes trends from bearish into bullish.
Thanks Ali for these content.Very educative and well explained which makes one to easily follow
Thanks a lot Andrew