
Definition
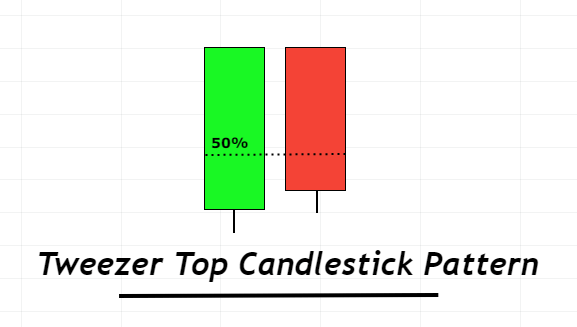
The tweezer top is a reversal candlestick pattern that consists of two opposite color candlesticks and the closing price of the first candlestick will be equal to the opening price of the second candlestick. The first candlestick will be bullish and the second will be a bearish candlestick. In tweezer top, both candlesticks do not have wicks on the upper side.
It is a reversal pattern that changes the price trend from bullish into bearish. Due to the high winning ratio, it is widely used by retail traders to forecast future trends by technical analysis. The tweezer top is another shape of pin bar candlestick.
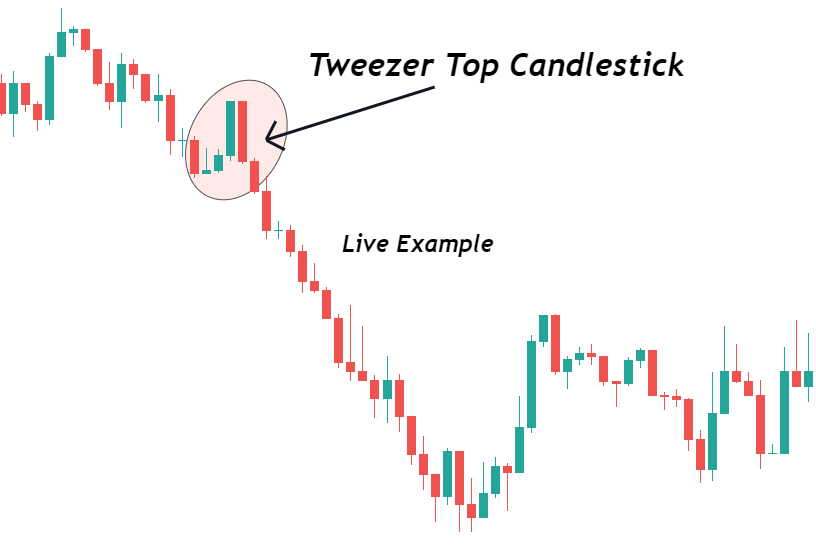
How to identify the tweezer top candlestick on the chart?
To find out a perfect tweezer top on the price chart, follow the following steps.
- The first candlestick should have same high and close price. It should have body greater than 60% because body size indicates momentum of sellers/buyers.
- The second candlestick should have same high and open price. It should open at the close price of first candlestick and body size of candlestick should be greater than 60% of total candle size.
- The closing price of second candlestick must be below the 50% level of first candlestick.
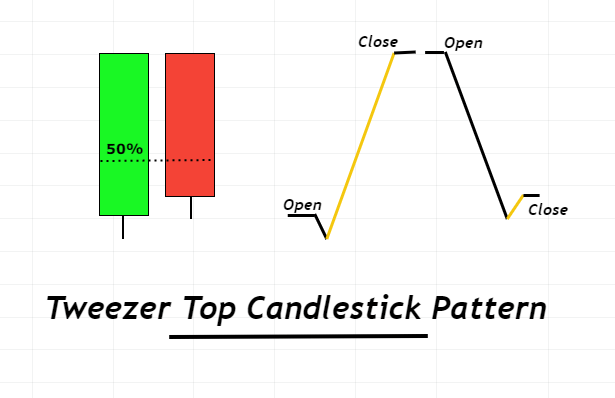
The third step is mandatory to follow because closing and opening price matters a lot in technical analysis. The structure of the tweezer top candlestick pattern is very simple and easily understandable but on the live price chart, you will have to follow rules to overcome psychological barriers.
How does the pin bar be similar to the tweezer top pattern?
Mostly tweezer top will make a pin bar pattern on the higher timeframe. For example, if the tweezer top pattern forms at 30min timeframe then a pin bar will form at a 1H timeframe.
Because the opening and closing price of candlestick patterns is very important. Like engulfing candlestick tweezer top also make a pin bar on a higher timeframe.
Look in the image below for a better understanding of the structure of this candlestick pattern.
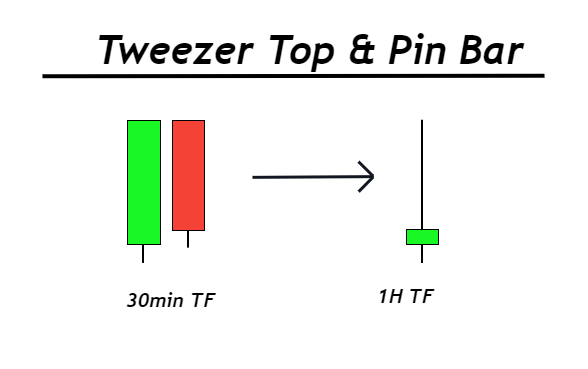
Due to this characteristic of this candlestick pattern, it is very important and has a higher winning ratio.
Pro tip: Advance technical analysts can analyze a candlestick pattern on multiple timeframes by analyzing a single timeframe. Because they prefer to check the opening and closing price of candles.
Tweezer Top: Information Table
| Features | Explanation |
|---|---|
| Number of Candlesticks | 2 |
| Prediction | Bearish trend reversal |
| Prior Trend | Bullish trend |
| Counter Pattern | Tweezer bottom |
Trading psychology of tweezer top pattern
The psychology of the tweezer top candle will enable you to know the activity of institutional traders behind the scene.
For example, the first bullish candlestick will have a small wick/shadow on the lower side and a large body above the wick. It represents that buyers are pushing the market by breaking a strong level and they want the price to close above the key level. But sellers are already waiting for the best price to open sell orders.
When bullish candlestick will close then a lot of selling orders will open from the key level that will bring the price down and will break the 50% level of the previous candlestick (the strong level created by buyers). Price closing below the 50% level of the previous candlestick is the initial step of weakening the buyers and it is an indication for sellers to sell the price.
After the break of low of the previous candlestick, bearish trend reversal will be confirmed. If you will open a higher timeframe, you will get a bearish pin bar on a higher timeframe indicating the trend reversal.
This is how you should try to read the price to identify a valid tweezer top pattern.
How to trade tweezer top candlestick?
According to backtest results, tweezer top candlestick alone cannot be used to get profit from the forex market. Because during ranging market conditions, a lot of false candlestick patterns will form. So to avoid false price patterns, we have added two confluences
- Resistance zone
- Fibonacci golden zone
You can also add your own confluences to make a profitable strategy based on the tweezer top pattern.

Find High Probability Trades with this ADVANCED Candlestick Patterns Course
The Ultimate Candlestick Patterns Course That Will Help You To Trade Better
Tweezer top candlestick at Resistance zone
The resistance zone on the price chart has the potential to reverse the price trend. But if a tweezer top will form at the resistance zone then the potential of both price patterns will combine resulting in high probability trade setups.
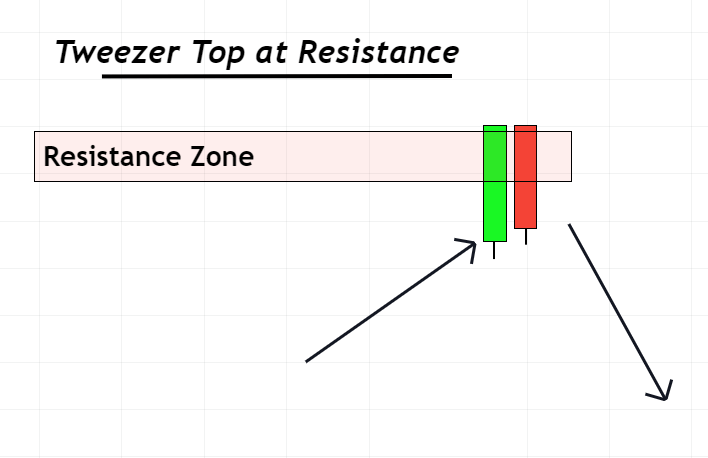
Pro Tip: The candlestick patterns that give a false breakout by a wick or Shadow at the Resistance zone and then close below the resistance level have a high probability of trend reversal.
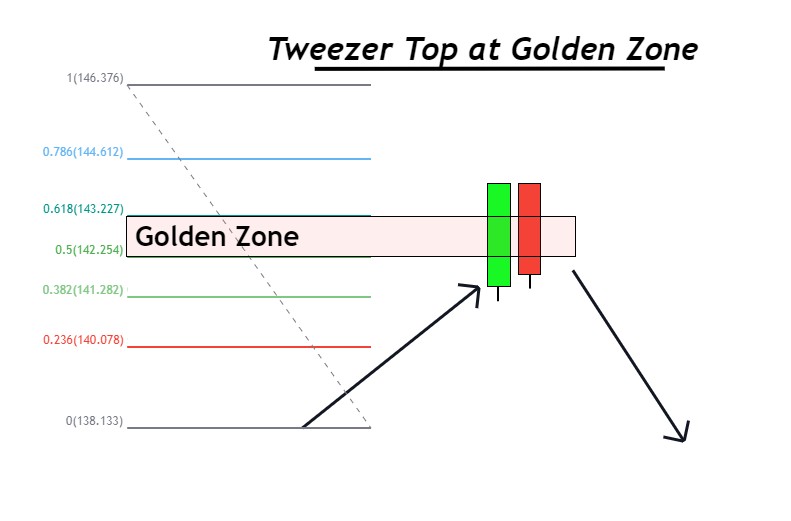
Tweezer top at Fibonacci golden zone
The Fibonacci golden zone has high great potential to reverse the price trend. If a tweezer top will form at the Fibonacci golden zone then the probability of price trend reversal will increase. That’s why it is always recommended to use a candlestick pattern with the confluence of other price patterns.
The Bottom line
Tweezer top candlestick pattern can also be used to confirm a sell trade. There are many ways to use a candlestick pattern but when you will understand the psychology behind this pattern then you can use it for technical analysis in many ways.
You should try to optimize the trading strategy by addition of confluences and filters like moving average etc.
Make sure to backtest this candlestick pattern at least 100 times before using it for technical analysis.