

Introduction
Supply and demand zones are the most basic Terminologies in forex trading. Without supply or demand, the price will not be able to move on the chart, and it will always remain in a straight line. Supply-demand creates an imbalance in the market that results in price fluctuations.
In this article, you’ll learn about the 4 types of supply and demand zones in technical analysis, as technical analysis is quite different from the fundamental analysis. And we can also identify zones on the price chart using simple strategies.
Types of Supply and Demand zones
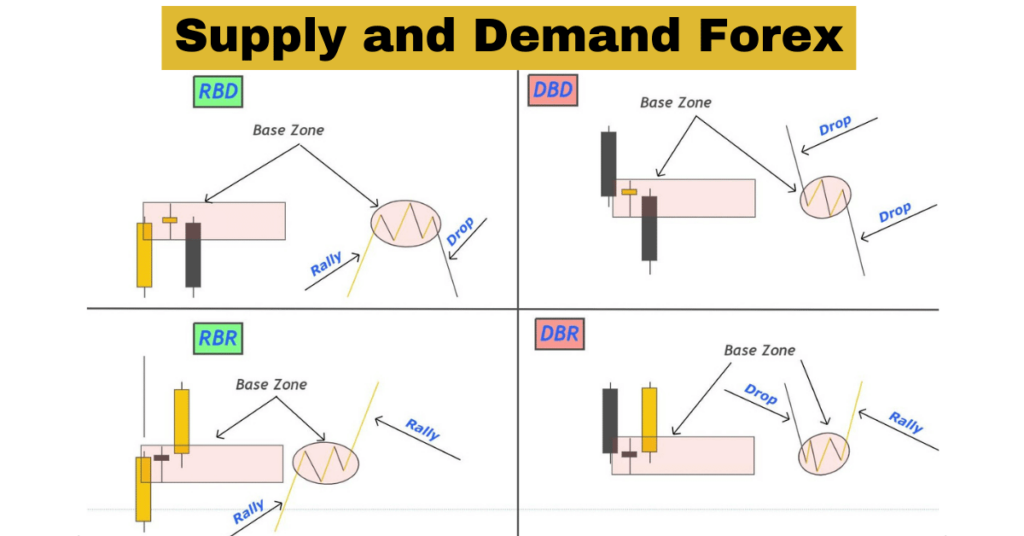
In technical analysis, there are four types of supply and demand zones.
The demand zone represents the rally base and drop base rallies, while the supply zone represents the drop base and rally base drops.
These are footprints of market makers, and advanced forex traders use this concept of supply and demand in technical analysis of currency pairs. You can learn these patterns in detail, but I have explained a short formula to identify these zones on the price chart.
Formula to find supply and demand zones
- Rally base rally: Big bullish candlestick + Base Candlestick + Big bullish candlestick
- Drop base drop: Big bearish candlestick + base candlesticks + Big bearish candlestick
- Drop base rally: Big Bearish candlestick + Base candlesticks + Big bullish candlestick
- Rally base drop: Big bullish candlestick + Base candlesticks + Big bearish candlesticks
These are the four simple formulas used to identify zones. The big candlestick means a candle with a larger body to wick ratio, while the base candlestick means a candle with a smaller body to wick ratio.
Importance of supply and demand zones
The main importance of supply and demand zones is that these zones show the pending orders of institutional traders and big banks.
In simple terms, supply and demand trading is the method to follow the banks and big traders. About 94% of the forex market is traded by the central banks, hedge funds, and institutions. The rest of the 6% is the retail traders. So that’s why if you want to make a profit, you should try to predict the movement of these market makers. If you trade like a retail trader with emotions, you will lose in this market.
The second important thing is that the basis of the supply and demand zones is the price action. Because price repeats the above four price patterns after irregular time intervals on the candlestick chart, this is a price action strategy. It is not originated from mathematical formulas but from natural patterns.
Examples of supply and demand zones
This section will explain how price picks the pending orders of institutions from the supply or demand zones.
For example, in USDJPY, the price made a demand zone in a rally base rally. This demand zone was fresh because it had not touched the zone yet. So, it means pending buy orders are still there. In technical analysis, the formation of a demand zone means big traders want to buy the currency at that price.
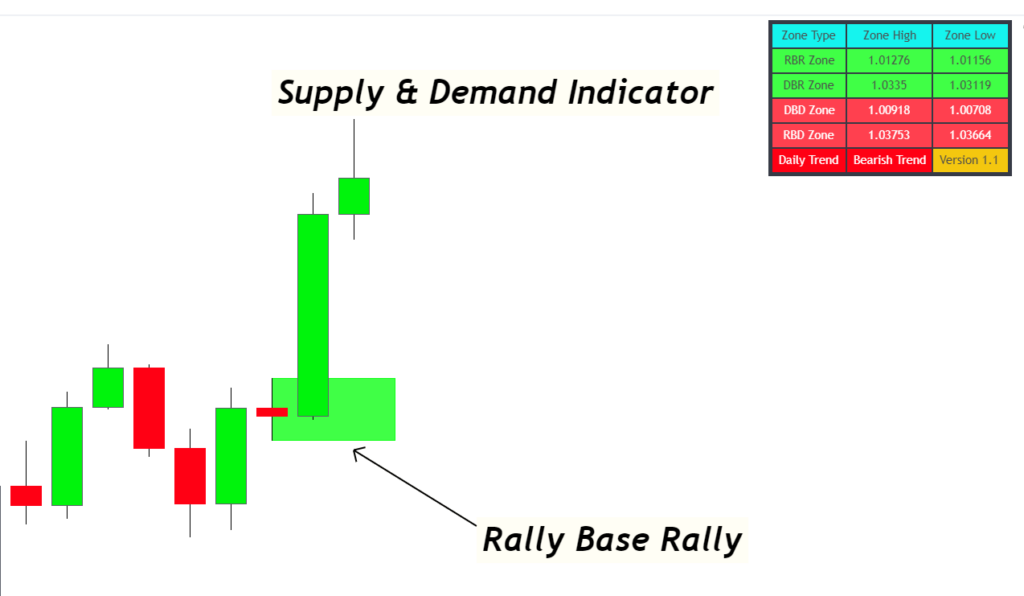
Whenever we saw the rally base rally zone, we also placed pending buy orders at demand zones to trade with the institutions.
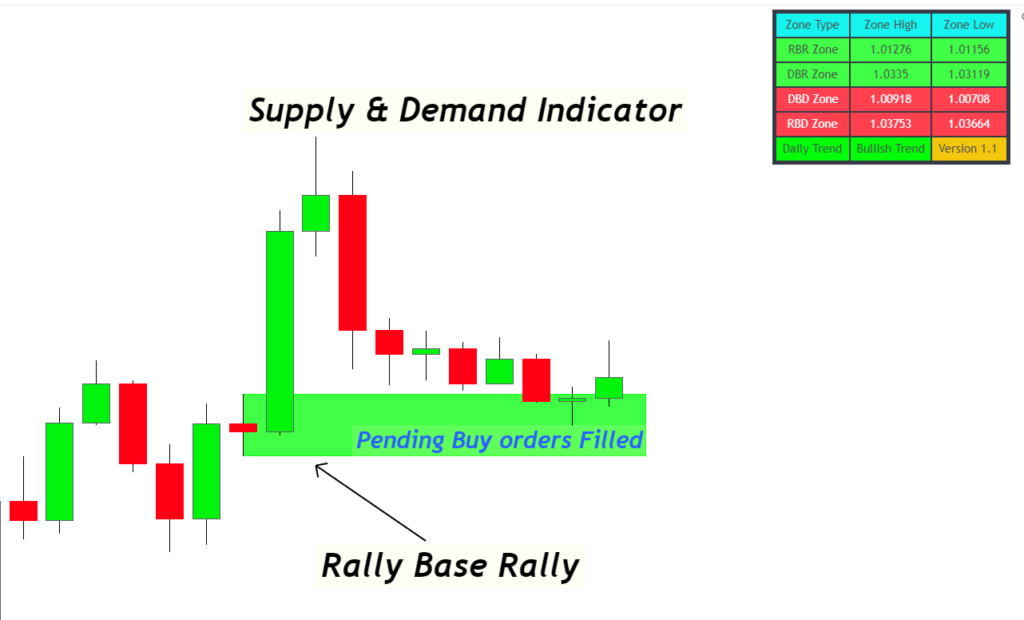
After a complete swing, the price returns to the demand zone with momentum. When price fills the pending buy orders, it will continue its bullish trend because demand has increased. As a result, the price will increase.
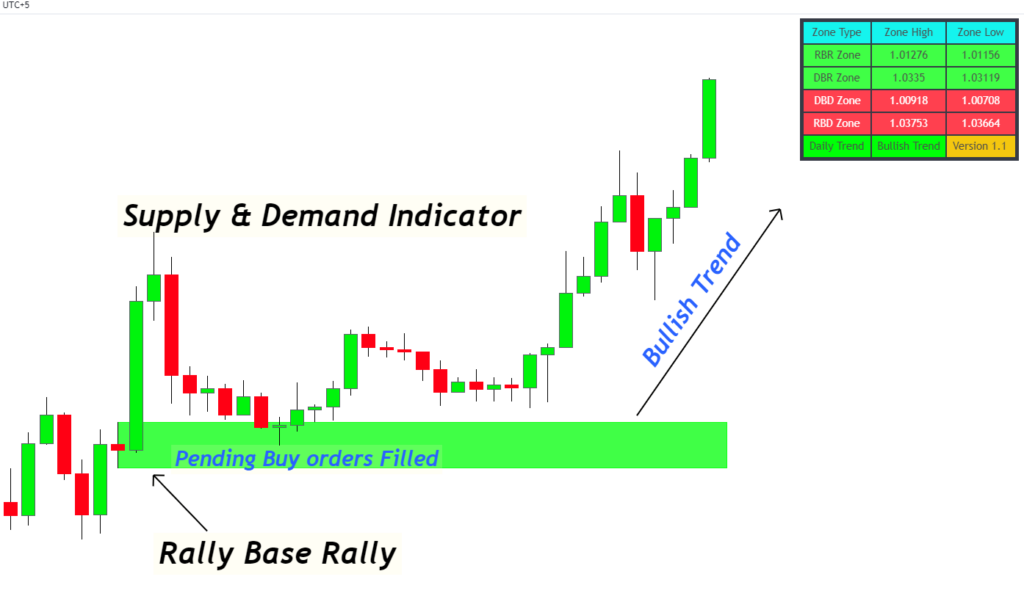
Check this Supply and Demand indicator that is based on a semi-manual trading strategy. It draws the most accurate supply/demand zones automatically using price action. It will help to increase the profit potential in supply and demand trading.
What is the difference between fundamental and technical analysis of supply-demand in trading?
There is a significant difference between these two analyses.
Price always moves due to the difference in supply and demand of a certain currency or asset. For example, if more buyers are willing to buy the dollar, then the dollar demand will increase. This increase in demand is directly proportional to the rise in the US dollar price. On the other hand, if more sellers are willing to sell dollars, the supply of dollars will increase. This will result in a decreased price of the dollar.
The method or news that informs us about the demand of the dollar or supply of the dollar in the market is fundamental analysis.
Now let’s come to the main point: the supply and demand in technical analysis.
In technical analysis, we draw the zones on the price chart using the natural price behaviour like the triangle or wedge patterns. These patterns also form on the price chart after irregular intervals of time. In the same way, there are other natural patterns like compression and rarefactions, etc. These patterns depict the presence of supply or demand in a specific price range.
The rally base rally and drop base drop show the phenomenon of compression and rarefactions on the price chart.
I hope you’ll understand this difference. If you’ve not made it yet, then keep on reading. You’ll understand it after reading the whole article.
The Bottom line
Supply and demand trading is the best method in technical analysis and fundamental analysis. There are many other trading methods like volume spread analysis, naked chart, Elliott wave, etc., but supply and demand are the best of all.
I have learned all the trading methods initially, but now I am stopped at supply and demand trading. Now I’m just improving this technique with the time. I will also recommend you stick to supply and demand to trade.
You can also take the confluence of other methods, but your strategy should be based on supply and demand.
Good information,easy to understand.want more about price action.
I think you are a really confused or Am I? Because you said: The demand zone represents the rally base and drop base rallies, while the supply zone represents the drop base and rally base drops.
So number 3 and 4 for are Demand zones and 1 and 2 are supply zones. Even in the graphics below you show the same, but I think that RBR and DBR are Demand Zones and RBD and DBD are Supply zones, but you draw them correctly in the imágenes more bellow, can you please check and let me know if I am wrong or not