

Definition
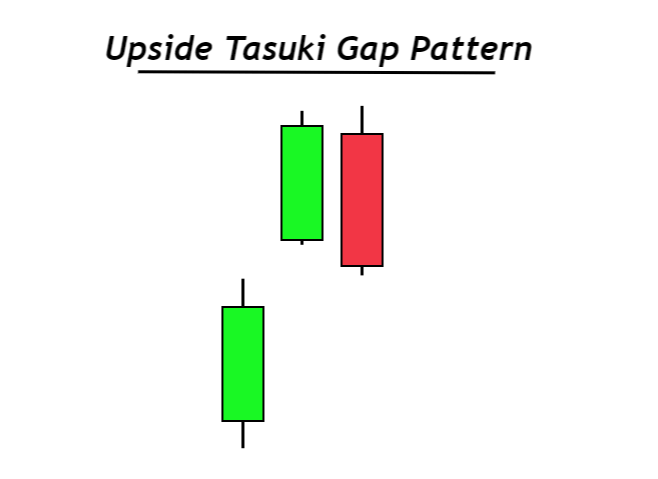
The upside Tasuki gap is a bullish trend continuation pattern that consists of three candlesticks and an upside gap. Two bullish candlesticks, a gap, and a bearish candlestick form in a specific sequence to confirm the pattern of an upside of the Tasuki gap candlestick.
This candlestick pattern tells retail traders that the market’s bullish trend will continue, and buyers are in control. It also lets the retail traders hold long positions to maximize the profit potentials.
How to identify an upside Tasuki gap candlestick?
To understand the structure of the Tasuki gap candlestick, follow the following guidelines.
- The first candlestick will be a significant bullish candlestick representing the massive momentum of buyers and a bullish price trend.
- The second candlestick will open with a gap up and outside the range of the previous candlestick. It will have a higher closing price and a small candle size.
- The third candlestick will be bearish. It must open within the range of the previous candlestick and close above the closing price of the first candlestick.
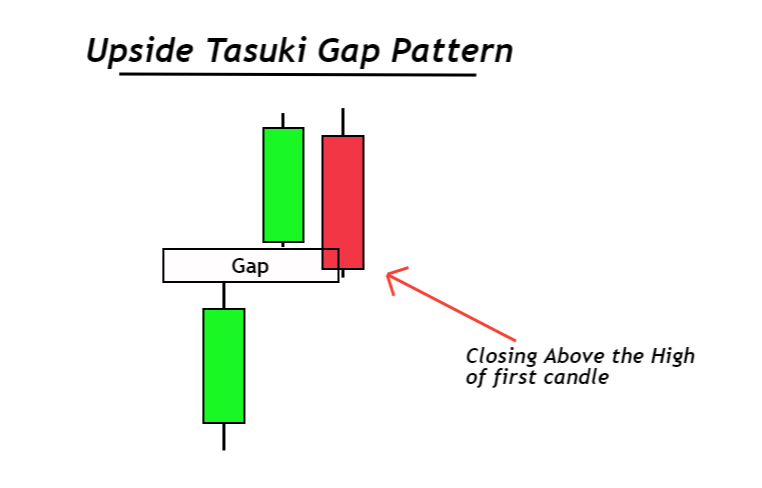
These are the above three requirements you need to check to confirm an upside Tasuki gap candlestick pattern on the price chart.
Upside Tasuki Gap: Information Table
| Features | Explanation |
|---|---|
| Number of Candlesticks | 3 |
| Prediction | Bullish trend continuation |
| Prior Trend | Bullish trend |
| Counter Pattern | Downside Tasuki gap |
Understanding the structure of upside Tasuki gap pattern
The structure of a market pattern tells us a story of the activity of institutional traders behind the candlestick chart. It is the best practice to understand that story. Because it will help you in live trading to make the best decisions.
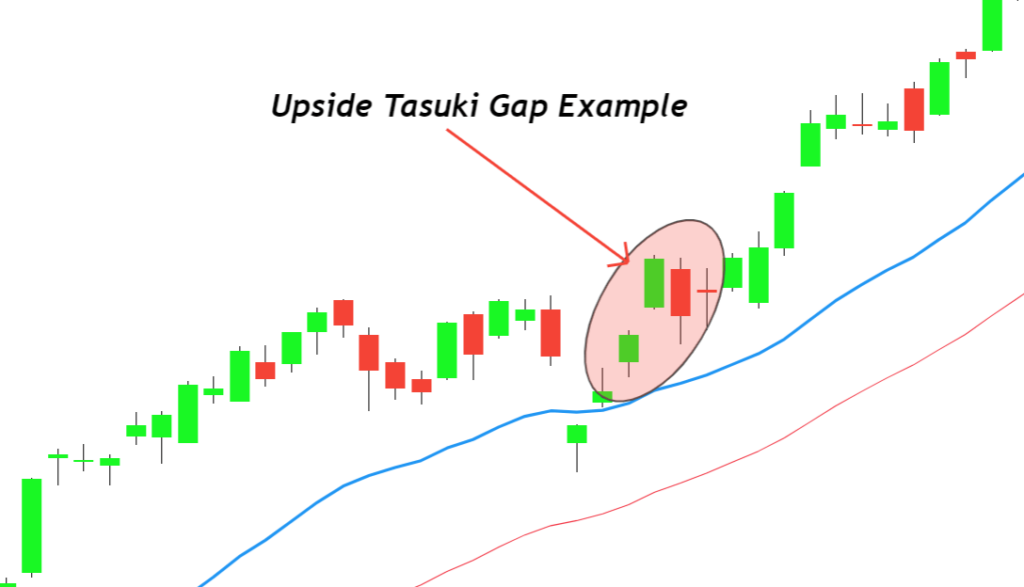
Let’s read the price chart.
The first candlestick indicates that buyers control and drive the market in a bullish direction. It also represents the trend of the market that’s bullish.
After forming a long bullish candle, the price will open with a gap up representing the huge momentum of buyers coming into the market.
Pro tip: When many buy orders are filled at the end of a session, the candlestick will open with a gap up at a higher price.
Price always move in the form of impulsive and retracement wave. After retracement, an impulsive wave shall form and vice versa.
As the two bullish candlesticks show the bullish impulsive wave, a bearish candlestick will form, indicating the retracement wave.
A deep retracement means the trend’s strength is poor, whereas a minor retracement indicates a strong trend. So that’s why it is in the requirement that the bearish candlestick should close above the closing price of the first candlestick.
That’s why after a minor retracement in the form of the bearish candlestick, a bullish impulsive wave will form again. It represents the trend continuation.

Find High Probability Trades with this ADVANCED Candlestick Patterns Course
The Ultimate Candlestick Patterns Course That Will Help You To Trade Better
How to trade an upside Tasuki candlestick pattern?
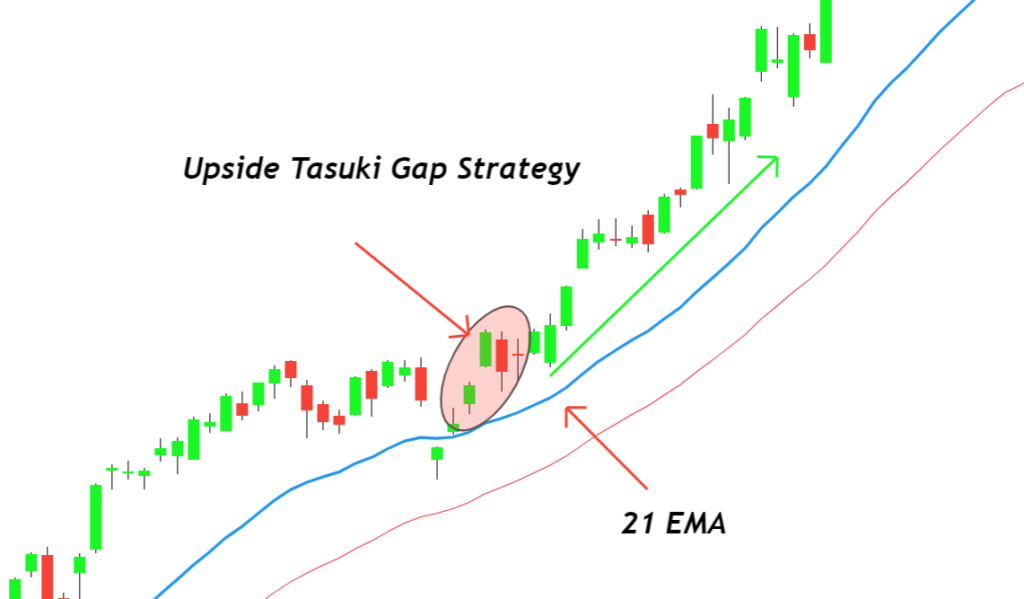
It is a trend continuation candlestick pattern used in trading with the confluence of other technical analysis tools like trendline or moving averages.
Simple EMA trading strategy
- Plot a 21 EMA and 38 EMA on the chart. Then confirm the direction of the trend, and it must be bullish. Price will be bullish if candlesticks form above the moving average line.
- Open a buy order during an uptrend when an upside Tasuki pattern will form and place stop-loss below the moving average line. Hold the trade until moving average crossover does not happen in a bearish direction.
This is a simple strategy, but you can add other technical analysis tools to make it more precise.
Conclusion
Tasuki candlestick pattern is primarily used in the chart of stocks and indices. In forex, engulfing candlestick or pin bar candlesticks are important candlesticks.
It is always recommended to not rely solely on a single candlestick. You should add other technical tools to make a perfect trading strategy.
Before trading on a live account, make sure to backtest the trading strategy properly.