
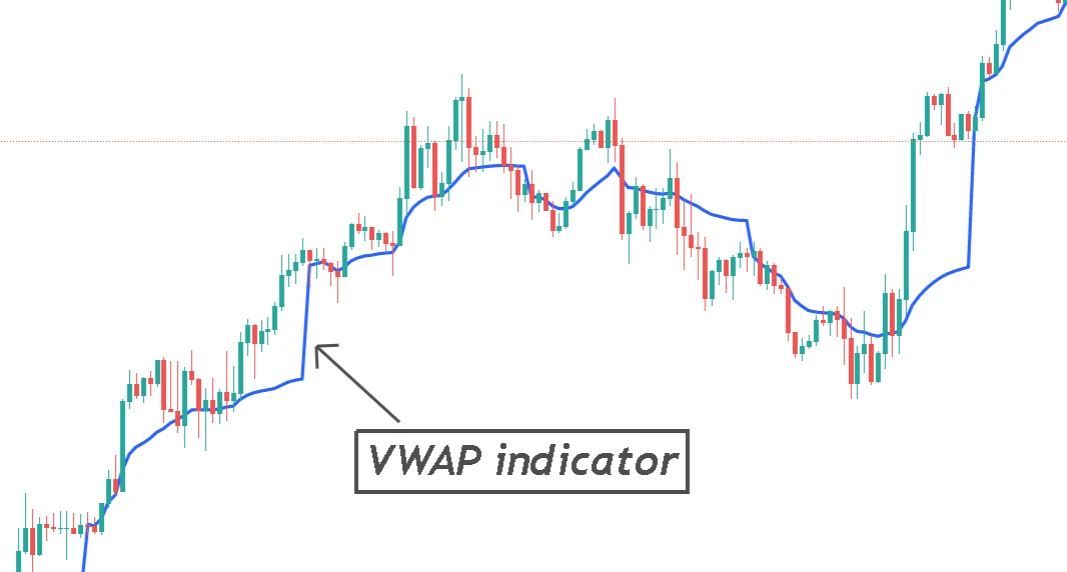
What is VWAP in trading?
VWAP means Volume Weighted Average Price that is an indicator that shows the weighted average of the price of a currency with respect to volume in a specific timeframe in the forex. It puts more emphasis on volume and the best alternative of the simple moving average.
VWAP shows the trend of a currency and indicates the activity of buying and selling of a currency pair in forex.
Characteristic of VWAP
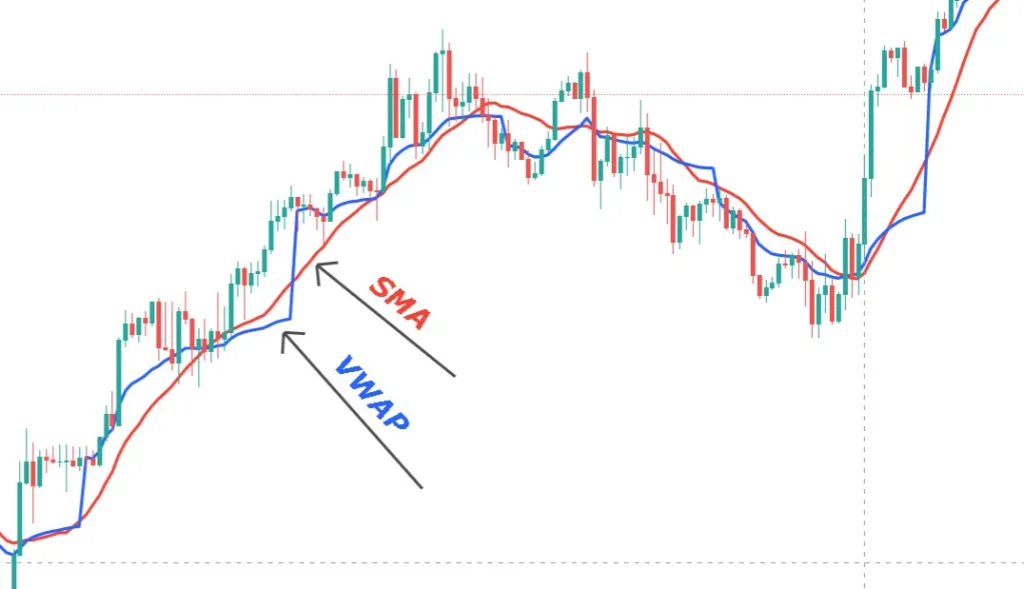
The characteristic of the VWAP indicator is that besides counting the average price, it also takes the volume of each candlestick into account. If one candlestick has more volume than previous candlesticks, it will put more weight on that candlestick. It will not put the weight of a single candlestick on all the previous candlesticks like in moving average. That’s why VWAP is more accurate than a simple moving average.
The formula of the VWAP indicator
The formula used in the VWAP indicator is composed of two parameters.
- Volume of a currency
- Average price of currency
Sum of multiplication of price and volume means it will multiply the volume of each candlestick with the average price of each candlestick and then will add all the values. Total volume means the sum of all the volume generated during a period specified in the indicator’s settings.
Use this VWAP calculator online for free. This will help you to calculate a custom value of the volume-weighted average price of any currency or stock.
Working of Volume weighted average price
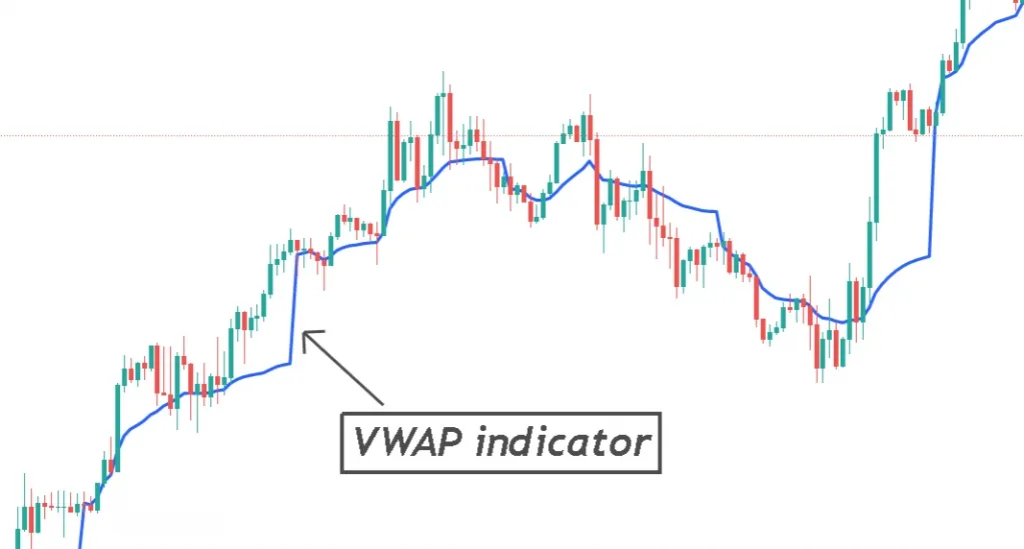
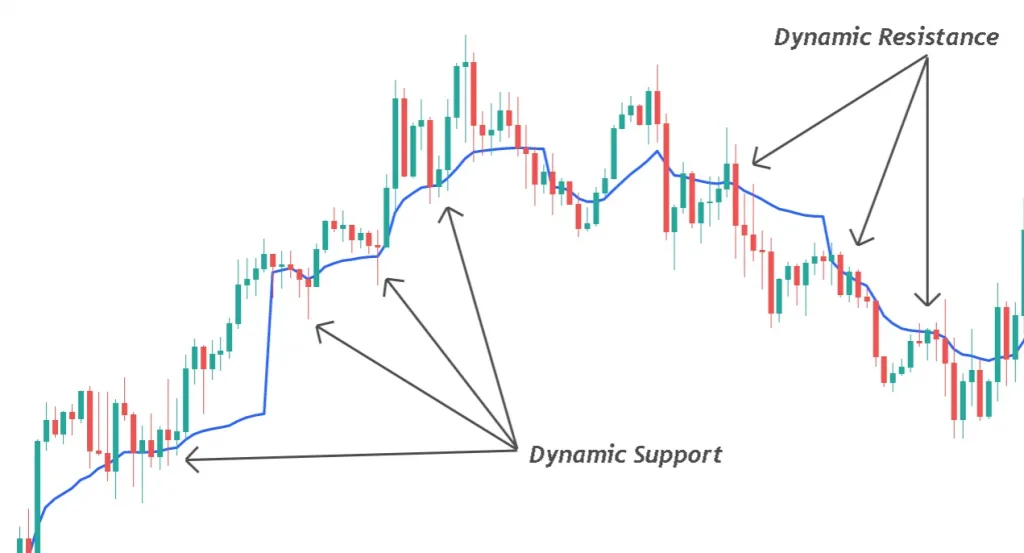
VWAP indicator works as a dynamic support and resistance line. Same as moving average but it is an advanced form of moving average. It shows the direction of the trend, trend reversal and pullback trading.
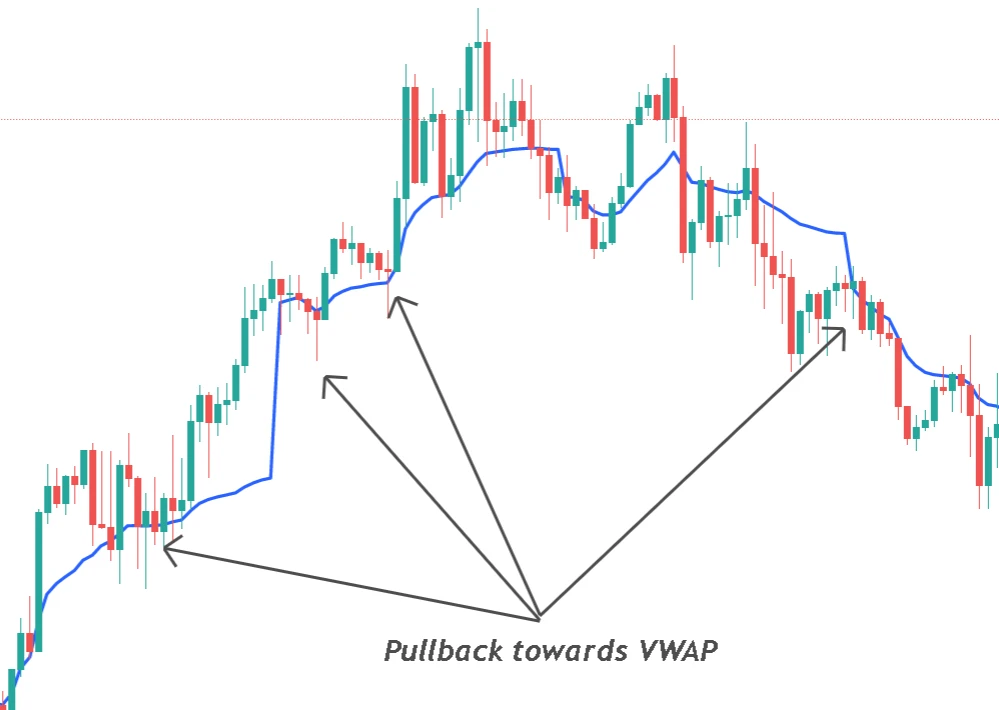
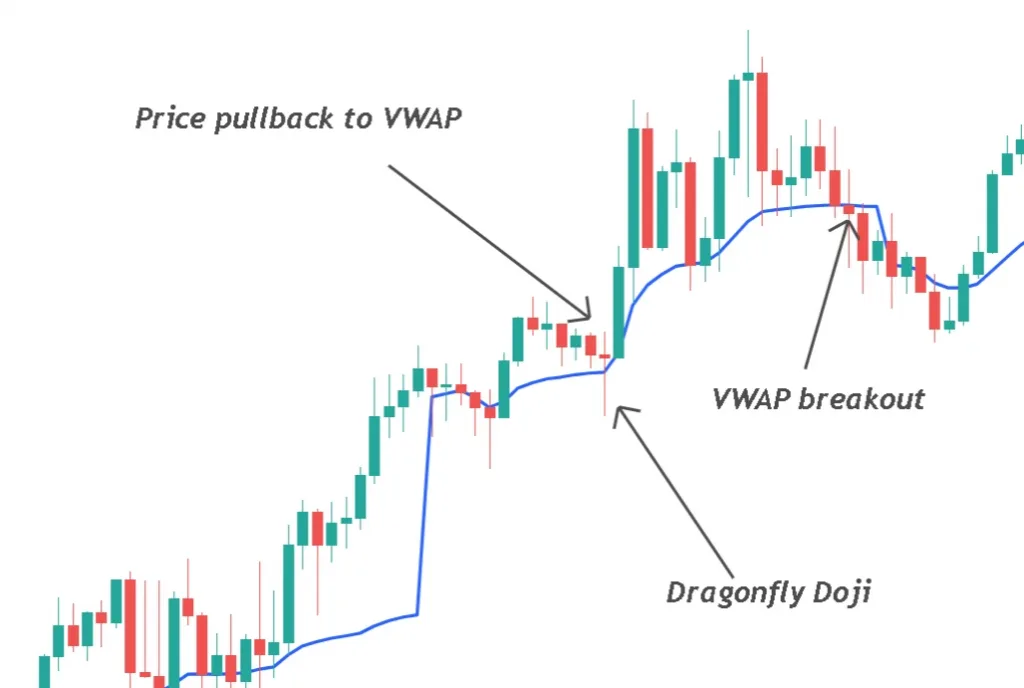
Price pullback to VWAP indicator
The simplest trade method of the VWAP indicator is using it as a support and resistance. Price bounced from the smooth line of VWAP. It is a lagging indicator because it uses historical data to show current strong price levels.
Support price level
When the price is in an uptrend (formation of higher highs & higher lows), then the smooth line of the VWAP indicator act as a support line. After completing the impulsive phase, when the price starts the retracement phase or gives a minor pullback to the VWAP line, then the price bounces after rejection from VWAP smooth line.
Why does it act as support? Because it is using previous data (volume + price) to draw the line. In an uptrend, bulls are controlling the market, so we will take only buy entries in the uptrend.
Remember: To identify a good pullback in an uptrend, always check the oversold level of price to get a better bounce from VWAP.
Resistance price level
During a downtrend (formation of lower highs & lower lows), the VWAP indicator acts as a resistance level. In this case, price bounces from the VWAP line after a minor pullback of price. When price rejects a certain price level, it means the price is holding that level.
You need to look for sell entries if the price is below the volume-weighted average price indicator and buy entries if the price is above the VWAP.
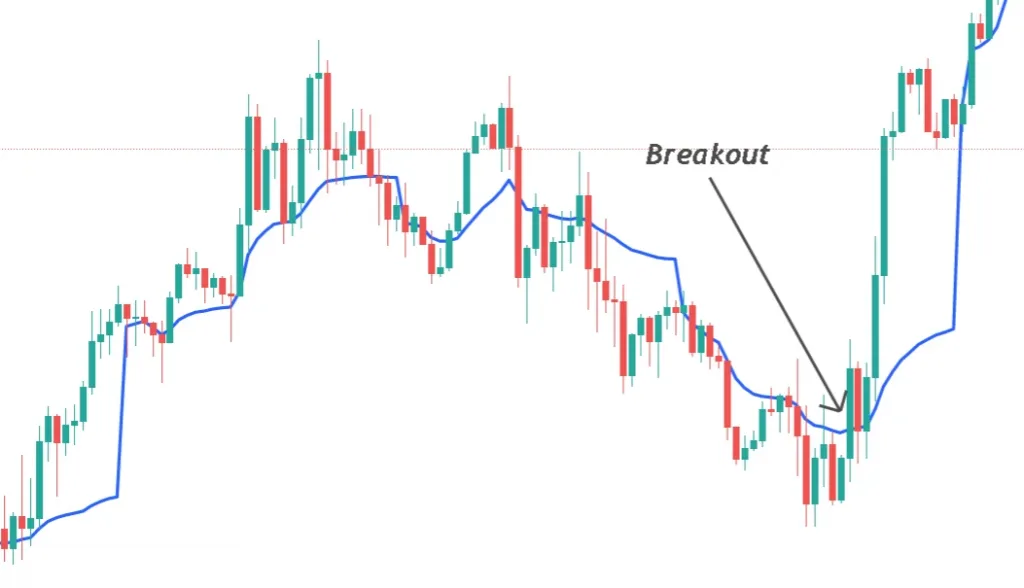
Breakout of VWAP
A reversal in trend happens after the breakout of VWAP. When a big candlestick breaches through the VWAP indicator then it means breakout and trend has reversed. In this way, you can use VWAP to identify trend reversal.
There are many false breakouts in the market. To filter false breakouts, look for a big candle breakout and wait for the formation of a further two to three candlesticks after the breakout. I will recommend trading VWAP for trend trading only. Breakout is to just identify trend reversal and trade exit point, do not use it for trade entries.
VWAP indicator for MT5
The volume-weighted average price indicator is free to use in the mt5 platform. Step by step guide to apply this indicator has been explained on the mql5 website.
Download VWAP indicator for MT5
How to trade VWAP indicator
To make a VWAP trading strategy, we will add a confluence to filter out the best trades. We will use the pullback in price as a confirmation to trade with VWAP.
The VWAP trading strategy consists of the following indicators
- Price pull back (shows the retracement in a currency pair)
- Volume weighted average price (shows the direction of trend and SR levels of a currency)
- Candlestick patterns (confirmation to open a trade in a currency)
Conditions to sell a currency
Pull back trading strategy works best with the VWAP indicator because these conditions are fulfilled only when the trading environment is clean. Breakout happens too frequently that is why we will not prefer to trade breakouts in VWAP strategy.
Sell trade setup consists of the following parameters
- Identify Trend using VWAP indicator (in downtrend)
- During Pull back of price towards the VWAP line, check the overbought conditions
- Confirm rejection of price at VWAP line by a reversal candlestick pattern (pin bar or bearish engulfing)
- Open sell trade on formation of reversal candlestick pattern and place stop loss few pips above the candlestick pattern
- First take profit level will be at the origin of pull back and hold the rest of the trade until bullish breakout of VWAP indicator.
Conditions to buy a currency
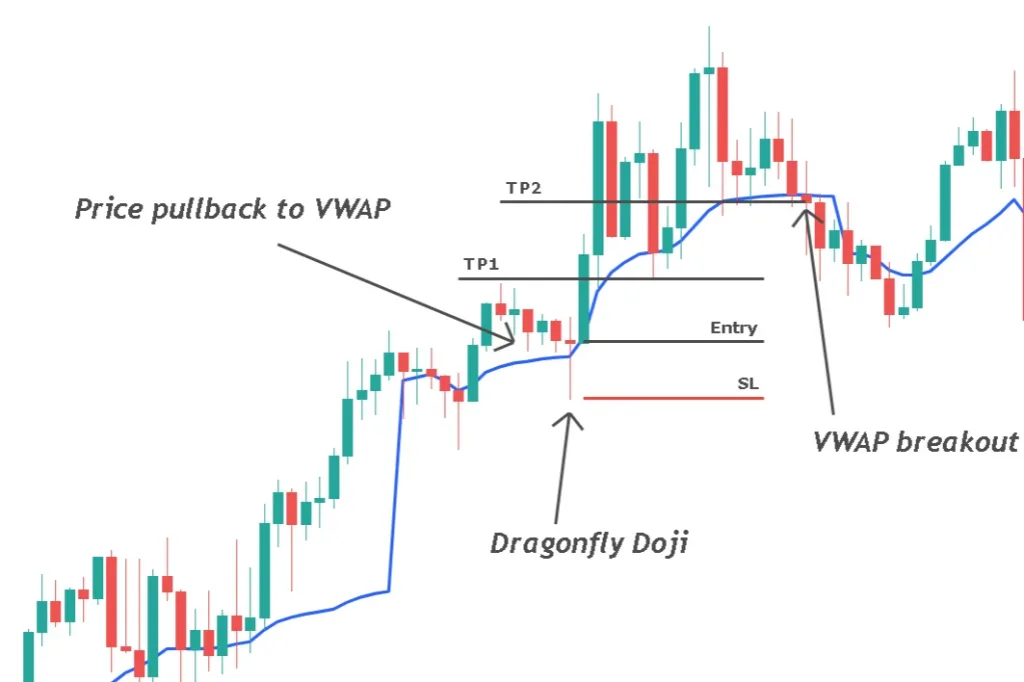
To buy a currency using the VWAP strategy, follow the following parameters properly
- The price must be above the VWAP indicator (in an uptrend)
- Check the oversold condition during price pullback towards the indicator line
- The price must reject the VWAP line by a candlestick pattern (bullish pin bar)
- Open buy trade after candlestick confirmation and place stop loss below the candlestick pattern
- TP1 will be at the origin of retracement and hold the rest of the trade until the bearish breakout of the VWAP indicator
Summary
Volume weighted average price indicator is more advanced form simple moving average and due to the influence of volume, it predicts correct data for every single move in the markets.
It can give profitable results if it is used for trend trading. Make sure to backtest the trading system properly before trading on a live account.
FAQs
Volume weighted average price indicator is a lagging indicator because it uses historical data to plot recent prices.
Intraday trading and swing trading timeframes are the best for VWAP trading. for example, timeframes between M15 and H4.