
Definition
Volume spread analysis or VSA trading is a technical analysis method that is used to forecast price by using volume in forex or stocks trading.
The importance of the VSA method is that every single candlestick is analyzed on the basis of volume. That’s why volume spread analysis reveals a lot of information regarding smart money.
Key Factors
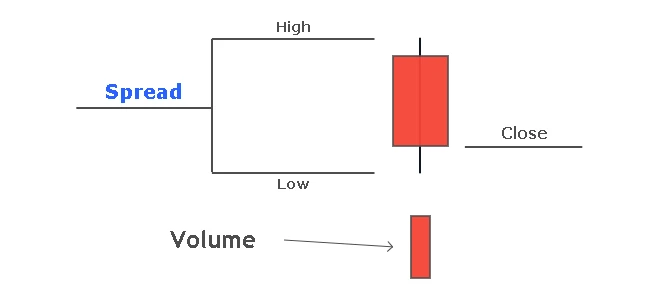
There are three key factors in volume spread analysis
- Spread of candlestick (it represents total range of candlesticks from low to high. It doesn’t mean bid or ask price in VSA)
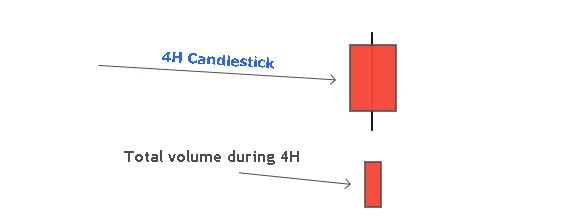
- Volume (Volume represents total transactions being done during a specific period of time)
- Candlestick closing price ( VSA method, closing price is important regard to momentum of buyers or sellers)
Market phases in volume spread analysis
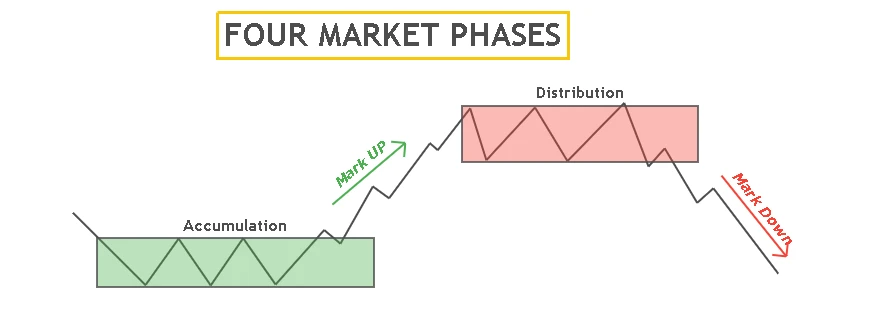
In Volume Spread Analysis, the price goes through four phases. Simply means a trend reversal in price occurs through four phases.
Reading logically is the most important step in technical analysis instead of trading blindly using indicators.
Let’s talk about the four phases of a bullish trend reversal.
- Accumulation (Big Guys buy at wholesale price)
- Mark-up
- Distribution (Big Guys sell at retail price)
- Mark down
Components of Volume Spread Analysis
The first step of VSA is to read the volume bar formed corresponding to the candlestick. Volume bars are categorized into four types in this technical analysis
- Low volume bar
- Average volume bar
- High Volume bar
- Very High Volume bar
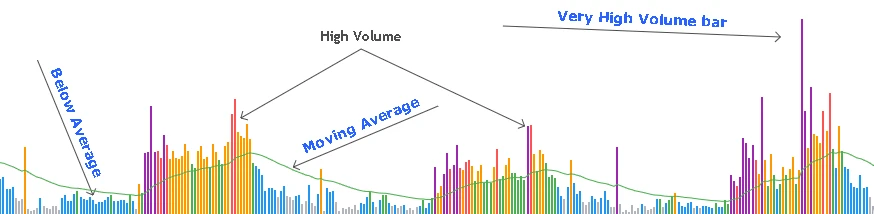
The reference point is the average volume bar. To identify average volume, add a 21-period moving average indicator. If the volume bar is close to the moving average line, then it will be considered as an average volume bar. A volume bar below the moving average line is a low volume bar and above the MA line is a high volume bar.
If the volume is unexpectedly higher than all the other volume bars (at least the last 61 bars) then it will be considered as a very High Volume bar. It reveals a lot of information regarding the activity of professional traders.
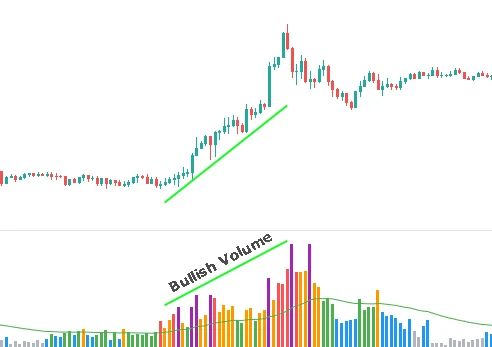
bullish Volume
The volume bar corresponding to bullish candlestick is called bullish Volume. In the bullish trend, bullish Volume bars are greater than bearish volume bars.
bearish volume
The volume bar corresponding to bearish candlestick is called bearish volume. In the bearish trend, bearish volume bars are greater than bullish Volume bars.
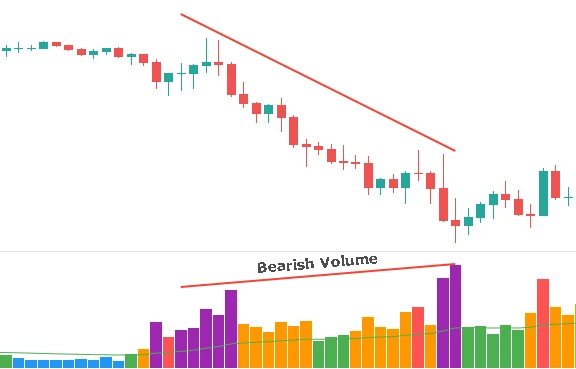
Chart reading using Volume Spread Analysis
Chart reading using VSA is the most important topic. According to the VSA method, if spread size is average and the size of the volume bar is greater or lesser than average, then there is smart money in simple words. A low volume indicates that smart money is not interested in buying anymore. High Volume means big traders are selling to retail traders by buying.
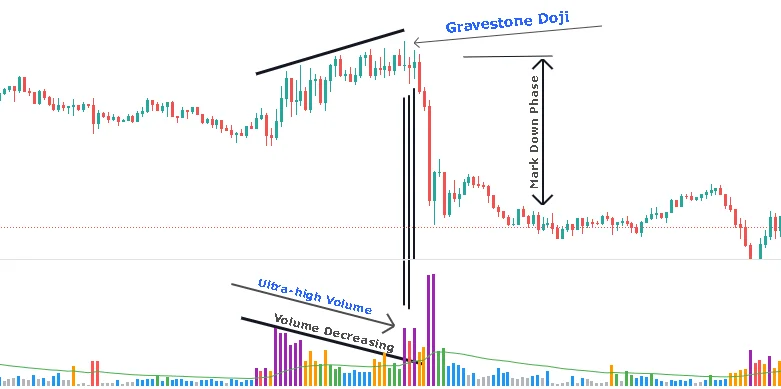
Ultra-high volume represents a trick played by big traders.
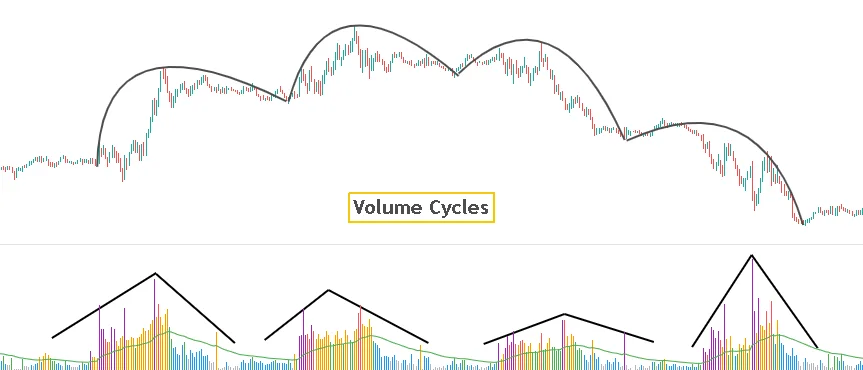
What is Volume cycle?
The market moves in the form of repetitive cycles. After one cycle completes, then the next will start. You can also name it market swings. In the same way, volume bars progress in the form of cycles. One market cycle represents one volume climax. This is helpful in identifying market cycles.
How volume spread analysis works?
Volume spread analysis working is on the basis of four market phases. According to VSA, a bearish candlestick represents the strength of the market, while a bullish candlestick shows weakness. This is opposite to what retail traders think (bullish candlestick shows strength and bearish candlestick shows weakness).
Only big players can move/reverse the market. If the price is in a bearish trend then big players have already sold from higher price, and it will continue until markdown phase completion. After the markdown phase, the accumulation phase starts, now big players are buying at wholesale rate. Then mark-up phase will be complete. In the distribution phase, big players will sell at higher retail prices.
This is a simple cycle, and it continues on all timeframes. Now I will explain to use volume and Spread to identify accumulation and distribution in the market to capture the mark-up or markdown phase.
Volume Spread Analysis trading strategy
There are two ways to use the volume spread analysis method. The first is to use the VSA method alone and the second method is to use price action with VSA. I will go with the second method which I will recommend to you.
Follow the following steps below to trade using VSA (volume spread analysis) and PA (price action).
- Identify Current timeframe trend by using higher highs and higher lows, or use 200 period moving average to identify trend.
- Detect retracement in the price. Retracement means start of accumulation or distribution phase.
- During accumulation or distribution phase, volume should be decreasing with the time. From higher volume to lower volume.
- At the end of distribution or accumulation phase / during start or mark-up or mark down phase, identify volume bars greater than the average volume bar. Detect high or very high volume bars, whereas candlestick spread size should be low or on average. As discussed above, when this situation happens, then there is smart money. Now, smart money will continue its move against retail traders.
- Identify pin bar or engulfing or any other reversal candlestick pattern at this level and enter the trade by placing pending order a few pips above or below the candlestick and adjust stop loss a few pips above or below the candlestick and ride the mark-up or mark down phase until it ends by analyzing stopping volume.
I have used a volume spread analysis indicator from tradingview that is showing different colors according to high, low, average, and ultra-high volume. You can also use that VSA indicator for free.
Conclusion
The best method in technical analysis is chart reading. Without proper logic, you will not be able to forecast properly and can win a few trades, but you will fail in the long run. So always trade with logic. The volume spread analysis method gives us the way to read the method of market makers.
Yes, it works in forex. But in forex, volume is generated using ticks. It is not the original volume like in stocks because of a decentralized system.
In forex trading, Volume is calculated by using the frequency of ticks and size of that ticks in a specific timeframe. A tick is the smallest possible movement in the market.
Tradingview is best for VSA trading. Because in tradingview, you can access a lot of free VSA indicators with a lot of customizations and alert features.