
Ah, the good ol’ yellow metal!
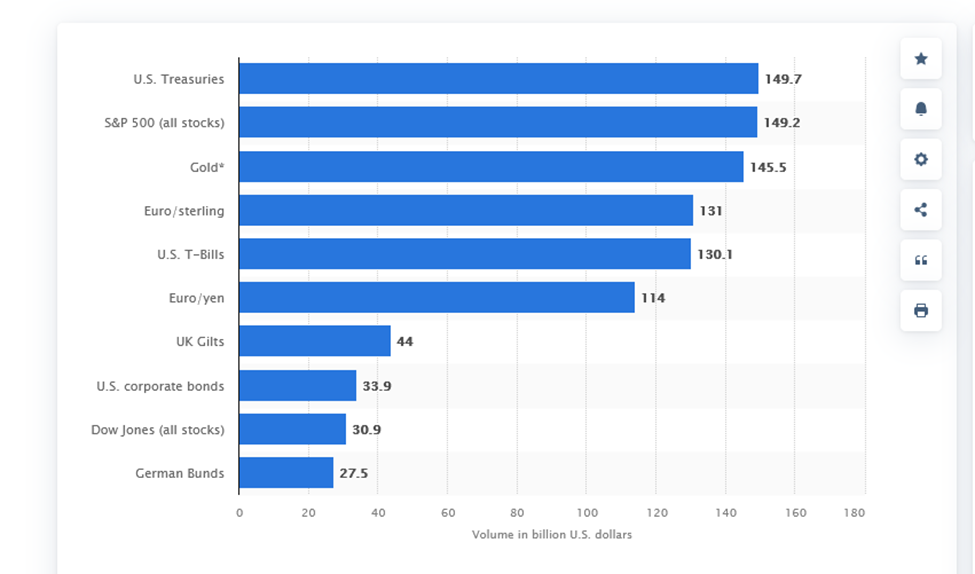
Gold attracts many investors with a daily volume of over $130 billion. Traders and institutions jump into gold trading every day.
They apply multiple trading strategies and combine fundamental and technical analysis.
When talking about technical analysis, trading indicators can help you.
This guide will look at the best indicator for gold trading and how you can apply it.
Why trade gold anyway?
What makes gold desirable is its history. Few investments have ever been as popular as gold as a hedge against every type of problem. Gold has always acted as a safe haven from inflation, economic downturns, or geopolitical instability.
People flock in to buy gold if things are going south. That’s why there is a significant gold trading volume.
Just look at the numbers!
Gold and USD have an inverse relationship. If the greenback falls, gold rises, and vice versa. Inflation can reduce a dollar’s purchasing power, so gold can act as a hedge here.
Even when gold isn’t rising at a quick pace, it’s still a good strategy to avoid losing out to inflation.
Not just a hedge, gold also benefits your portfolio diversification efforts. Many experts say that gold should make up 10% of your portfolio. Historically, when the stock drops, gold rises. So, gold can help in building long-term wealth.
How to choose the best indicator for gold trading?
Now that you know the importance of trading gold, let’s discuss choosing the best indicator.
Indicators are divided into two groups, price action and mathematical.
Mathematical indicators use calculations to illustrate the market trend. They use historical price data for their calculations.
Price action indicators use the current price to determine where the market is heading. Price action indicators perform better as they tell you the current market trend rather than calculating historical data.
So, how should you select an indicator for gold trading?
Choosing an indicator should not be like solving calculus. You should keep a couple of points in mind.
Here’s a quick view of them:
1. Trading style
Your trading style matters the most when selecting any indicator. Generally, gold trading is perfect for swing trading and position trading. However, you can also work around day gold trading and scalping.
Knowing your trading style can help you make a better decision in choosing the indicator.
2. Experience
The more experienced you are, the better you’ll be able to understand different indicators.
If you are a beginner, try to keep things simple. Don’t try to clutter your chart with plenty of indicators. Keep it clean and go for what suits your trading style.
So, with that said, let’s come to the juicy part and tell you the best indicator for gold trading.
I’ll mention two of them, so you can decide which one to choose.
1. Supply and demand indicator
Think of supply and demand as an area with a lot of buying and selling. Supply levels reflect the selling in the market, while the demand zones highlight buying.
So who does this large buying and selling?
The answer is banks and financial institutions.
Banks and institutors are like the OGs of the market; they are the prime drivers of the market. So, why not copy them?
Luckily supply and demand indicators can help you with this.
Many traders find it difficult to navigate these levels. The supply and demand zone indicator takes the guesswork out of the equation and identifies these levels. So, it’s helpful for beginners and pros.
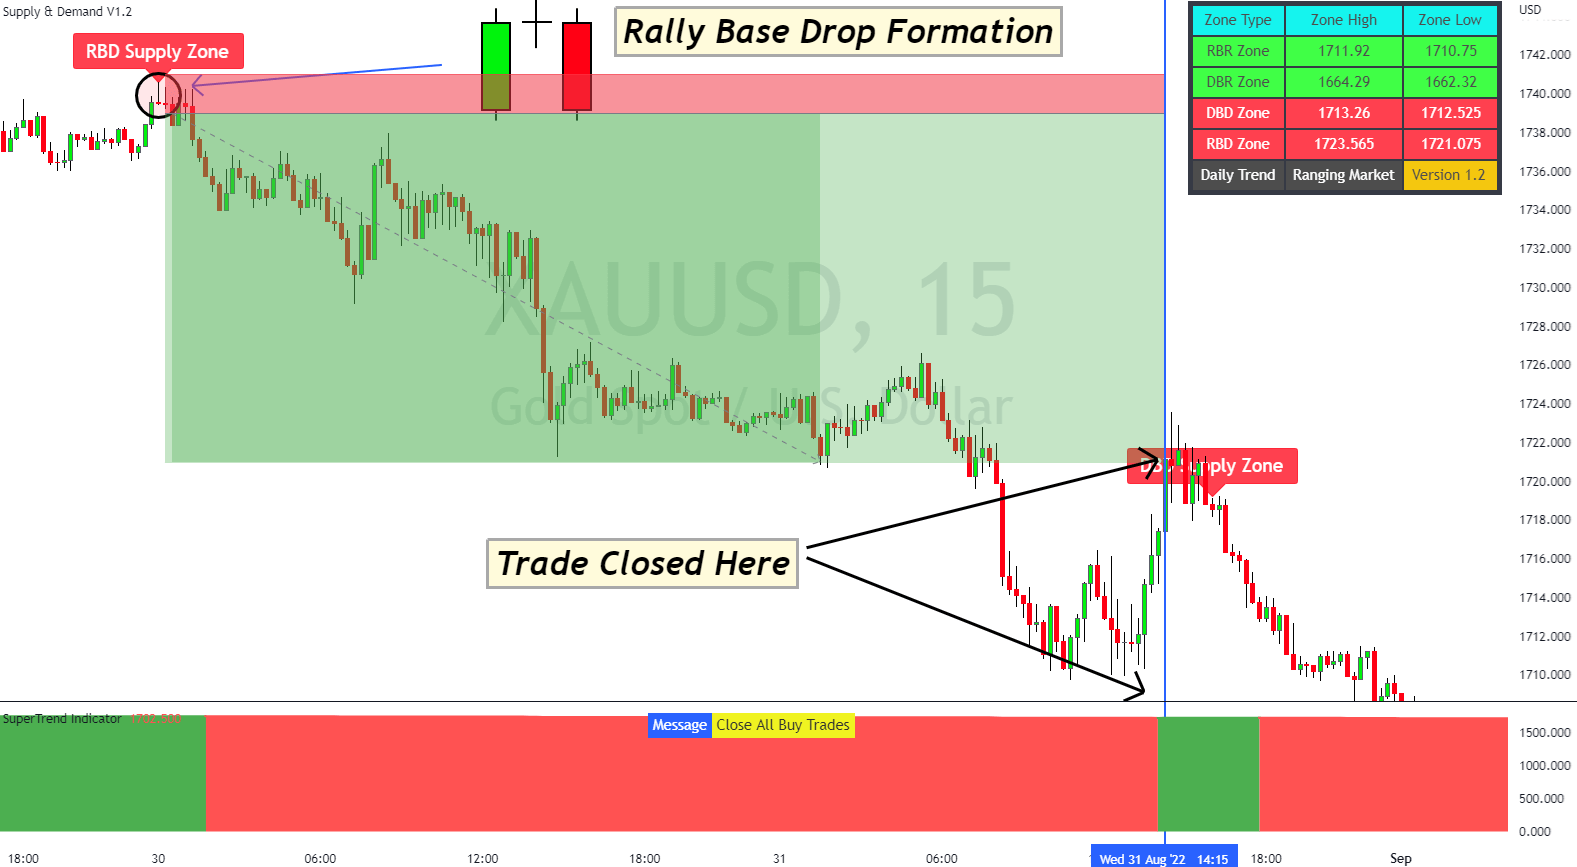
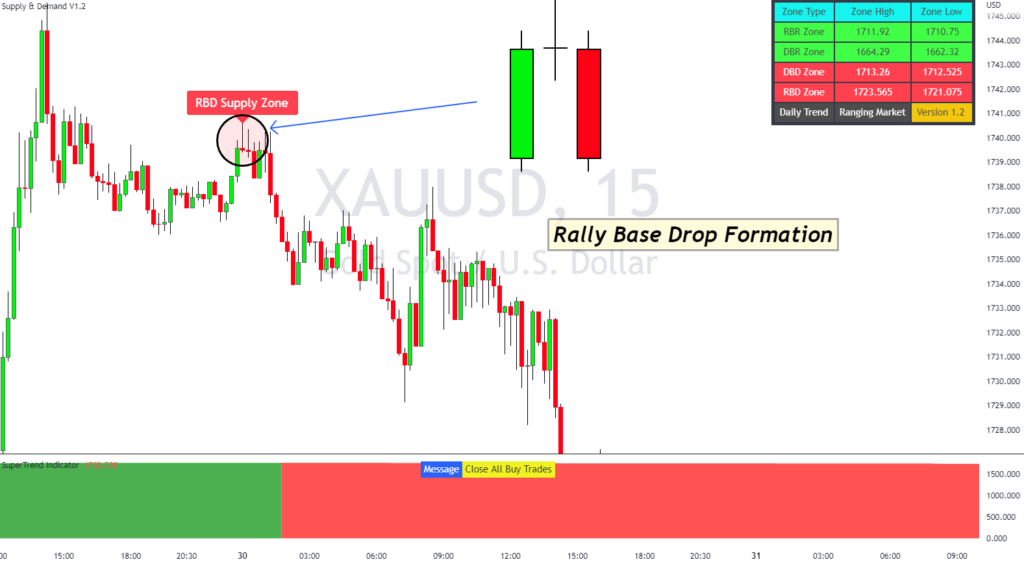
The indicator plots the four zones; rally base rally, rally base drop, drop base rally and drop base drop. These levels identify all the possible supply and demand zones on the chart.
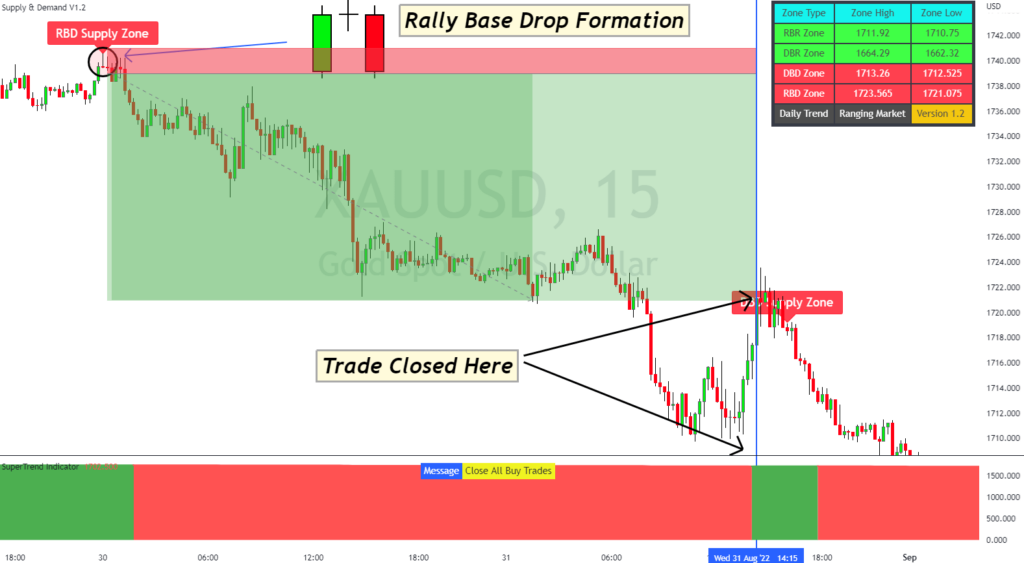
The above chart shows the supply and demand zone indicator. You can see that after the indicator plotted the RBD supply zone, the price dipped.
Here’s how you can trade with the indicator:
Supply and demand zone bullish strategy
- Enter the trade when the indicator highlights a demand zone.
- Place a stop-loss at the recent swing low from the entry point.
- Set take-profit using the psychological indicator.
Supply and demand zone bearish strategy
- Enter the trade when the indicator plots a supply zone.
- Place a stop-loss at the recent swing high from the entry point.
- Set take-profit using the psychological indicator.
2. Order block indicator
Ever heard about order blocks?
Order block is a market phenomenon that reflects the accumulation of orders from banks and institutions.
It is where the order block indicator comes into play. The indicator pinpoints the levels where the institutions and banks are taking positions, thus creating supply and demand zones.
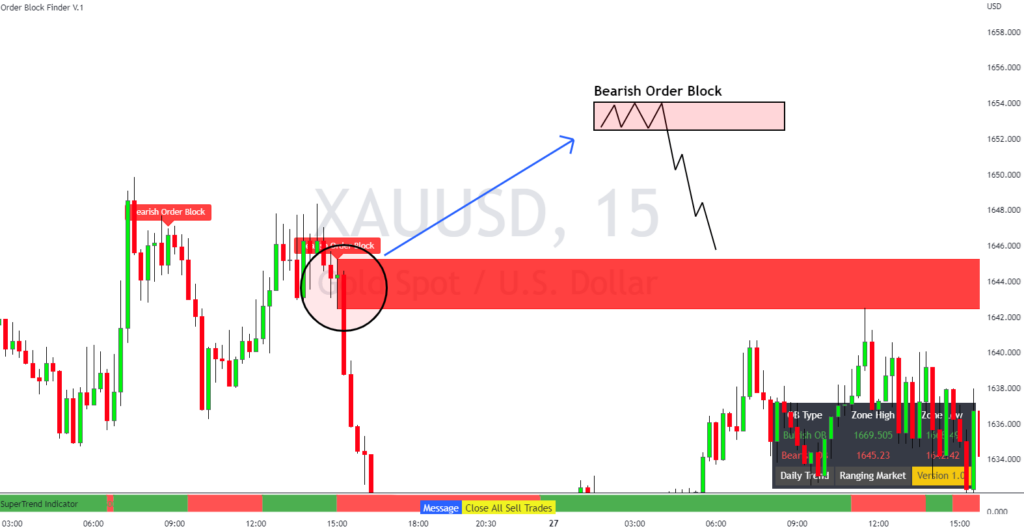
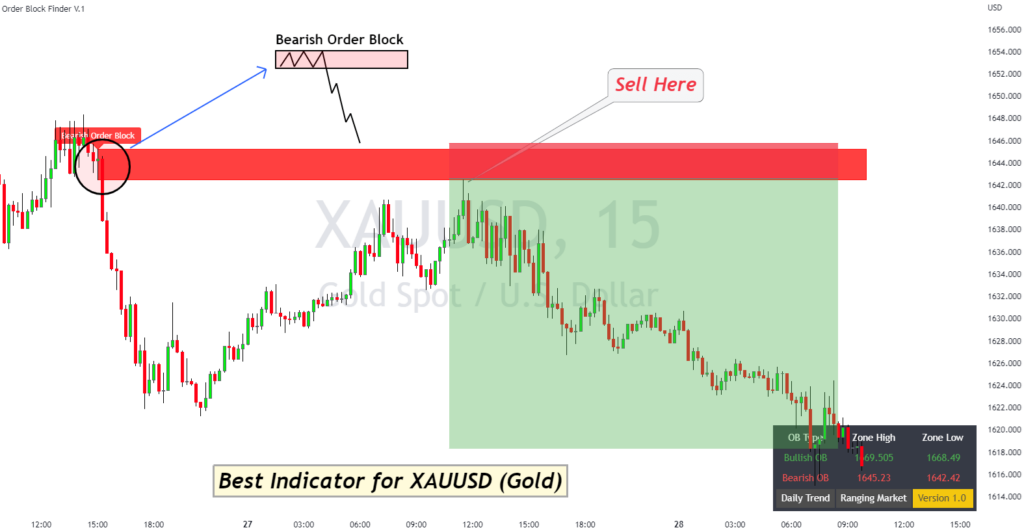
The above chart shows the Order block indicator. Notice how the indicator identified the supply level, and the price dropped afterwards.
Here’s how you can trade with the indicator:
Order block indicator bullish strategy
- Enter the trade when the indicator illustrates the green bullish order block.
- Place a stop-loss at the recent swing low from the entry point.
- Set take-profit using the provided strategy within Orderblock course.
Order block indicator bearish strategy
- Enter the trade when the indicator shows the red bearish order block.
- Place a stop-loss at the recent swing high from the entry point.
- Set take-profit using the provided strategy within Orderblock course.
The bottom line
Choosing the best indicator for gold shouldn’t be a hassle. It should be based on logical reasoning.
The supply and demand and the order block indicators are a perfect fit for gold trading, as they allow you to see what the big fish are doing.
So, you can enter the trade with them and leave when they leave; it’s that simple!
Here’s a quick note; don’t think of these indicators as some Midas touch. They help you bring stability to your trading so you can win more.
FAQs
Which timeframe is best for gold trading?
Although you can do gold trading on every timeframe, it’s best to trade gold on the 4H and above timeframe. The shorter timeframes create a lot of market noise, so it’s better to be on the safer side.
Should you use indicators for gold scalping and day trading?
Yes, you should! Indicators can help you locate the overall market trend. For scalping and day trading, you need quick actions, so indicators can make your trading process much easier.