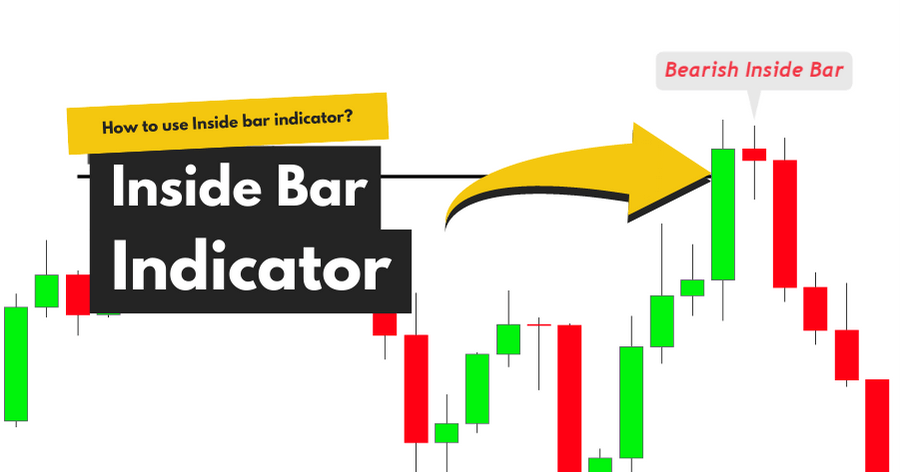
Definition The inside bar indicator is a technical indicator that identifies the inside bar/harami candlestick ...
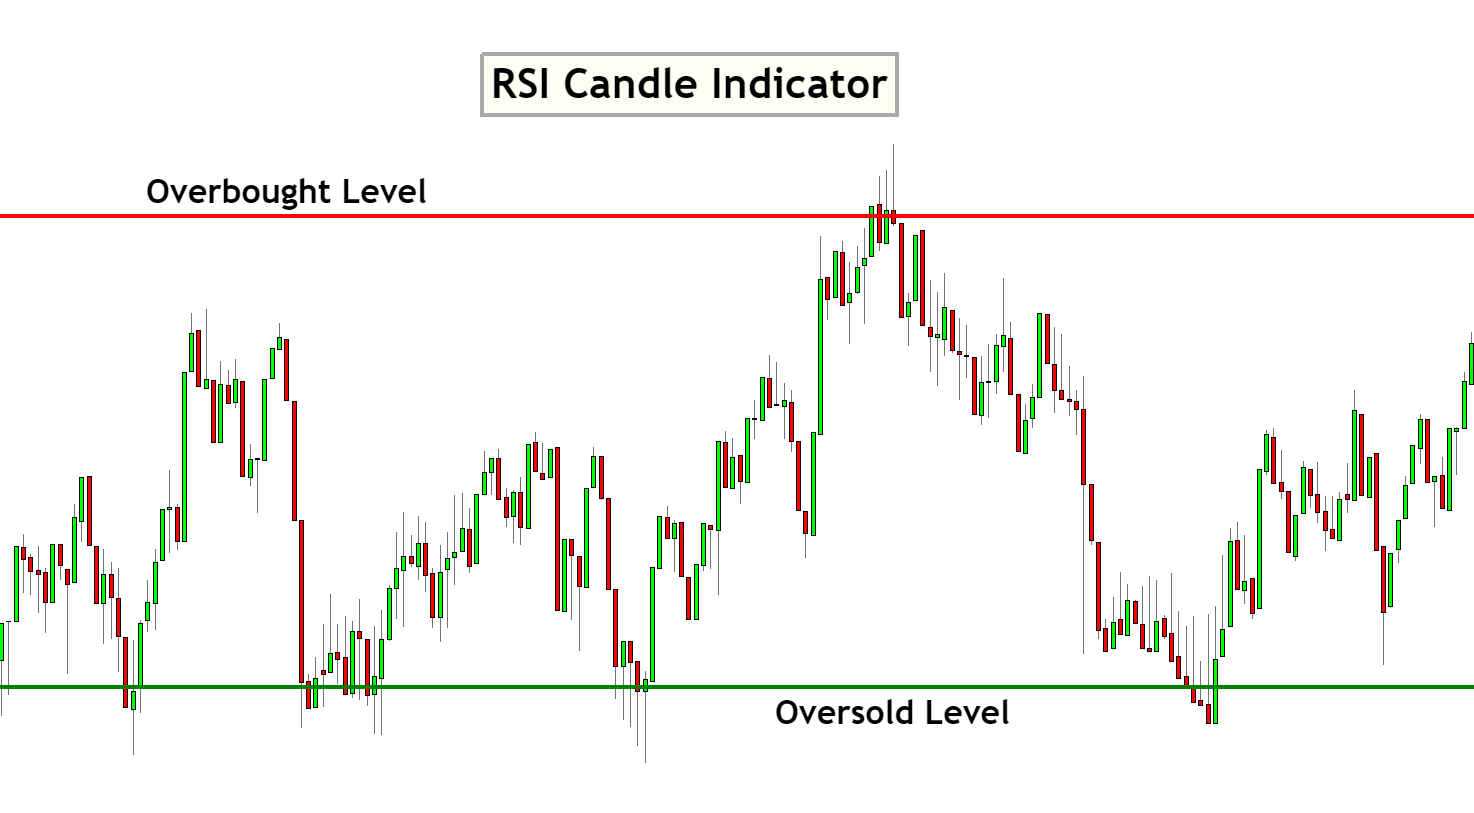
Overview The RSI candle indicator is a technical indicator that calculates the RSI value of ...
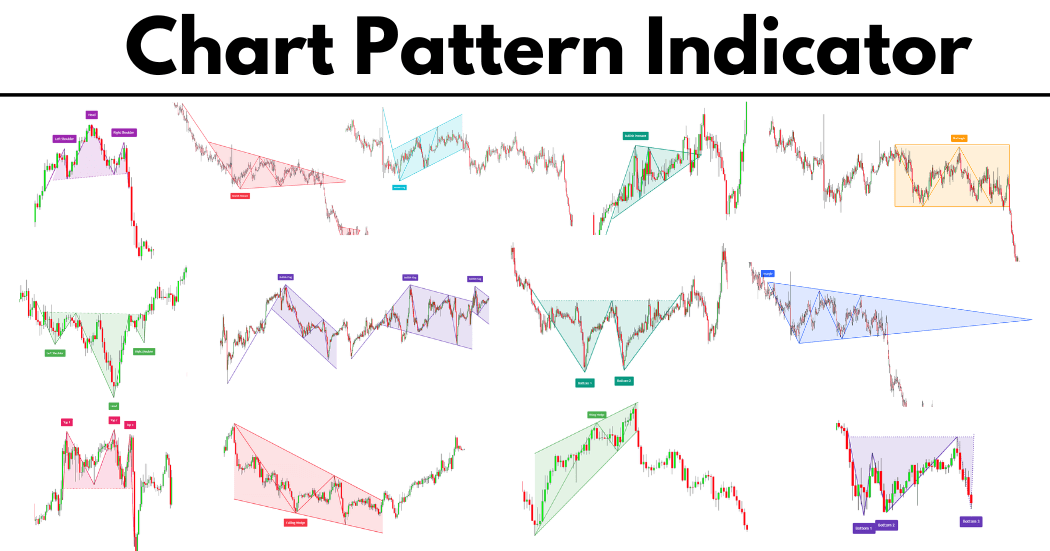
chart pattern indicator is a technical indicator that identifies the chart patterns on the candlestick ...
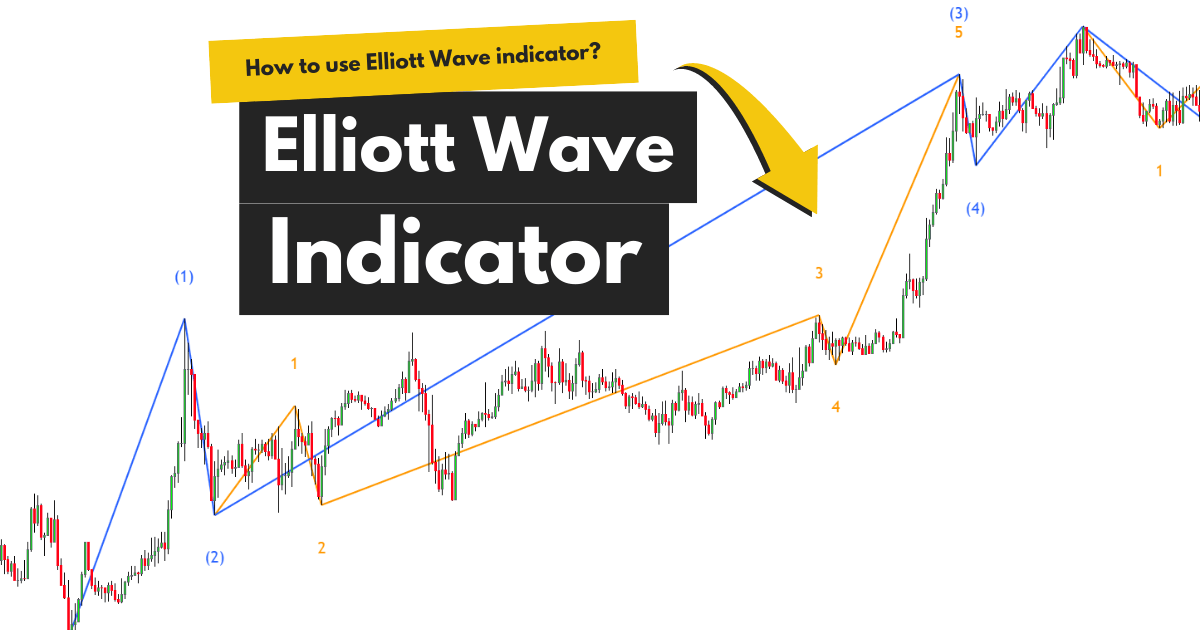
Overview The Elliott wave indicator is a technical indicator that calculates and identifies the five ...
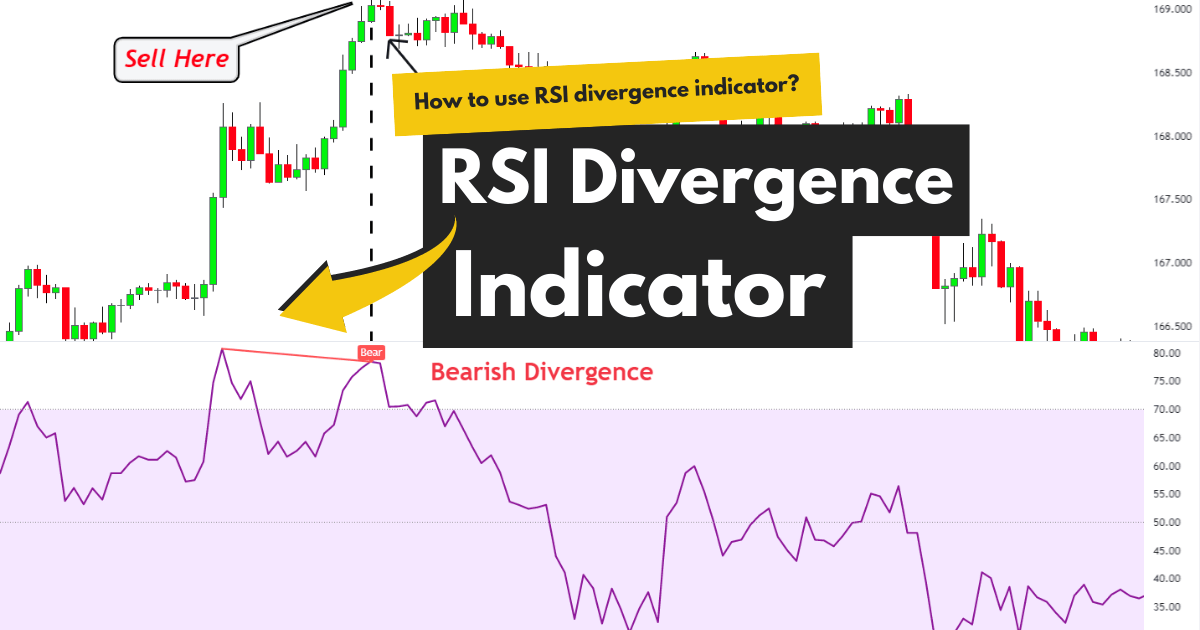
Definition It is a technical indicator that identifies the divergence on the RSI line and ...
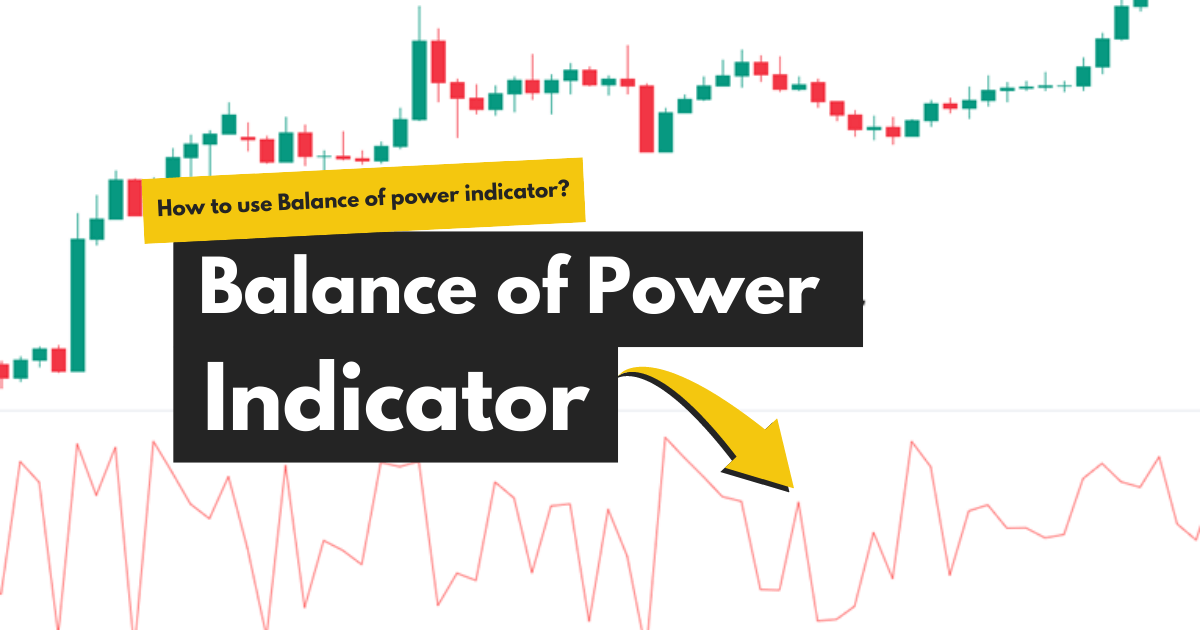
The Balance of Power indicator is a momentum oscillator that tells the difference between buying ...
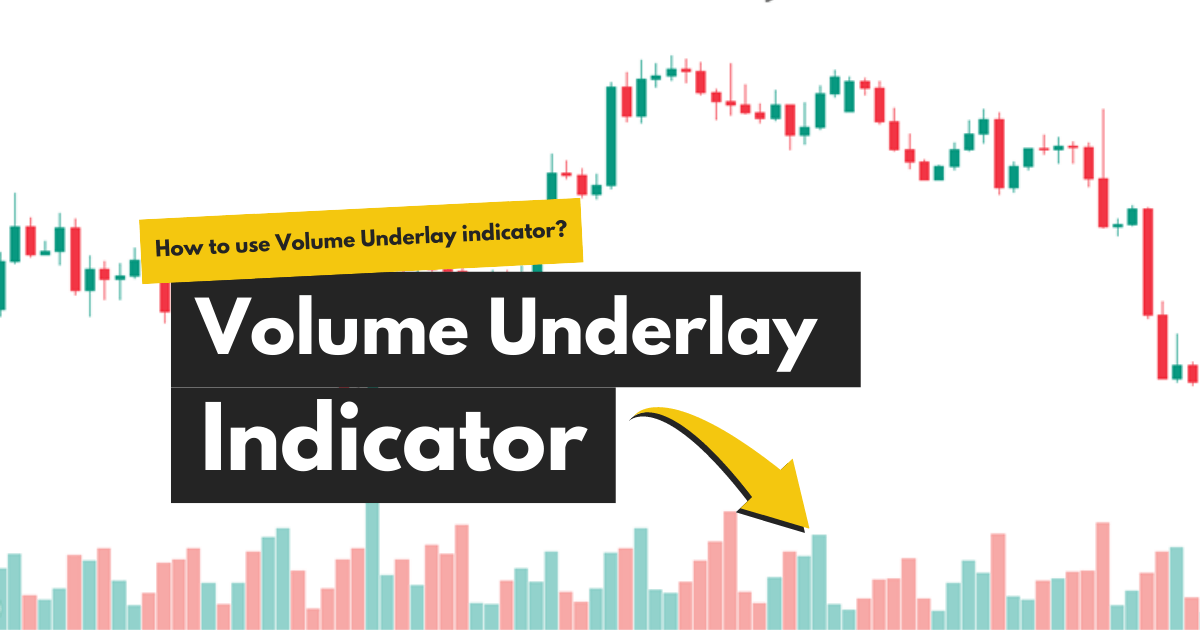
The Volume Underlay indicator, aka Volume indicator, plots volume bars on the chart to illustrate ...
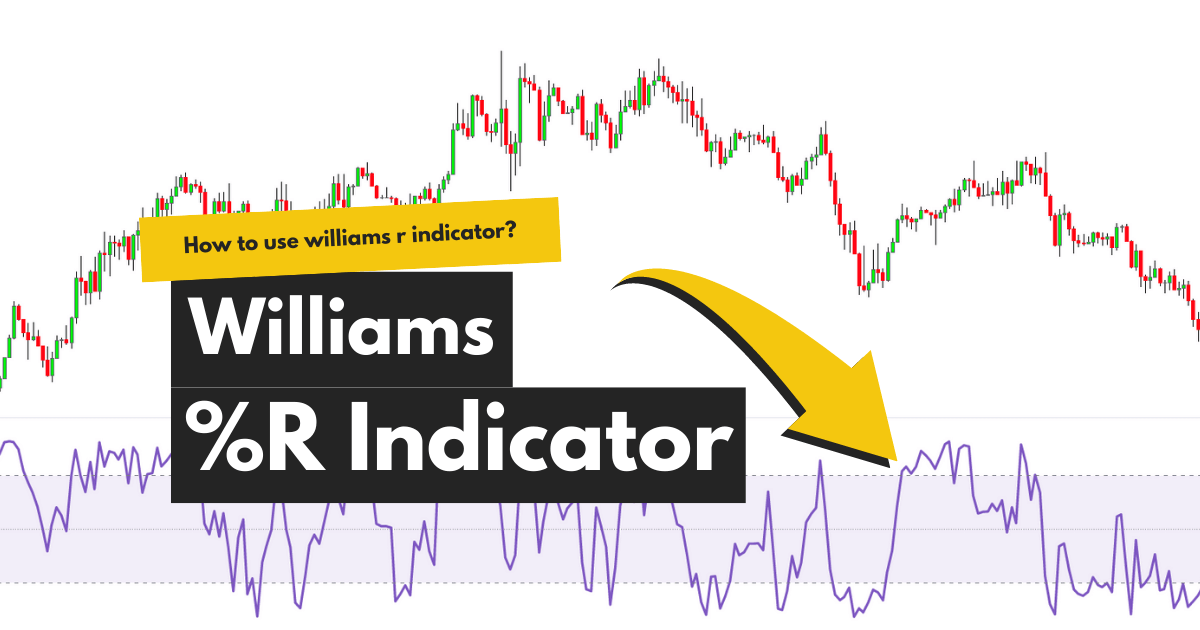
Definition The Williams R indicator is a momentum oscillator that tells the closing price level ...
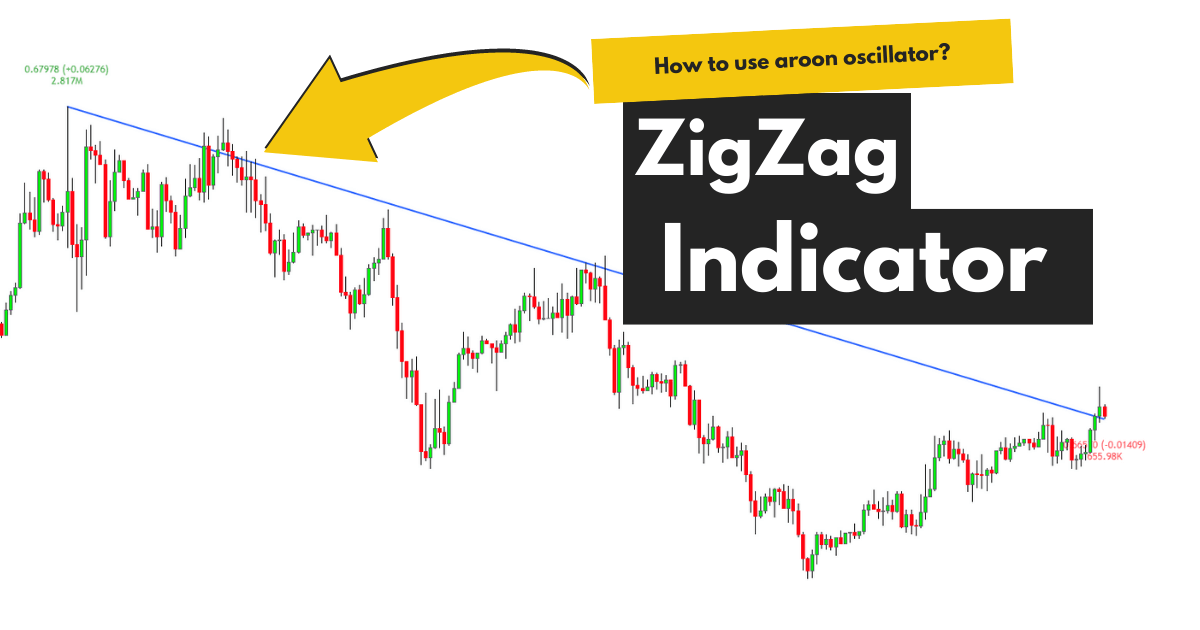
ZigZag is a simple indicator that connects the tops and bottoms to find the price ...