
The Volume Underlay indicator, aka Volume indicator, plots volume bars on the chart to illustrate the buying and selling activity over a specific period.
The bars of the indicator comes in red and green colors. Green bars mention the buying volume, while red bars mark the selling volume.
The Volume Underlay indicator isn’t used alone; you need to combine it with the price action for entering and exiting trades.
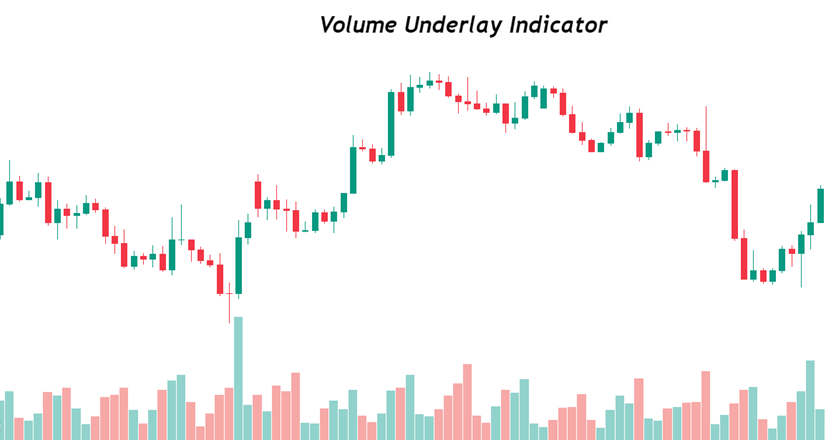
Volume Underlay indicator
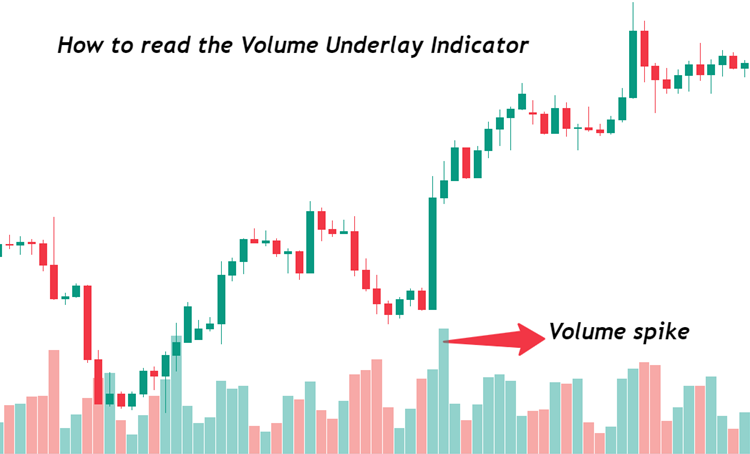
Reading the Volume Underlay indicator isn’t difficult. The red and green bars make it easier to analyze buying and selling pressure. If the indicator makes green bars, it suggests the closing price is higher than the previous close and there is a buying volume.
Conversely, if the indicator makes red bars, the closing price is lower than the previous close, indicating selling pressure.
When reading the Volume Underlay indicator, you’ll often see volume spikes. It indicates there is a lot of buying/selling pressure compared to the previous sessions.
Usually, the Volume Underlay indicator spikes when there is a lot of market volatility, like a news event or the smart money (financial institutions, central banks, and other big players) are placing their trades.
You don’t want to be on the other side of smart money, as you can get stopped out quickly. So, by identifying smart money behavior through the Volume Underlay, you can enter the trades along with them and exit when there is a low volume.
In addition, you can find if there is liquidity. Volume and liquidity are directly related to each other. A high volume means there is high liquidity, and you can quickly enter and exit the trades instead of staying in consolidation.
The good thing about the Volume Underlay indicator is it works on all timeframes. Therefore it is suitable for all types of strategies.
Trading the Volume Underlay Indicator
You can find market trends and price strength with the help of the Volume Underlay indicator. However, you need to combine it with the price to use the indicator in your strategies.
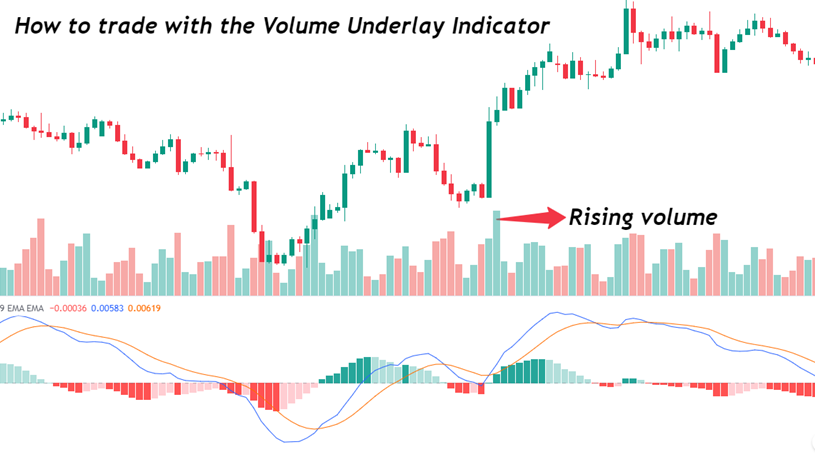
Volume plays a key role in identifying the ongoing trend. If the price and the volume is rising (appearance of green bars), it suggests an uptrend. Conversely, if the price and volume are falling (emergence of red bars), it mentions a downtrend.

In the chart above, you can see after the appearance of red and green bars; there was a trend continuation.
You can also use the Volume Underlay indicator for detecting price reversals.
If the price is moving in an uptrend, but the volume is decreasing, it suggests a possible downtrend in the future. On the other hand, if the price is moving in a downtrend and the volume is decreasing, it’s a sign of a potential reversal.
Volume Underlay indicator can also act as a confirmation when trading with other indicators. If the indicator is showing a trend, but the volume is decreasing, it’s better not to take positions, as it is a sign of possible reversal.
In the chart below, you can see when the MACD pointed to an uptrend, there was an increase in volume, thereby confirming an uptrend.
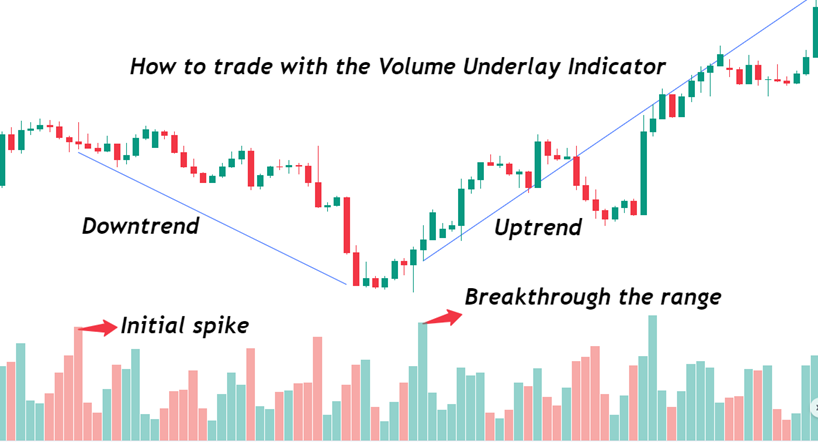
Another way to trade with the Volume Underlay is through a range breakout. After the initial volume spikes, there is a continuation of a trend, and the indicator plots volume bars in a range. However, when the volume bar breaks through this range, it suggests a reversal.
In the chart below, we got an initial volume spike, and the price went downwards. The volume stayed in a range afterward, but once the green bar broke through the range, there was an uptrend.
Advantages
- The indicator is super easy to use.
- You can combine it into multiple strategies.
- It can tell you the behavior of smart money.
Limitations
- The Volume Underlay doesn’t work best on its own.
- The red and green bars don’t necessarily mean a bullish or bearish momentum.
Summary
The Volume Underlay indicator helps in determining the trend’s continuation and reversal. Also, it can help you navigate the behavior of financial institutions, so you can trade along with them rather than trade against them.
You need to combine the Volume Underlay and the price to understand the market trend better.