
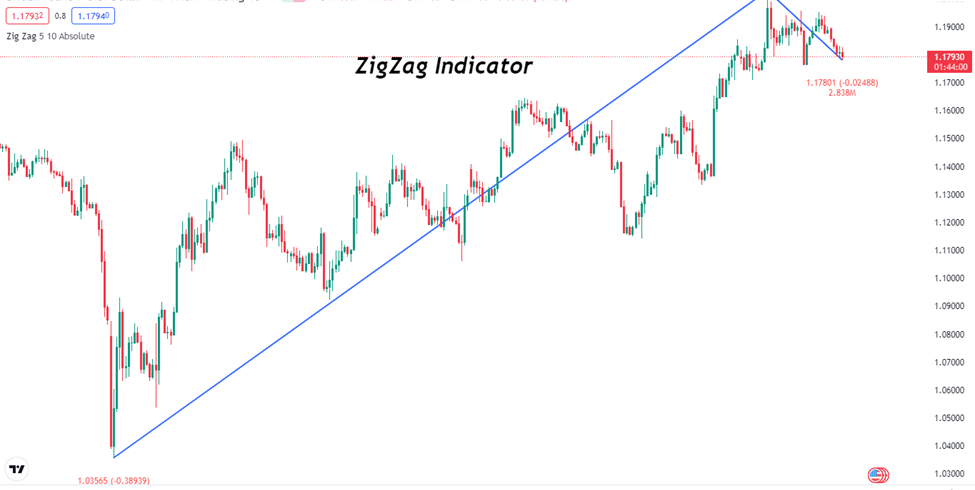
ZigZag is a simple indicator that connects the tops and bottoms to find the price reversal. It identifies key reversal points by removing the small price fluctuations.
Price never moves in one direction; it creates several peaks and troughs. That’s where ZigZag comes into play. It identifies these highs and lows and tells if the market is reversing.
The indicator isn’t a predictive indicator, meaning you can’t enter or exit positions with ZigZag. The indicator reacts only to price moves in a certain percentage.
Best settings for the ZigZag indicator
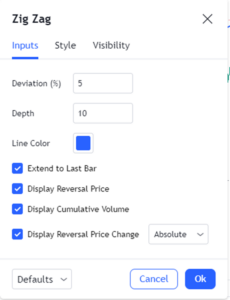
The best settings for the indicator are
| Input Parameters | Values |
|---|---|
| Deviation percentage | 5 |
| Depth | 10 |
| Display Reversal Price Change | Absolute |
To use the indicator, you need to set the percentage of a price move. The indicator comes with a deviation value of 5%. It means that ZigZag will ignore all the price moves below 5% and only show movement greater than 5%.
If you set the higher percentage, the ZigZag can filter out small price moves and pinpoint more accurate reversals.
The depth signifies the number of candles ZigZag won’t make the top and bottom. The default value for the depth is 10.
It’s important to note how ZigZag plot lines on the chart. For instance, there would be no line if the price went from a low of 50 to 59, as it is less than 10%.
Conversely, if the price moves from a low of 50 and makes it to 60, then the ZigZag will plot a line. The ZigZag won’t create another line until the price falls 10%.
As for the timeframe, it’s better to set the indicator on a higher timeframe, as the ZigZag may not be able to note small price moves.
How to trade with the ZigZag indicator?
As mentioned earlier, the ZigZag indicator doesn’t act as a predictive indicator, rather, it acts as a secondary indicator. There are multiple ways to trade with the indicator; trend confirmation, finding support and resistance, and alongside Elliot Wave analysis.
The easiest to use ZigZag is to find out the direction of the trend. The indicator plots line at the beginning of each trend. So by locating the direction of the trend, you can take positions accordingly.
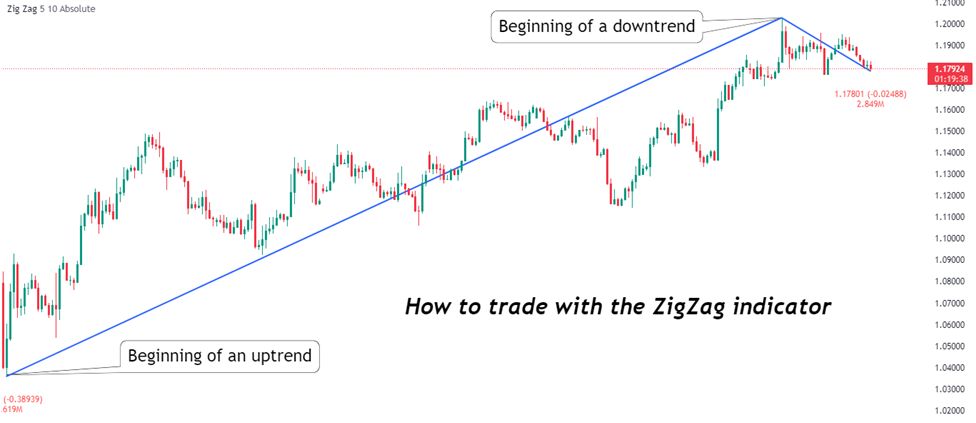
The chart above shows how the indicator plotted the trend line at the start of each move.
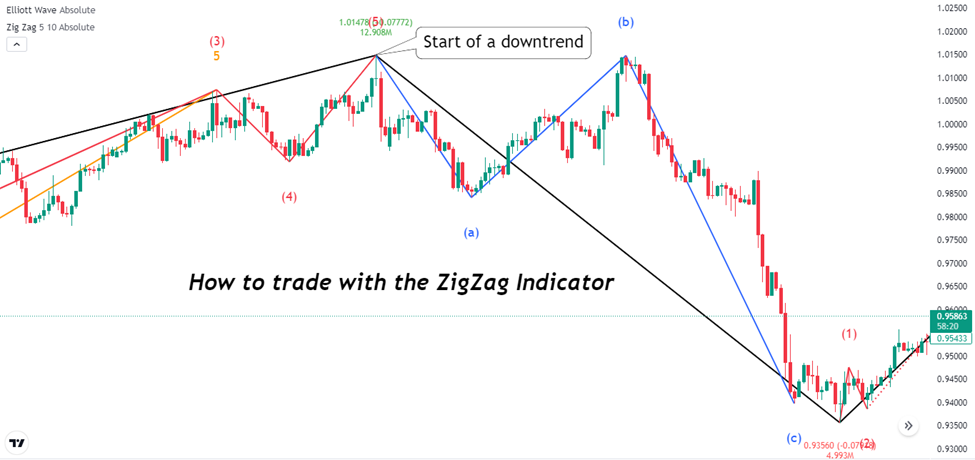
Perhaps the best way to use the ZigZag is with Elliot Wave analysis. The Elliot Wave theory suggests that price moves in five motive and three corrective waves.
The analysis goes well with ZigZag as it confirms the overall trend. If the ZigZag plots a line, and the Elliot Wave analysis points out in the same direction, then it’s a trend confirmation.
In the chart below, you can see the black ZigZag line and blue Elliot Waves. When the Zig Zag plotted the line, there was an Elliot corrective wave, suggesting the start of a downtrend.
The next way to use the ZigZag is to locate the support and resistance levels. These levels act as a market’s high and low. If the price moves toward these levels, there is a chance that the price may bounce.
When the price reaches the support, you buy, and when it reaches the resistance level, you sell. The ZigZag helps locate the top and the bottom, showing the support and resistance level. The top is the resistance level, while the low is the support level.
The above chart shows how easy it is to locate the support and resistance levels with the ZigZag indicator.
There are many other ways to use the ZigZag, like finding the chart patterns along with the Fibonacci extension and retracement levels.
| Advantages | Disadvantages |
|---|---|
| The indicator is relatively easy to understand. | The indicator may not work well on shorter timeframes. |
| It detects exact market reversals. | You can’t use the indicator solely; you have to combine it with other forms of technical analysis. |
| You can use ZigZag in multiple trading strategies. |
Summary
The ZigZag indicator helps in determining key market reversals. It is a useful indictor that combines well with other forms of technical analysis. Make sure to set the deviation above 5% as the indicator may not work properly below this level.
On the Tradingview, the indicator works only on timeframes 1H or above.