Definition
A 4H trading strategy includes a trend trading system made up of three moving averages and candlestick patterns on the 4-hour timeframe.
This is a winning trading system if you will trade with proper risk management. Due to the large four-hour timeframe, it is very easy to follow this trading system. An intermediate trader will be able to understand this 4h forex trading strategy easily.
In this article, we will explain a simple but the best forex trading strategy
Components of the 4H strategy
This trend trading system is made up of two components. Each component has been used for a particular purpose to make a winning system.
- Component 1: Three moving averages
- Component 2: Two candlestick patterns
Types of moving averages used in strategy
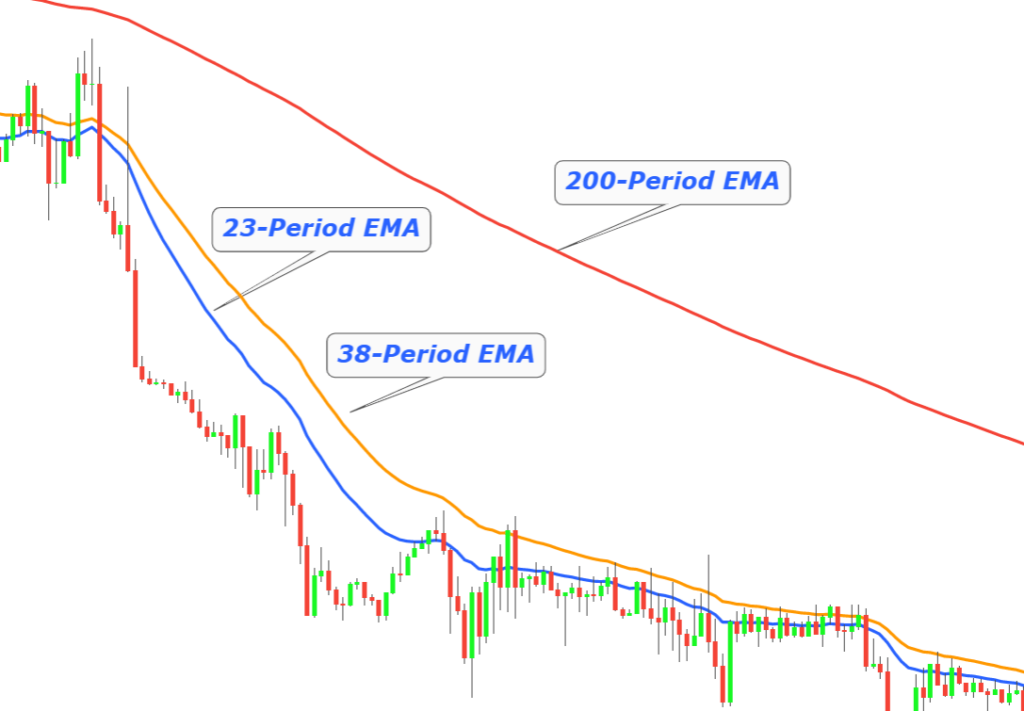
Exponential moving averages are used in this trading strategy with different periods.
- 23-period exponential moving average
- 38-period exponential moving average
- 200-period exponential moving average
Candlestick patterns used in trading strategy
Two major candlestick patterns are used in this strategy to confirm the trade entry.
- Bullish/bearish Pin bar candlestick
- Bullish/Bearish Engulfing pattern
What is the purpose of using moving averages in strategy?
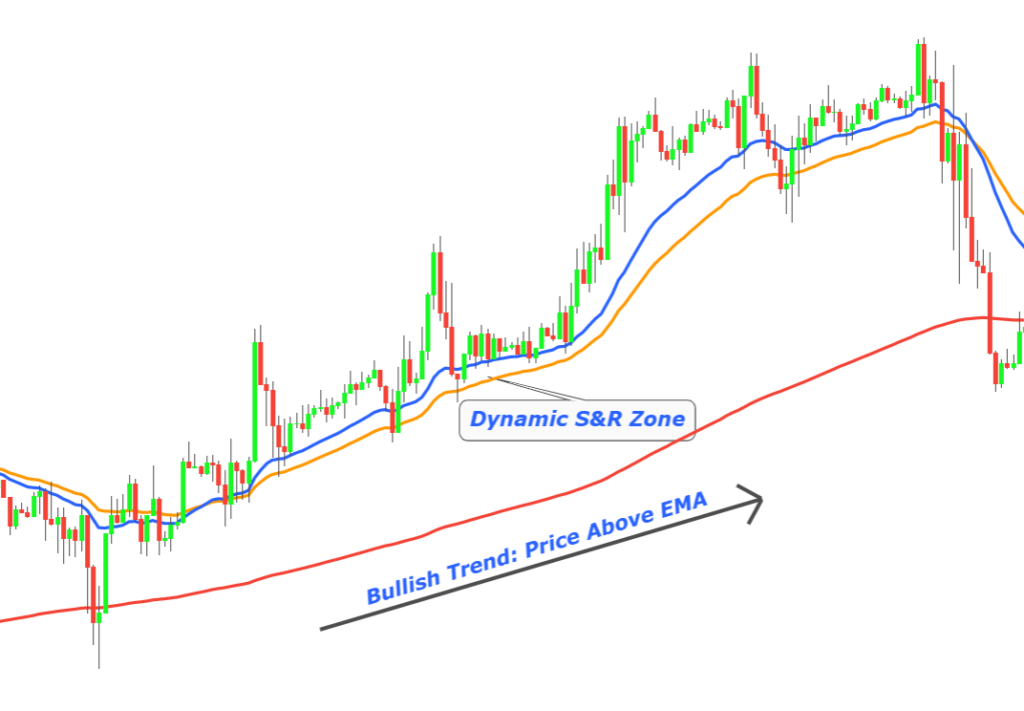
Moving averages are used to identify the trend and dynamic support/resistance zones on the price chart.
200-period moving average acts as a trend filter of a specific currency pair/stock.
23 & 38-period moving average acts as dynamic support or resistance zone.
Dynamic S&R zones work in the same way as horizontal S&R zones. Price mostly bounces from these zones. That’s why we will use this action of price in our trading strategy with the confluence of the candlestick pattern.
Find High Probability Trades with this ADVANCED Candlestick Patterns Course
The Ultimate Candlestick Patterns Course That Will Help You To Trade Better
What is the purpose of using candlestick patterns in strategy?
Candlestick patterns are used to confirm a trend reversal of an asset in trading.
For example, the price will bounce from a support zone, but it will not happen each time because sometimes the price will break the support zone. So, to confirm a price bounce/trend reversal from a support zone, we will wait for a bullish candlestick pattern at the support zone. This addition of a candlestick with a support zone will increase the probability of trend reversal.
How to trade using the 4H strategy?
A trading strategy consists of specific rules you need to follow to become a successful trader.
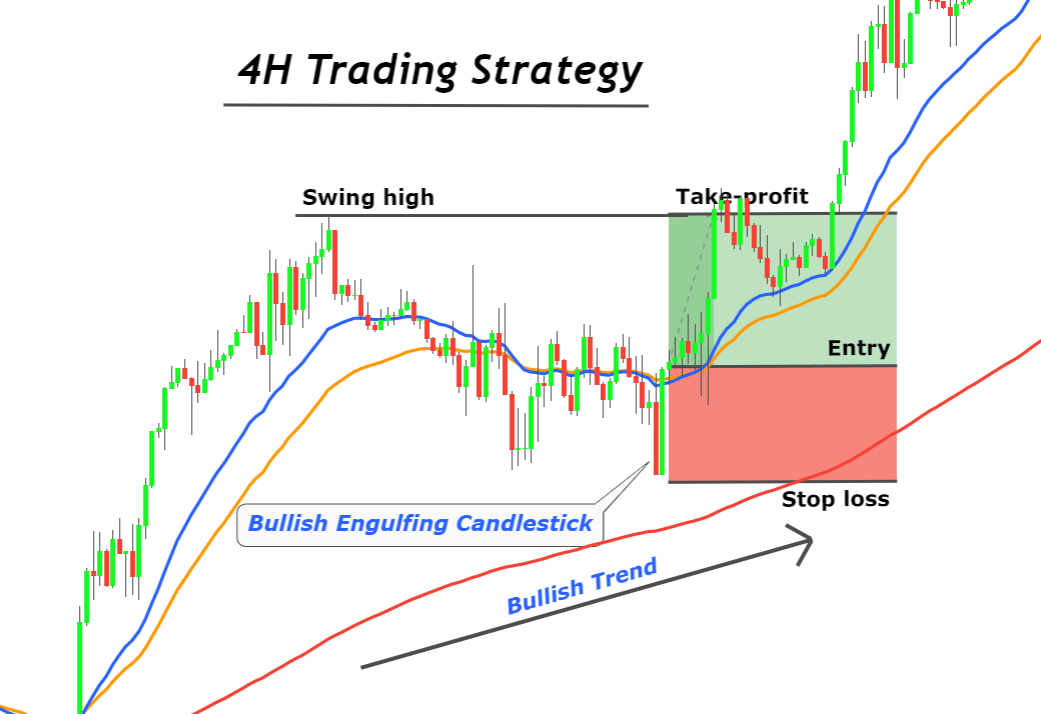
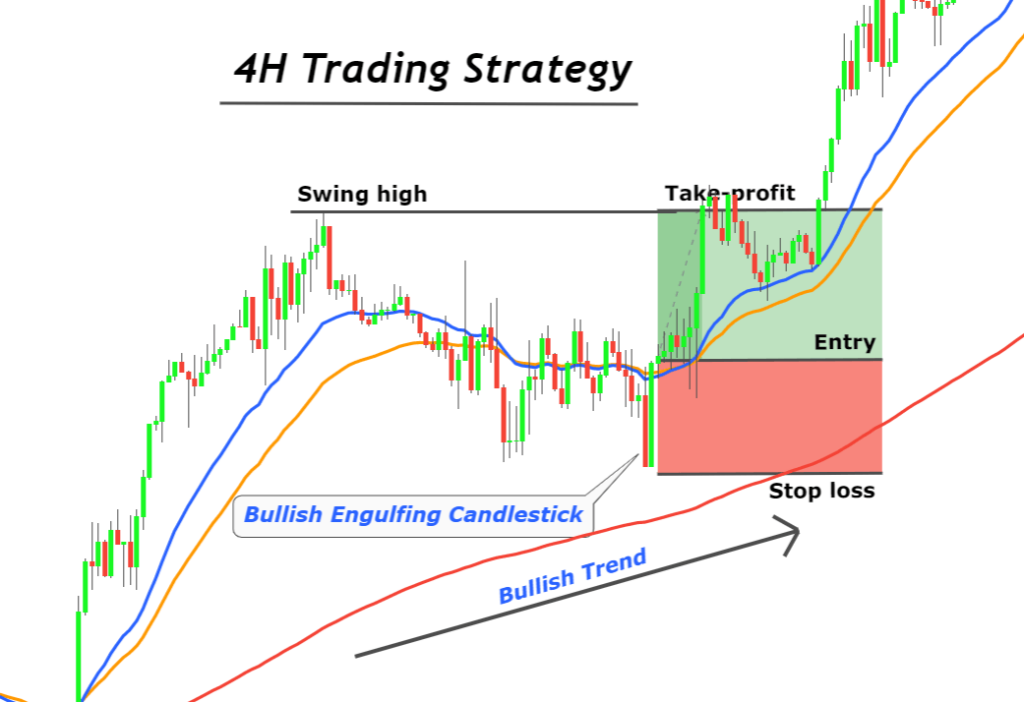
Bullish trade setup
To open a buy order, follow the following conditions on the 4-hour timeframe.
- Step 1: Identify the direction of the 200-period EMA. It should indicate a bullish trend and must be below the price.
- Step 2: Find out a bullish pin bar or bullish engulfing candlestick rejecting the dynamic support zone (23 & 38 EMAs). The price must reject 38 EMA.
- Step 3: Open a buy order after candlestick confirmation and place stop loss a few pips below the low of the candlestick. The last swing high of a price will act as a take profit level. You can also use Fibonacci extension levels to extend take profit level.
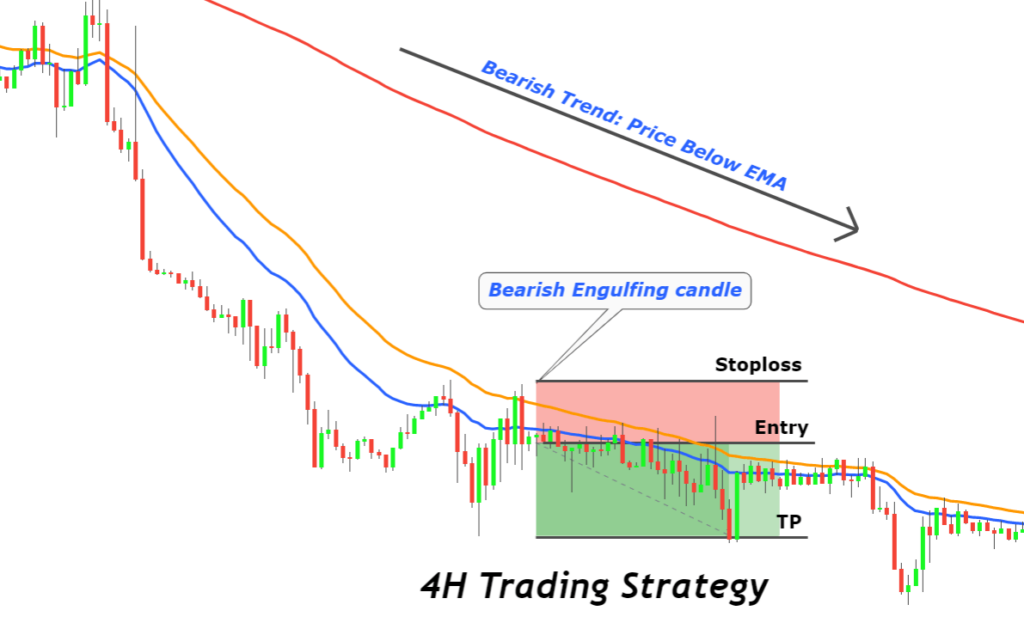
Bearish trade setup
To open sell order, follow the following conditions on the 4-hour timeframe
- Step 1: Analyze the 200 periods EMA and it should indicate a bearish trend. During a bearish trend, 200-period EMA will form above the price.
- Step 2: Look for a bearish pin bar or engulfing candlestick rejecting the dynamic resistance zone (23 & 38 EMAs).
- Step 3: Open a sell order after candlestick confirmation and place stop-loss a few pips above the high of the candlestick. The last swing low of the price will act as a take profit level. Fibonacci extension levels can also be used to increase the risk-reward ratio.
Pro Tip: The risk-reward ratio should always be greater than 1 in this 4H trading strategy. You should skip a trade setup with a risk-reward ratio below 1.
Rules of 4h strategy
You must follow and remember the following simple rules.
- Rule 1: you should trade only in the direction of a higher timeframe trend. For example, if 200 period EMA is showing a bearish trend, then you should look for sell opportunities on the chart.
- Rule 2: Candlestick pattern must reject both EMAs (23 &38 periods).
4H Candlestick close timing Table
Here is the table for candlestick closing price on the 4-hour timeframe for different regions.
| New York | 5:00 PM | 9:00 PM | 1:00 AM | 5:00 AM | 9:00 AM | 1:00 PM |
| Central Time | 4:00 PM | 8:00 PM | 12:00 AM | 4:00 AM | 8:00 AM | 12:00 PM |
| Pacific Time | 2:00 PM | 6:00 PM | 10:00 PM | 2:00 AM | 6:00 AM | 10:00 AM |
The Bottom Line
The 4-hour trading strategy is a simple trading system, but you will get a few signals in a month. If you manage to profit 5% to 10% in a month consistently then you are a successful trader. Because after applying compounding strategies, you will be able to generate passive income after 6 to 8 months.
Don’t forget to backtest this trading strategy before trading on a live account.
If you don’t know the method to backtest then visit here.


