
This article is about a simple forex Pennant pattern that is widely used in forex technical analysis. Chart patterns help us to predict the price movement. These are simple natural patterns, not mathematical indicators. I always encourage to use chart patterns to predict price movement.
The best thing about the Pennant chart pattern is that it forms in the direction of the trend, and it is always traded in the direction of the trend. So, this pattern has a high probability of winning.
I will explain psychology (means why you should use this in technical analysis), and a simple strategy at the end of the article.
Pennant Pattern
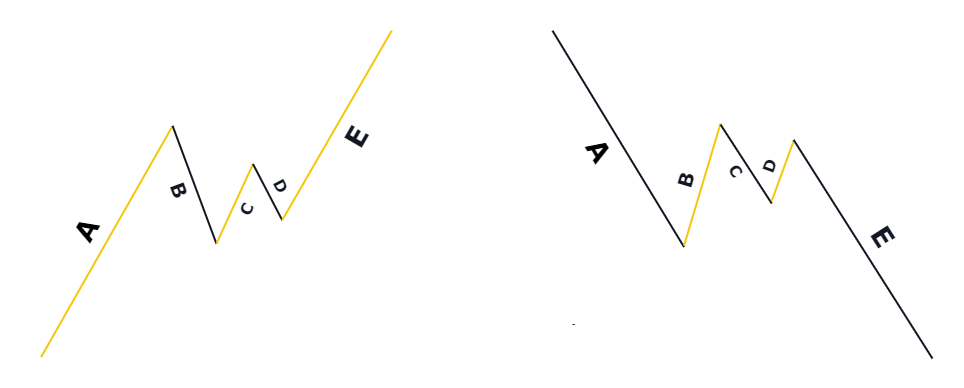
Pennant chart pattern refers to a trend continuation chart pattern. It indicates the trend will continue. it consists of 5 waves (ABCDE).
It is a trend continuation pattern. For example, if the trend is bullish and it forms then the bullish trend will continue until another reversal sign.
Rules of Pennant pattern
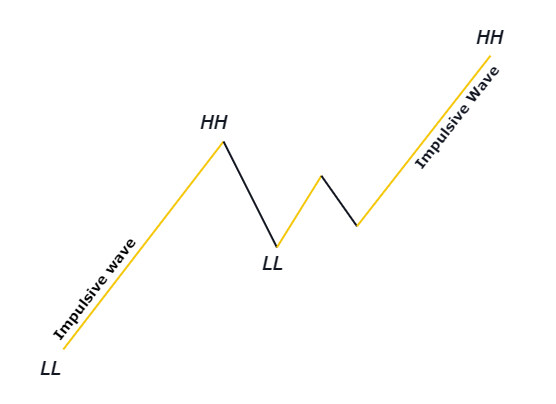
- Wave A must be an impulsive wave
- Wave B must form within the high and low of wave A. it should not retrace below 61.8 Fibonacci of Wave A. Because if Wave B retraces below 61.8 then it indicates a weak trend.
- Wave C must form within the high and low of wave B.
- D wave must form within the high and low of Wave C.
- Wave E is the resultant wave.
it is divided into two types
- Bullish Pennant pattern
- Bearish Pennant pattern
Bullish Pennant pattern
In the case of the Bullish Pennant pattern, Wave A must form a Higher high and higher low. Simply trend will be bullish. Wave A indicates bullish impulsive move. Remember Wave A must be an impulsive wave (not a retracement wave). The remaining rules will be the same.
Look at the graphical image of bullish Pennant pattern trading.
Bearish Pennant pattern in trading
In the case of a bearish chart pattern, Wave A must form a lower low and lower high. Lower low and lower high indicate a bearish trend. Wave A indicates a bearish impulsive move. Remember Wave A must be an impulsive move. This step is necessary to follow because it shows the strength of a trend. Strong strength means higher chances of winning in a trade.
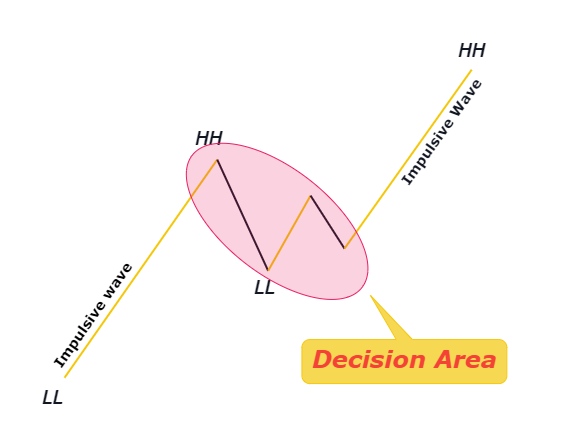
Psychology of pattern
its psychology is very simple. After an impulsive wave (price movement due to institutional traders), the price decides its direction, either to continue the trend or to reverse the previous trend. As there are higher chances of continuation of trend because of impulsive wave A and a trendline breakout. After the break of trendline or wave D (low or high of wave D) in the direction of trend only, big traders show a sign of continuation of the trend.
Simply this pattern shows the decision taken by institutional traders.
How to trade pennant pattern
In the strategy, I will also add Fibonacci tool.
- To extend take profit level
- To check the strength of the trend
In the case of the bullish pattern, after the formation of wave D, we will draw a trendline that will approximately touch the highs of wave A and wave C.
Now in the next step, wait for a breakout of trendline and high of wave D. breakout of trendline and high of wave D is confirmation for trade entry.
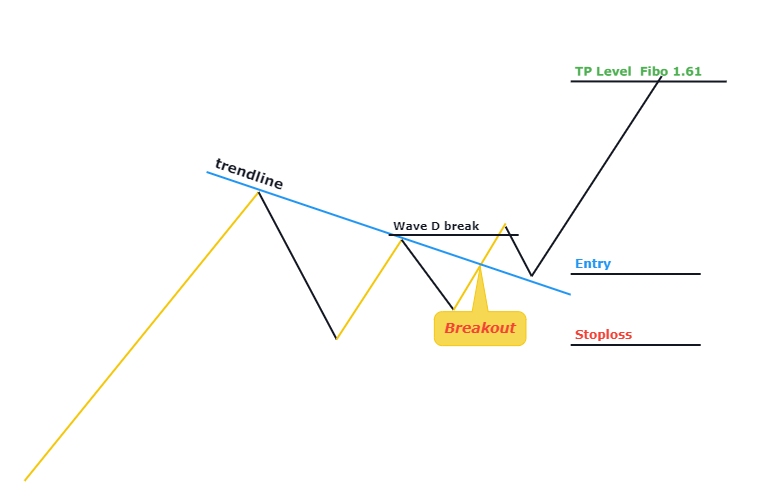
There are two options after getting confirmation for trade entry, either to enter in the trade just after breaking of wave D or after the break wait for a retest of trendline and the entry of pin bar or engulfing candle on the trendline.
Stop loss level will be always below the low of wave B.
Take profit level 1 will be at the high of wave A. Take profit level 2 will be at fibo 1.618 of wave B.
Chart Patterns are natural patterns
forexbee
I hope you will like this Article. For any Questions Comment below, also share by below links. Use Tradingview for technical analysis instead of mt4.
Note: All the viewpoints here are according to the rules of technical analysis and for educational purposes only. we are not responsible for any type of loss in forex trading.