

The diamond pattern in trading is a reversal chart pattern in which the market forms a pattern like a diamond that predicts an upcoming reversal in the trend of price.
The diamond pattern in trading also represents that market is looking for a direction it means the price is in the range. When the breakout of this pattern will happen, then a trend reversal will come. It is a rare chart pattern, but it has a high winning probability if traded with confluence.
This chart pattern will work in all the markets like stocks, forex, and cryptocurrency because it is a natural pattern or natural behaviour of markets.
Identify diamond pattern in trading
Diamond chart pattern in trading forms by a combination of two chart patterns
- Broadening pattern
- Inside pattern
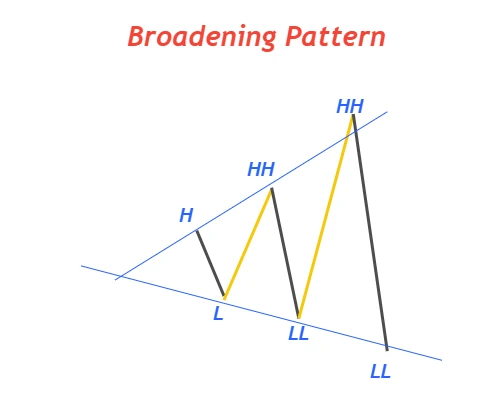
In phase 1, the market will form a broadening pattern like starting from one point and then keep on broadening with time. look at the image for a clear view.
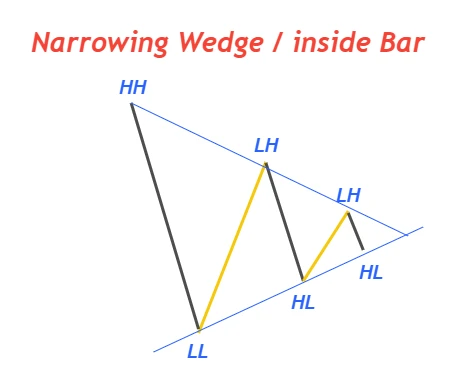
In the second phase, the narrowing wedge will form like beginning from a wide wave into a single point. It is the reverse of the broadening pattern.
After combining phase 1 and phase 2, A diamond pattern will form. This is an ideal way to identify a chart pattern in trading by technical analysis method. Like in the image shown below.
How to draw a diamond structure?
A diamond pattern consists of four sides in the front view. So, we will draw four trendlines upward and downward to complete the diamond chart pattern.
Draw two trendlines from starting point to outward meeting the swing highs and swing lows of waves. Now draw the other two lines from maximum high and maximum low to inward side meeting the swing highs and swing lows until both lines intersect each other.
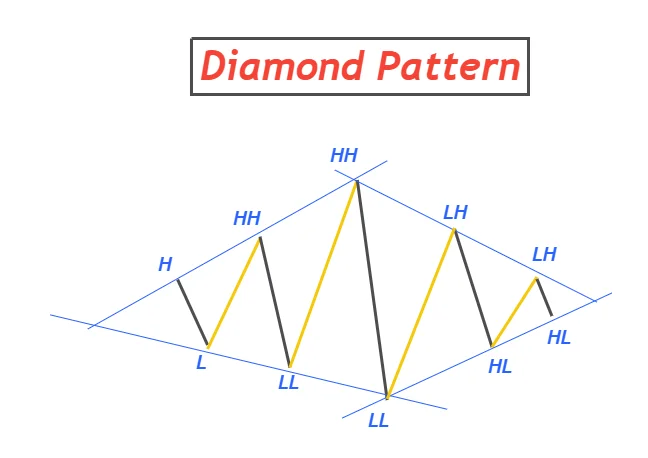
By following this procedure, you will get a diamond-like shape on the candlestick/line chart.
Remember: you must adjust the trendlines accordingly. Candlestick wicks can be ignored if necessary but candlestick closing price is important.
Types of Diamond pattern
There are two types of the diamond Chart pattern. The pattern will remain the same unlike other chart patterns in both cases, but the location and formation make difference between them.
- Bullish Diamond pattern / Diamond Top
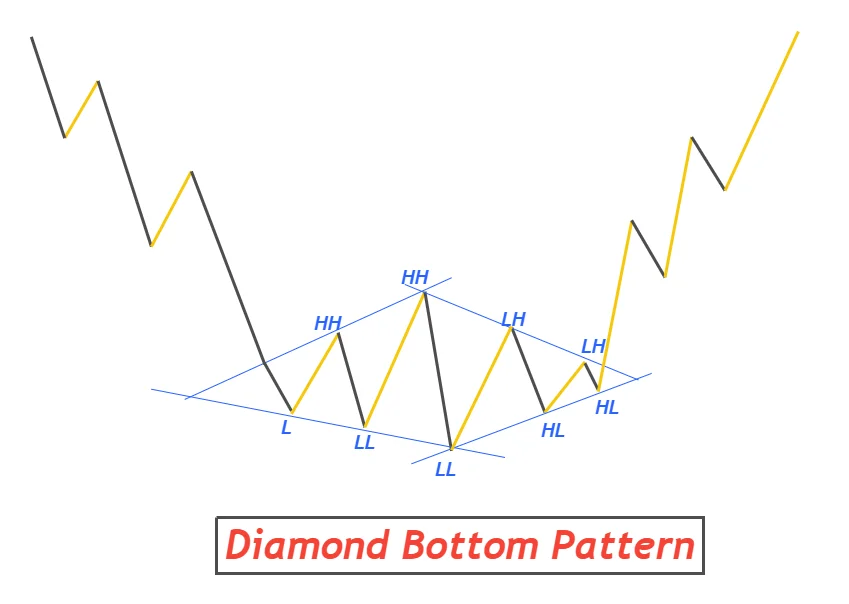
- Bearish Diamond pattern / Diamond bottom
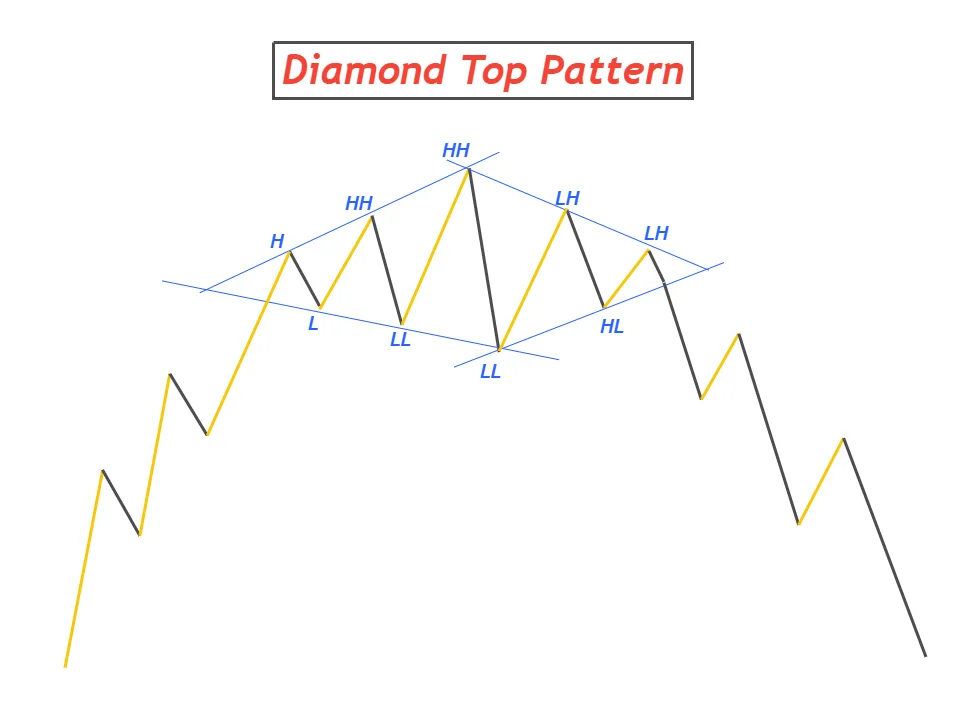
Bearish Diamond pattern in trading
To identify this pattern, look for the location and starting point of the pattern. If pattern forms in the overbought condition/after uptrend and the pattern starts just after a bullish wave/impulsive move, then it will be termed as a bearish diamond pattern in trading.
Follow the following parameters to identify patterns correctly
- Overbought condition
- Forms just after bullish impulsive wave
- No sideways movement
Bullish Diamond pattern in trading
The formation of a diamond chart pattern in oversold condition and just after bearish trend / bearish impulsive move will be termed as a bullish diamond pattern. It signals a reversal of the bearish trend into a bullish trend in technical analysis.
To get the diamond pattern with a high winning ratio, follow the following parameters
- Oversold condition
- Forms just after bearish impulsive wave
- Mo sideways movement before diamond pattern formation
Remember, the formation of diamond patterns in the ranging/sideways market will be a wrong reversal signal. It will not work in the sideways market also it does not make any sense.
Breakout of Diamond pattern
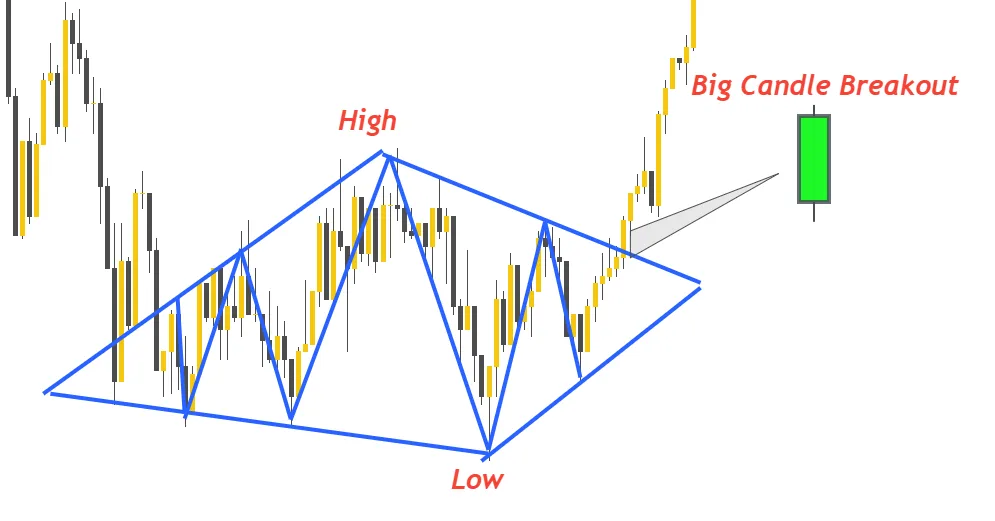
After identifying a good diamond pattern, avoiding false breakout is also important. A false breakout is a very old and best strategy that market makers use to hunt stop the loss of retail traders.
Follow the Big candle rule. Big candle means the wicks of breakout candle must be very small and body of candle must be larger than few previous candlesticks.
If you will backtest your strategy 100 times, then you will be able to identify false breakouts easily and you will prefer to wait for a clear view.
How to trade diamond chart pattern?
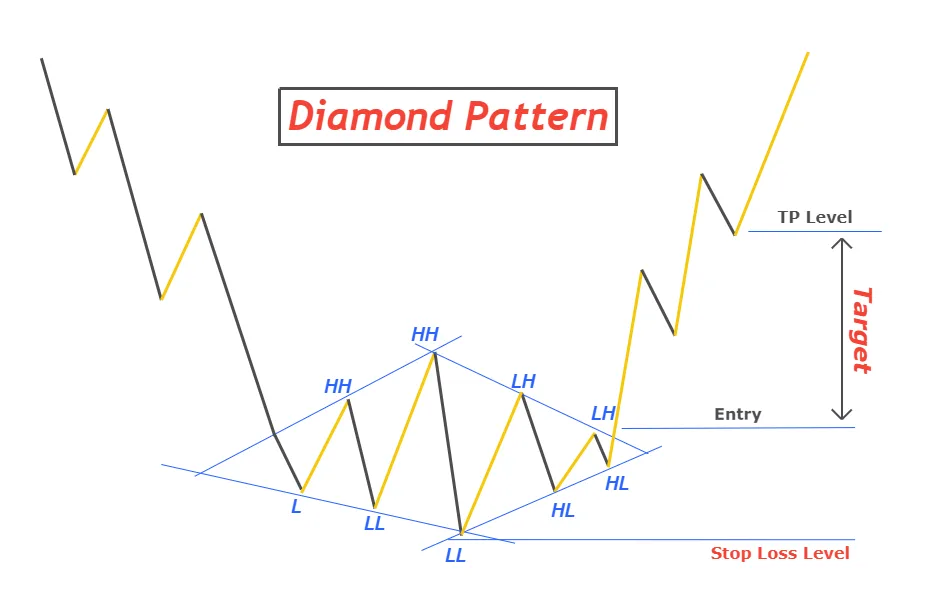
To trade a chart pattern, three parameters (entry, stop loss, take profit) are measured.
Entry
Trade entry will be just after the breakout of the diamond pattern with a big candlestick.
- Sell a security on close of big bearish breakout candlestick in case of diamond top.
- Buy a security on close of big bullish breakout candlestick in case of diamond bottom.
Stop loss
Place stop loss above the high of the diamond top and keep it below the low in case of the diamond bottom.
Take profit
Take profit level is projected based on the difference of distance between low and high of the diamond chart pattern. For example, if the distance between low and high is 100 pips then take profit level will be 100 pips away from the breakout of the diamond pattern.
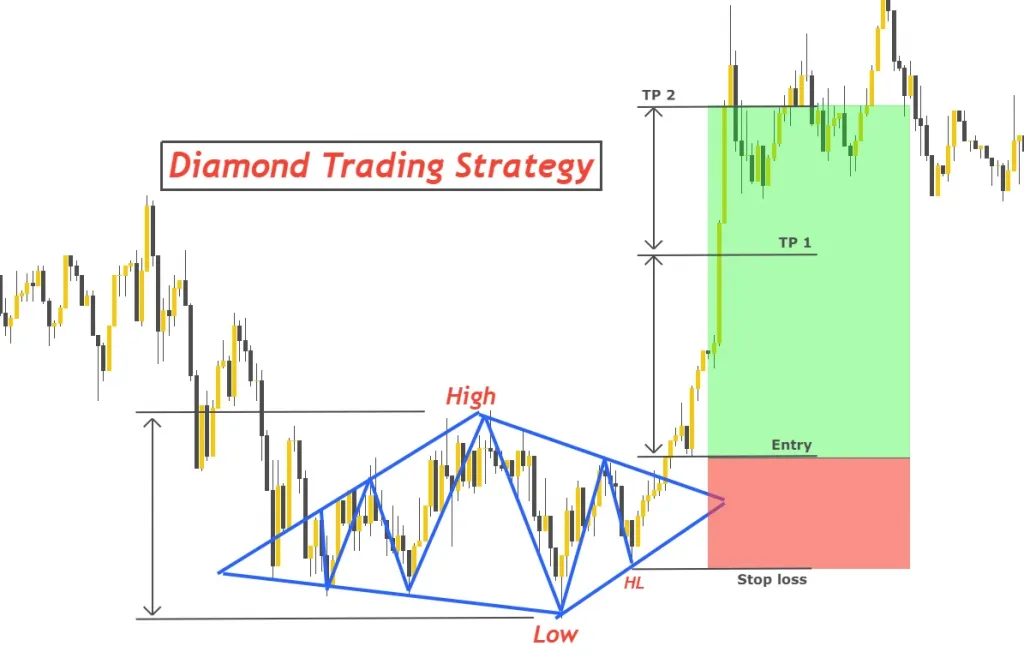
Now let’s move to the main and final heading of this topic that is a diamond trading strategy.
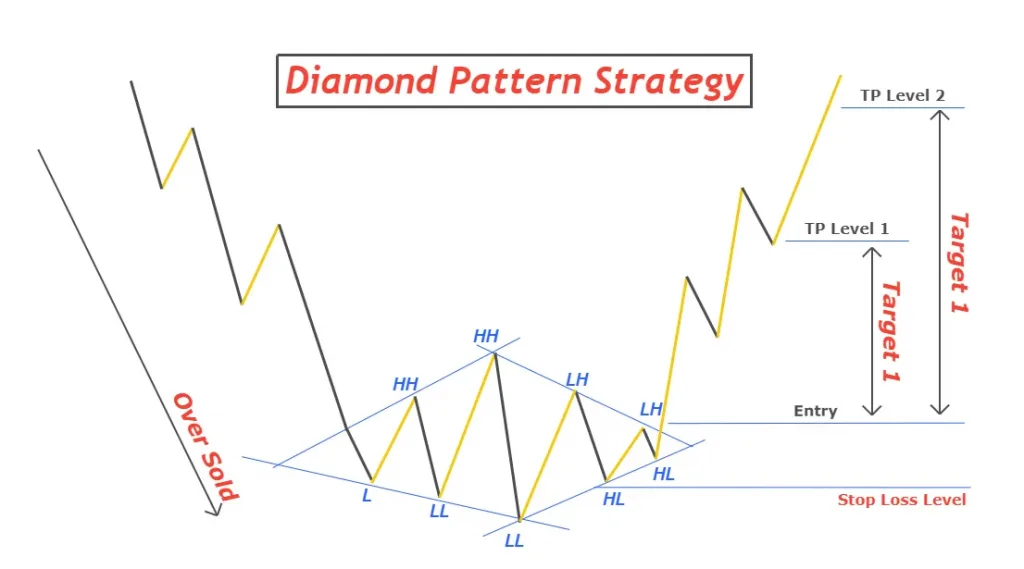
Final diamond pattern trading strategy
A trading strategy consists of many confluences that adds up and then a high probability setup form. Trading a single chart pattern is not a strategy but a strategy that filters the best setup from the crowd. In strategy, risk-reward, risk management is properly followed.
- To filter best patterns from crowd, use trend filter (formation of higher highs/lower lows/200 period moving average)
- Adjust stop loss above the first lower high after maximum swing high in case diamond top. On the other hand, place stop loss below the first higher low after maximum swing low in case of diamond bottom.
- Split take profit level into two. Partial close the trade at the TP level 1 (discussed above). Now multiply the distance between high and low with 1.618. TP level 2 will be at this level. For example, if TP1 is at 100 pips then TP2 will be at 161 pips (100*1.618). 1.618 is a Fibonacci golden ratio and I have used it to increase risk reward ratio of this trade setup.
Now the diamond trading strategy has tight stop loss with high-risk rewards. Follow all the above steps and it has more than 85% winning rate if followed properly.
Conclusion
The diamond trading pattern is easy to follow, and it has a high winning ratio. If you will properly follow all the above steps explained, then you will become a profitable trader. You will not get a trade setup like this daily but if you are able to find out at least 5 to 8 setups in a month, then you can easily grow at least 15 to 20% per month.
Also learn compounding to convert your 4-figure account into 7-figure in less amount of time.
The diamond pattern alone is neither bullish nor bearish. The location of the diamond pattern tells us that either it is a bullish or bearish pattern.
The diamond pattern is very rare in trading that is why you will rarely find out it on higher timeframes. I will recommend you to trade it on intraday and for scalping on lower timeframes. And follow the diamond pattern strategy described in this article.
It can be used for both purposes just breakout of diamond pattern decides either it is a continuation pattern or reversal. The best use of a diamond pattern is as a reversal chart pattern.
Thank You very mach