

Definition of AB=CD pattern
AB=CD pattern refers to a harmonic chart pattern that contains two impulsive waves of equal length and it is a reversal chart pattern in technical analysis.
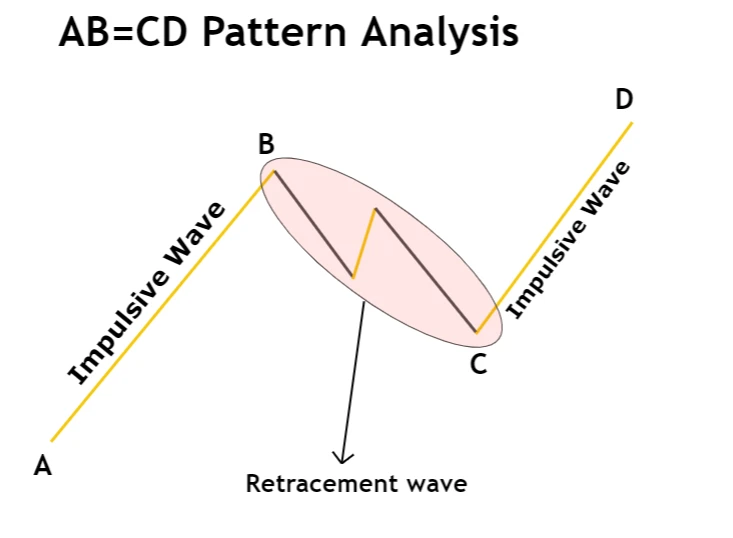
It is the most popular and simplest harmonic pattern that retail traders use to forecast the reversal in the market. The length of two waves of the ABCD pattern is based on Fibonacci ratios. Basically, there are three waves in the AB=CD pattern.
- Two impulsive waves
- One retracement wave
If these three waves, follow a particular Fibonacci ratio then we will call them AB=CD harmonic pattern. Because all the harmonic patterns are totally based on the Fibonacci tool.
How to find out AB=CD pattern on chart?
H.M. Gartley identified this pattern for the first time, and he has assigned Fibonacci ratios to the waves of this pattern. According to H.M. Gartley, an ideal AB=CD pattern must follow the following criteria
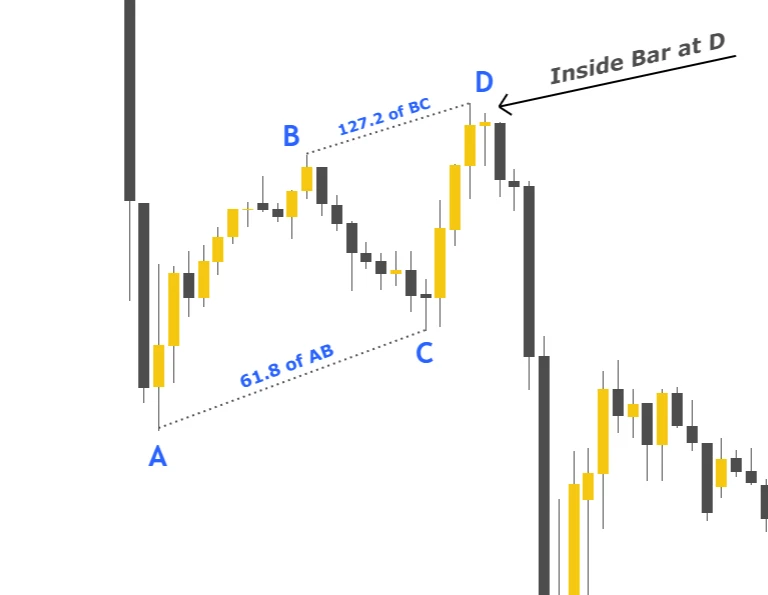
- BC wave must retrace to 61.8 Fibonacci level of XA wave
- CD wave must extend to 127.2 Fibonacci level of BC wave
An ideal pattern should meet/approach the above two points.
Breakdown analysis of AB=CD pattern
After dividing this pattern into three components, you will be able to correctly identify and trade the AB=CD pattern.
Three components are the following
- AB is an impulsive wave
- BC must be a retracement wave
- CD is an impulsive wave
You must keep in mind the above four points while identifying a good pattern on the price chart. If BC is not a retracement wave, then you should avoid trading.
If you want to look more deeply then the BC wave consists of further three waves, but this is for informational purposes only. You just must figure out that BC is a retracement. This analysis will help you to filter out the best and profitable patterns.
Types
There are two types of AB=CD patterns based on the direction of the pattern.
- Bullish AB=CD chart pattern
- Bearish AB=CD chart pattern
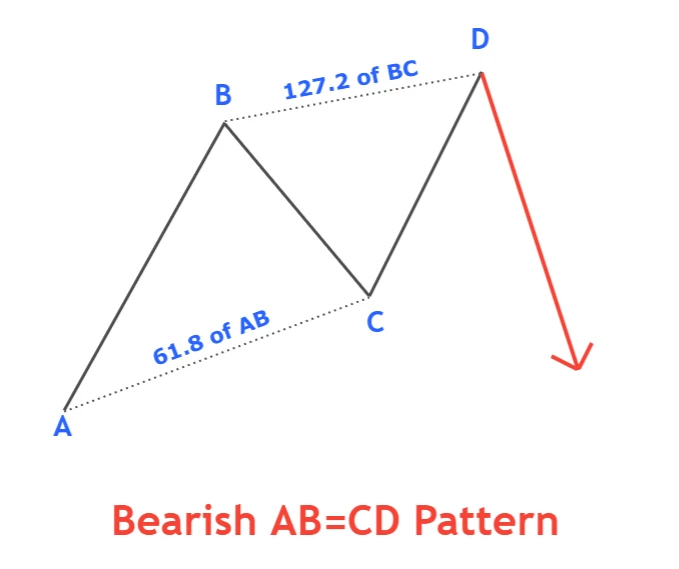
Rules to identify bearish AB=CD Pattern
Follow the following rules to identify a bullish pattern on the price chart.
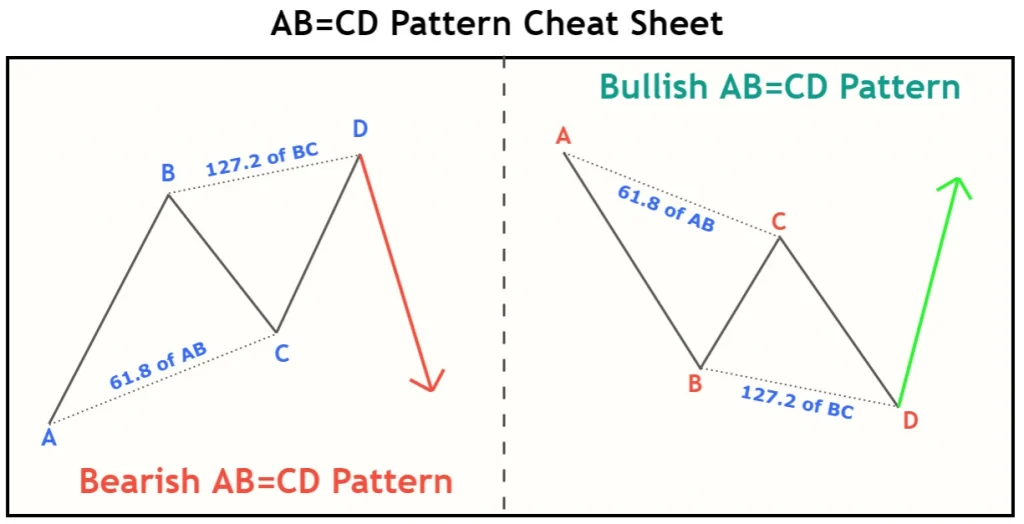
- AB wave starts from bottom to top
- BC must retrace downward to 61.8 Fibonacci level of AB wave.
- Point D must form at 127.2 Fibonacci level of BC wave.
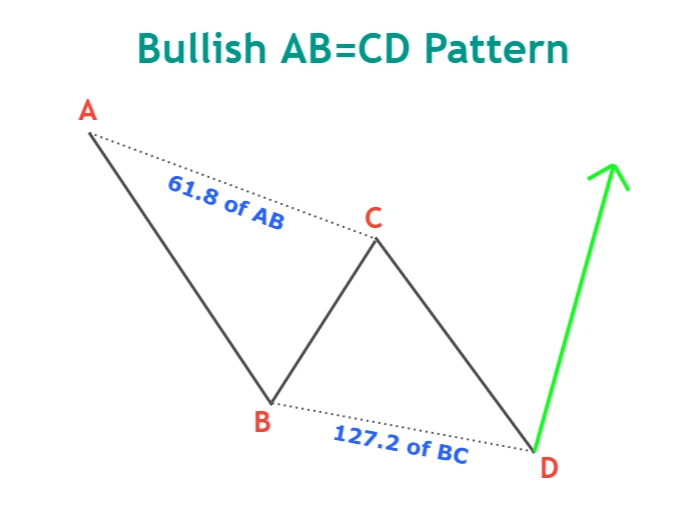
Rules to identify bullish AB=CD pattern
It is a bearish trend reversal pattern. After the formation of this pattern, the price reverses from bearish into a bullish trend.
- AB wave starts from top to bottom and it is initial wave
- BC wave must retrace upward to 61.8 Fibonacci level of AB wave
- Point D must form at 127.2 Fibonacci level of BC wave, and it should form at the bottom of the trend
Significance of ABCD harmonic pattern
Nature consists of repetitive patterns. Everything in nature occurs after a specified time. If you look at the chart and try to read the price, then you will see natural patterns on the chart. Advance traders trade the repetitive patterns and profit from the market.
In a similar way, AB=CD is a natural pattern. Because it is very rare on the price chart that two price waves consist of equal length as in the image below.
This is a market pattern because of similar waves formation many times in history. Backtest results have proved that it is a reversal chart pattern and price always tends to reverse from point D.
Key Point
When this pattern forms at a key level/ S&R breakout level then it will act as a fakeout. It has a high probability of winning in case of a fakeout. Backtesting at least 75 times and analyzing the results will give you many clues to this pattern.
Trading plan for AB=CD Pattern
A trading plan includes all the parameters you should consider before or during trading. Parameters mean to answer the following questions to yourself
- Why should I open a buy/sell order after AB=CD pattern formation?
- Where to place stop loss and take profit levels?
- When to breakeven the trade and when to hold a trade?
To answer these questions, you need to make a trading plan. I will explain here a few parameters you should consider during trading the AB=CD pattern.
Confluences for best trade setups
The Candlestick pattern is the best confluence to trade this pattern. The main drawback of the AB=CD pattern is that you don’t know when the market will reverse and sometimes all the conditions will meet the criteria but point D will extend from 127.2 to 161.8. So, to filter out best patterns only, we have added a reversal candlestick pattern confluence (pin bar, engulfing, three inside, etc.).
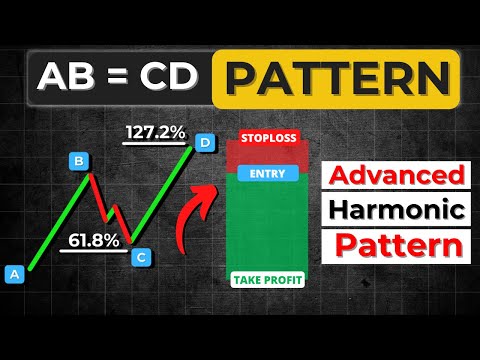
Open an order
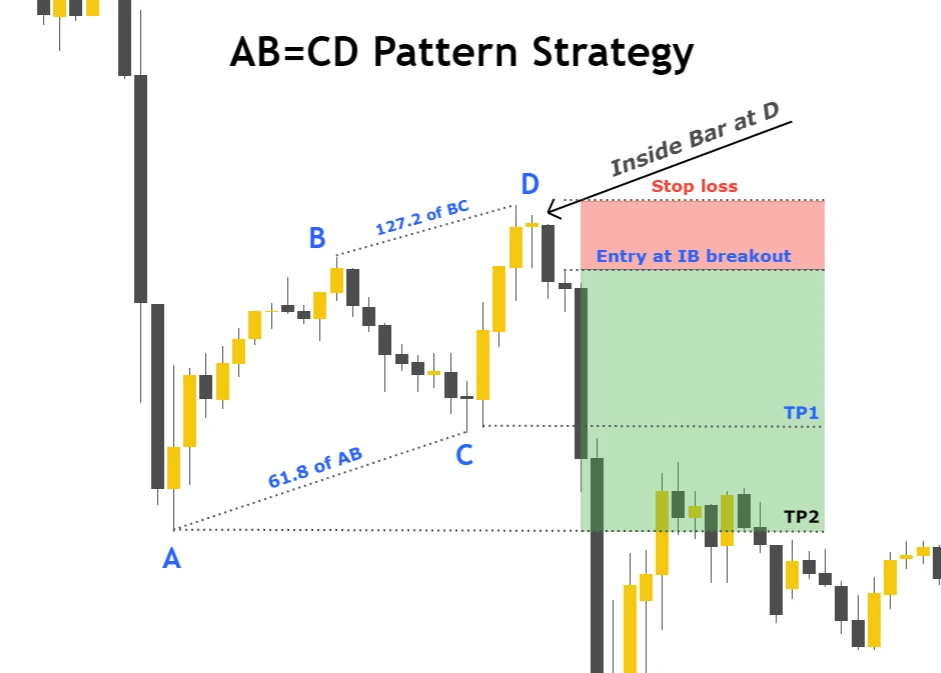
At point D, you always will have to wait for a reversal candlestick formation. For example, in the case of a bullish pattern, a bullish pin bar must form that indicates a reversal. After candlestick pattern formation at point D, open an order instantly.
Take-profit level
Close partial trade at 61.8 Fibonacci level of AD wave and let the rest of trade run until it hits the 2nd take profit level at the origin of the pattern.
Stop-loss level
Place stop loss above/below the confirmation candlestick pattern
Risk Reward ratio
Small stop loss will give a high-risk reward ratio and a large stop loss will give a small risk-reward ratio. Both are the best, but you should keep in mind that if you are using a tight stop loss then you should not book the profits early. Do not break the rules.
I will recommend risk at least 1:2 risk-reward for the AB=CD pattern.
AB=CD pattern Cheat Sheet
you can also download the cheat sheet to remember this pattern or use it later for analysis purposes. only
Conclusion
AB=CD is a well-known and simplest pattern. You can not profit by using this pattern until you will make your own rules because everybody knows how to trade this pattern. So, I will recommend you backtest this chart pattern at least 75 times before trading on a live account.