
Definition
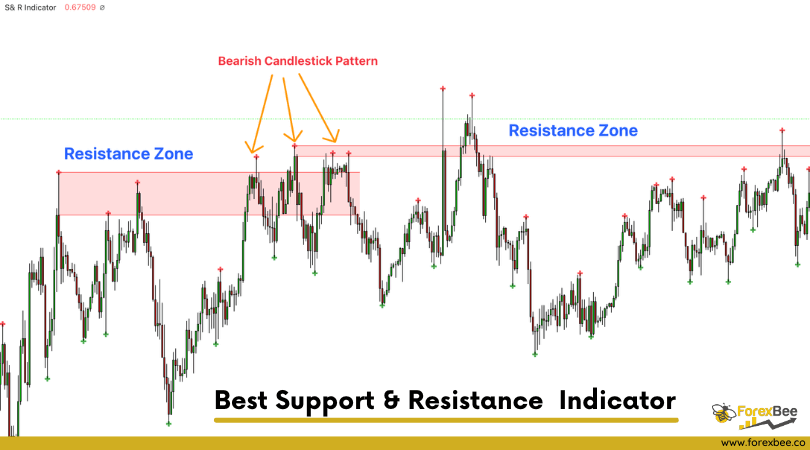
The support and resistance indicator is a technical indicator that will plot the support zone and resistance zone on the candlestick chart. It determines the price touches to find the strong support resistance zones.
The support and resistance indicator is the best and the most basic technical analysis in trading. Instead of drawing zones manually, this indicator can save you time by plotting zones automatically.
In this article, I will explain the working and the origin of support resistance indicators with a trading strategy. So it will become easy for you to trade with this indicator. Make sure to read the full article.
How to does the indicator finds strong support and resistance zones?
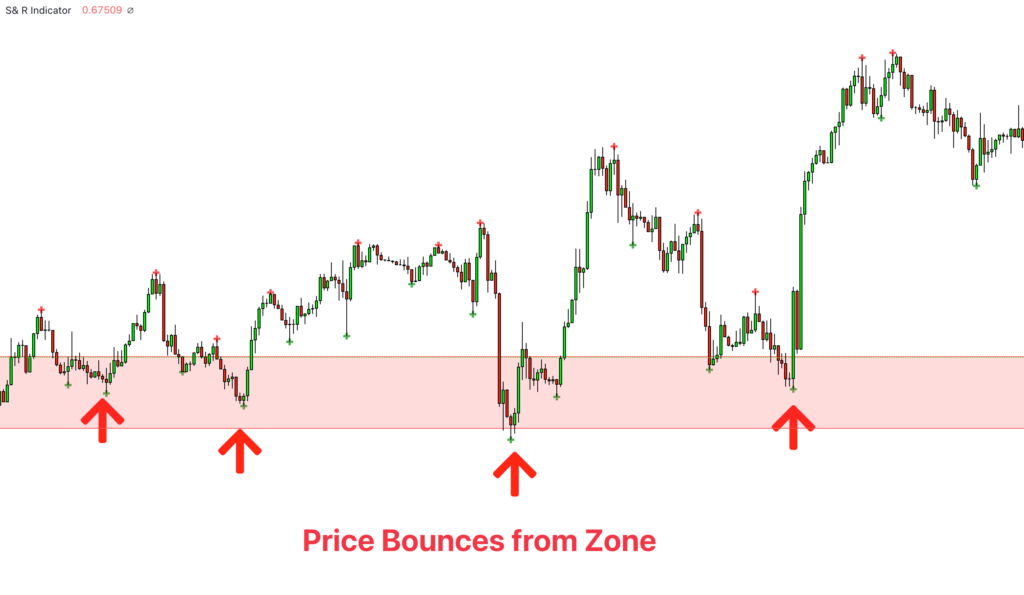
There are specific characteristics of a valid support and resistance zone. Price always bounces upward from the support zone while it bounces downward from the resistance zone. On the other hand, when a breakout of the support or resistance zone happens, the price trends toward the breakout.
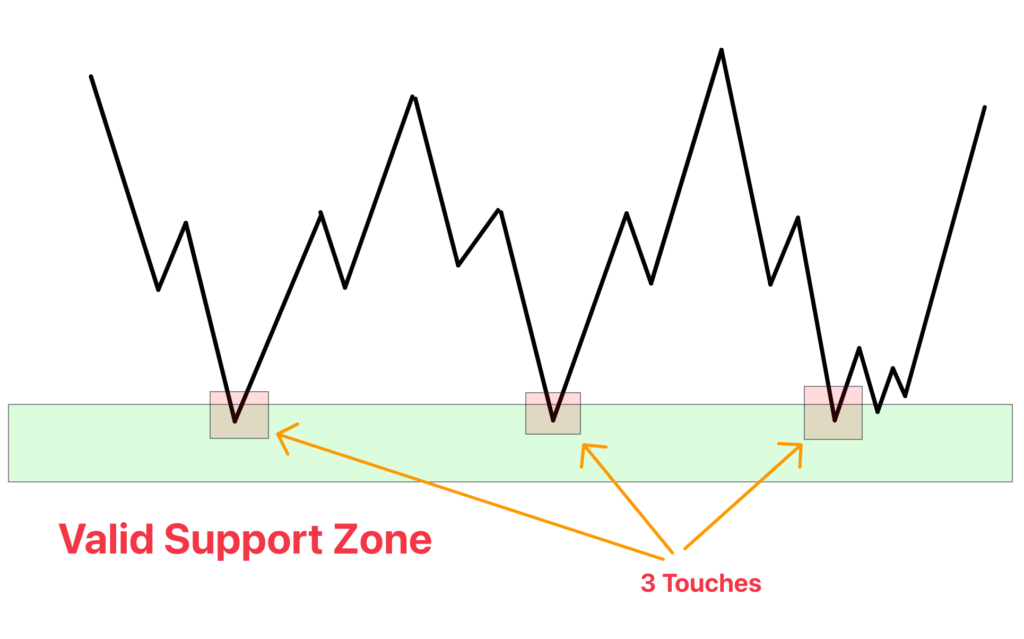
Valid support zone
when the price touches a zone two to three times and bounces in a bullish direction, it is a good support zone.
The main point is that you should always find the bounces in clear price swings. The touches or bounces of the price must not be in the form of a choppy market. Price always moves in the form of swings or waves.
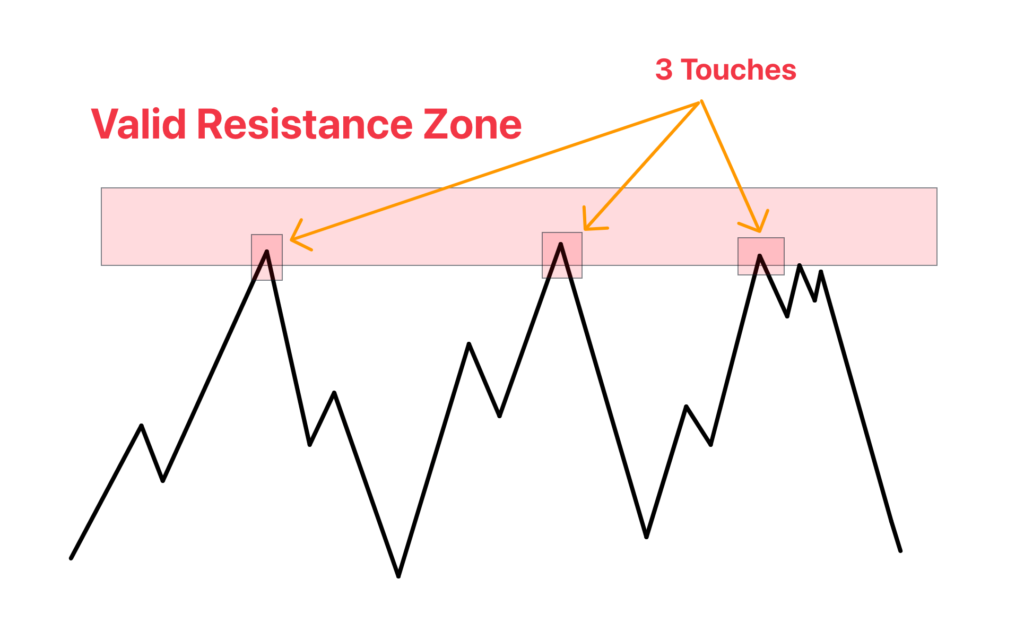
Valid resistance zone
When the price touches a zone two to three times with a bounce in a bearish direction, then a valid resistance zone forms.
Here the price bounces must be in the form of swings or waves. You must avoid a choppy market.
So the support and resistance zone indicator finds these parameters on the chart and draws only valid and high-probability zones.
Working of support and resistance zones indicator
The support and resistance indicators can be used in two ways:
- Using the breakouts
- Using the price bounces
In both concepts, this indicator works well. I will explain both ways.
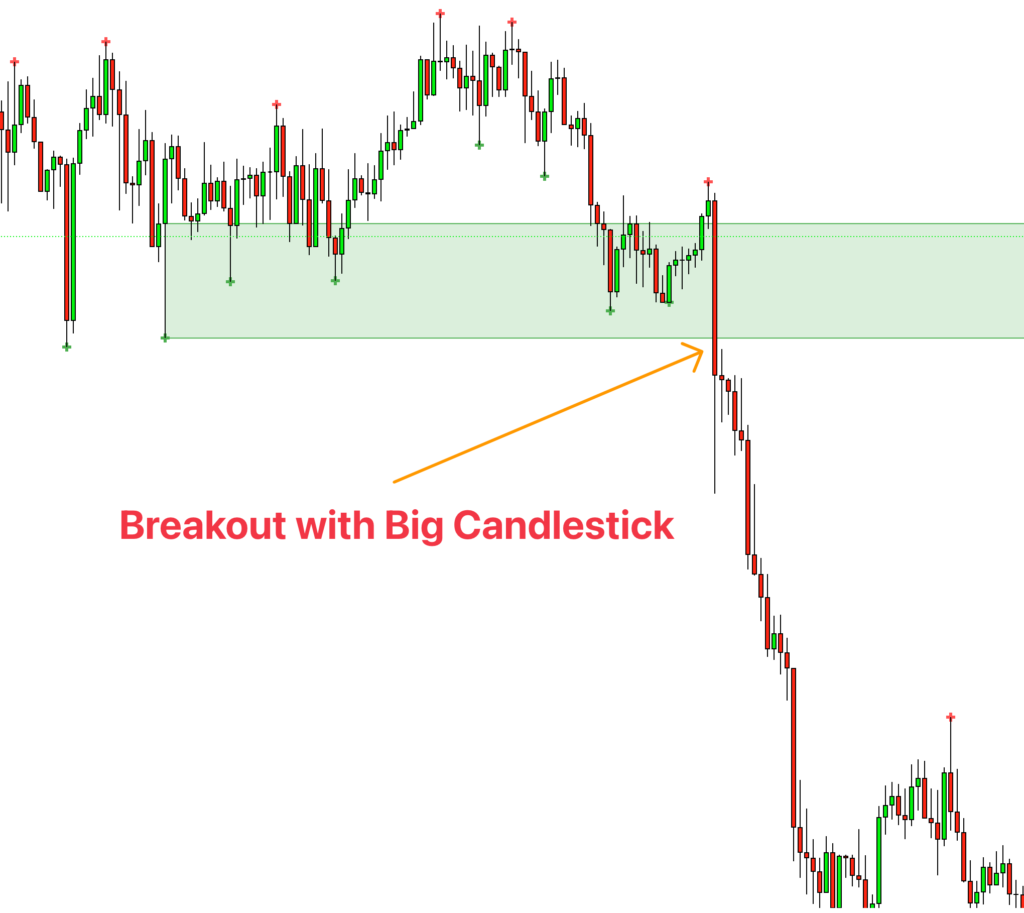
Support resistance breakout
In this parameter, we’ll find the breakout of the support or resistance zone, and then we’ll open a trade in the direction of the trend.
For example, a bullish trend will form when the price breaks the resistance zone. That’s why we will open a buy trade at the breakout and place a stop-loss below the recent swing low. The support and resistance indicator will also plot a label of the breakout candle once a breakout happens.
On the other hand, when the price breaks the support zone with a big bearish candlestick, a bearish trend will form. After the breakout candlestick, the indicator will plot a label of sell or breakout, then open a sell trade with a stop loss above the recent swing high.
Using price bounces
In this parameter, we will trade the price bounce, and it acts as a trend reversal trade setup. It works mainly during the ranging market.
For example, when the indicator plots the support zone, then wait for the price to return to the zone. When the price touches the zone, we’ll wait for the price to make a bullish reversal candlestick pattern at the support zone. Now you should open a buy trade and place a stop loss below the low of a candlestick or the support zone.
On the other hand, when the indicator plots the resistance zone, wait for the price to return to the zone and make a bearish reversal candlestick pattern. Then open a sell trade with a stop loss above the high of a candlestick or the resistance zone.
Tip: Trading the price bounce from the zone with the confluence of candlestick pattern is better than trading breakouts due to many false breakouts in the market.
Settings of indicator
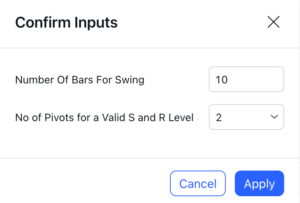
There are two inputs available in the indicator.
- Number of bars for swing
- Number of pivots for valid support and resistance
the number of bars for the swing bars represents the size of the swing for a valid support or resistance touch. This parameter helps to filter the ranging price. the default value is 10.
In this indicator, the number of pivots represents the support or resistance touches. so if you select the number 3, the indicator will only draw a zone with three touches.
Features of support and resistance indicator
There are the following features that this indicator identifies automatically, so you don’t need to do manual work.
- Identify the valid support and resistance zones
- Add the confluence of swings or waves during zone identification
- Choppy market filter
- The alert label on breakout of support or resistance zone
We are also adding the feature of a candlestick pattern at the zone, which will be added in the next update.
Best timeframe to trade with support and resistance indicator
The timeframe depends on the trading style and temperament of a trader. Because this pattern will work perfectly on all timeframes. However, If you want to do trading peacefully without any psychological issues, I will suggest 1H, 4H, or a daily timeframe.
However, I suggest 5M and 15M timeframes for intraday traders. The indicator will work perfectly even in 5 minutes timeframe or 15-minute timeframe.
![This is The Best Support and Resistance Indicator [FREE]](https://forexbee.co/wp-content/plugins/wp-youtube-lyte/lyteCache.php?origThumbUrl=https%3A%2F%2Fi.ytimg.com%2Fvi%2Fu_hWMGoes6M%2F0.jpg)
Conclusion
The best support and resistance indicator is the one that draws valid zones using the confluence of other technical tools. If a trader is not adding confluences, then there are very high chances of failure of that trader. Because trading is all about increasing the probability. Higher probability means high winning, resulting in profitable trading.
Instead of using mathematical indicators, I suggest using the price action indicators like this one.
To get access to this indicator, kindly click on the link below.