
The technical indicators that indicate confirmation before opening a buy or sell order act as a trade entry indicator. These indicators tell traders about the trade entry point on the candlestick chart.
Many technical indicators can be used for trade entry or trade confirmation trading; however, I will explain the four best indicators. So you don’t need to check indicators one by one; instead, just read this article and practice on the chart.
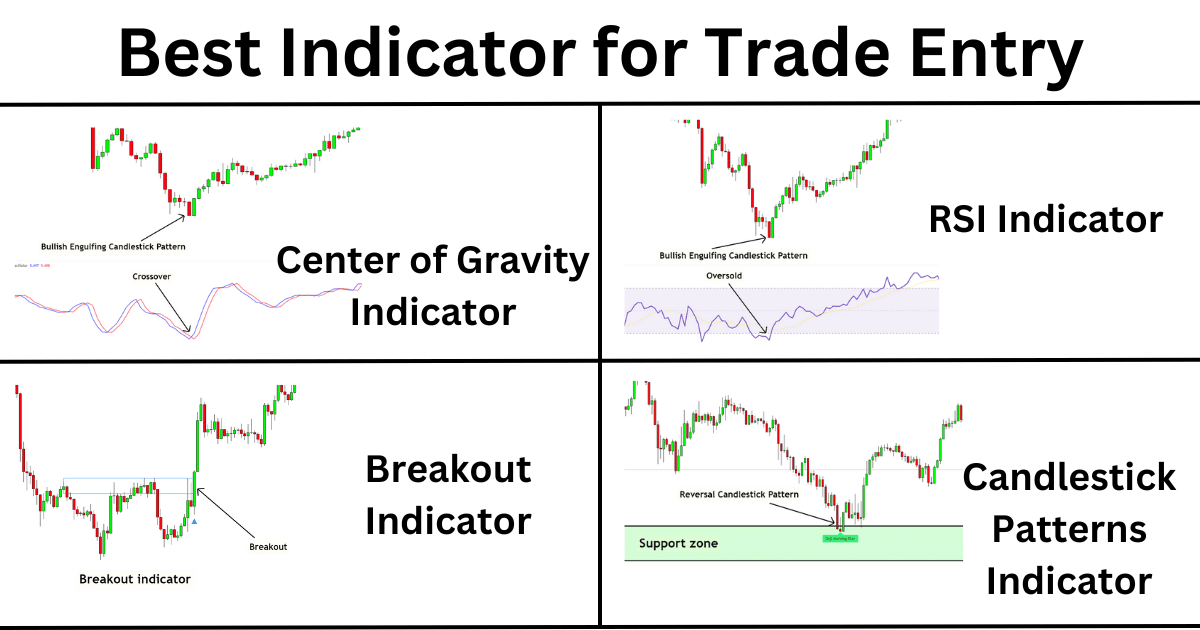
List of top 4 indicators for trade entry and confirmation
It includes:
- Candlestick patterns indicator
- Breakout indicator
- RSI indicator
- Centre of gravity indicator
The candlestick patterns and breakout indicators are price act indicators; however, the RSI and Centre of gravity indicators include the mathematical formula.
The candlestick patterns indicator has the highest accuracy for the trade entry or trade confirmation in technical analysis trading. That’s why I will recommend you use this indicator. If you’re a beginner trader, I suggest you check our candlestick patterns course for technical analysis training.
Why should you use the trade entry indicator?
Trading is a game of probability. If you have a low probability of winning, your trading system will not generate profits. That’s why you need to optimize your trading system or strategy to increase the chances or probability of winning in trading.
To do so, you need to add confluences. And trade entry indicator acts as a confluence.
For example, you’re opening a trade from the Fibonacci golden zone. There are chances that the price will break the zone or will continue the trend after the false breakout of the Fibonacci golden zone. The best way to overcome this issue is to add confirmation for trade entries like candlestick patterns.
For example, if you wait for the price to make a candlestick pattern in the direction of trend at the fibonacci golden zone, you’ll be able to filter the false breakouts.
A trader that wants to open a buy trade will add a confirmation of a bullish pin bar candlestick pattern before opening a buy trade then the probability of winning will increase.
Besides this, the risk-reward ratio can also be increased using candlestick patterns as a trade entry signal. You can place a tight stop loss above or below the candlestick pattern to increase the risk-reward ratio.
Candlestick patterns indicator
The candlestick patterns indicator acts as a trade entry indicator. It finds the patterns on the chart automatically. It’s also available for free in the tradingview.
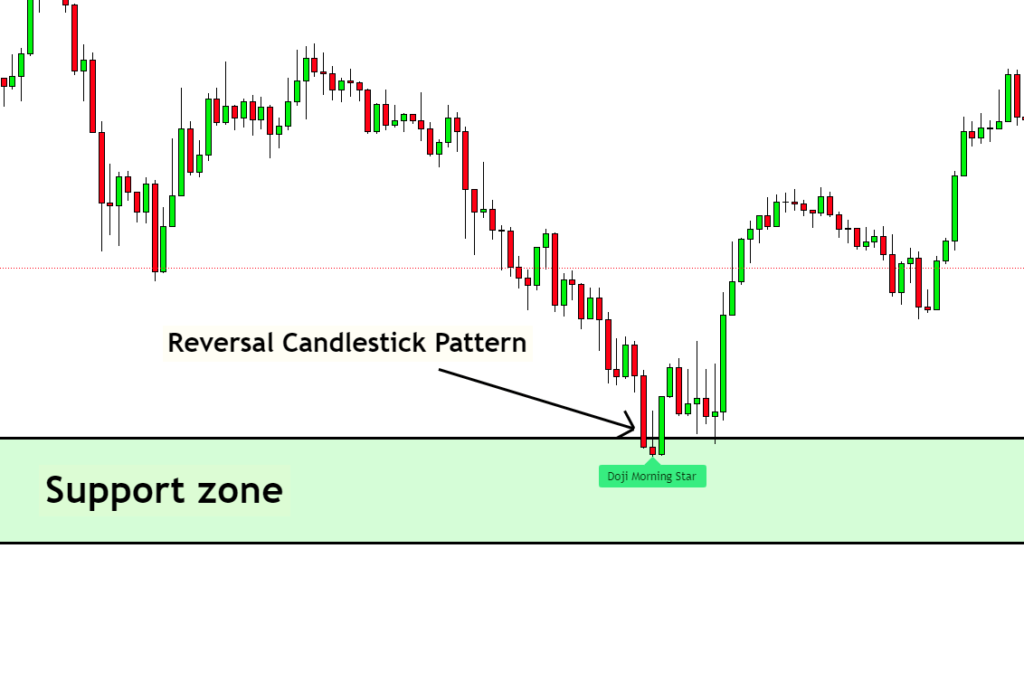
For buy trades, you should look for bullish candlestick patterns before opening a trade. While for sell trades, you should look for bearish candlestick patterns before opening a sell trade.
For example, you’re using a support resistance trading strategy, and you’re going to buy from the support zone. But if you add the candlestick patterns indicator as a trade entry indicator, the probability of a bullish trend reversal from the support zone will increase.
Click here to access candlestick patterns indicator
Breakout indicator
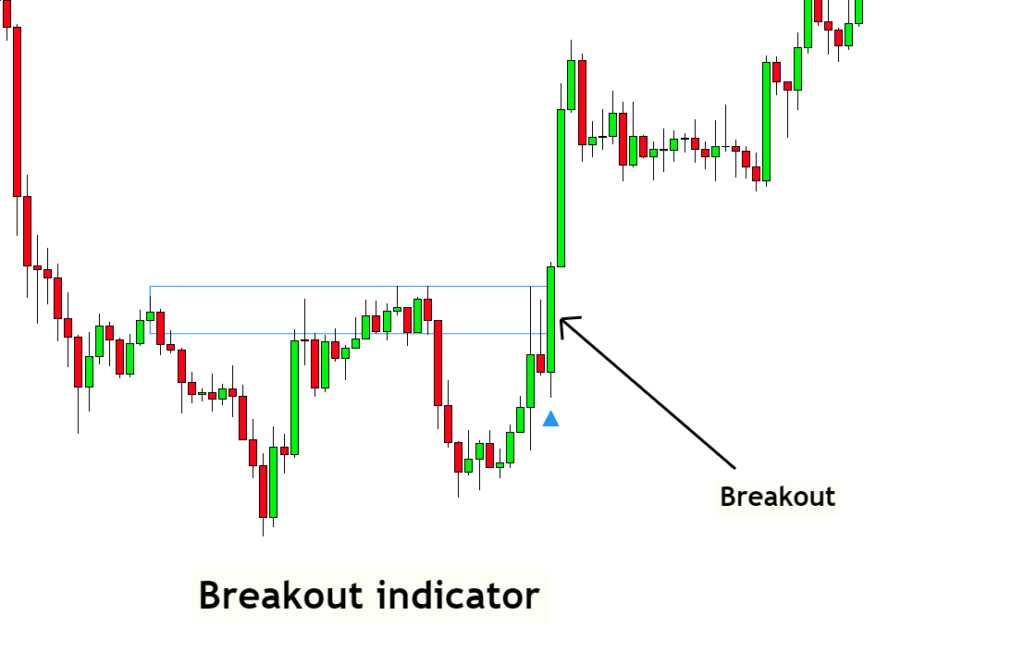
The breakout indicator also acts as a confirmation indicator for trade entry. The breakout indicator finds the major key levels breakouts on the candlestick chart.
For example, if you’re trading with a strategy that is giving a buy signal or a bullish chart pattern is forming on the chart like an inverse head and shoulders pattern. So if you add the breakout indicator as a trade entry indicator, then the probability of a bullish signal will increase because both parameters (chart pattern + indicator) indicates a bullish trend.
If both parameters show the opposite signal, then the probability will decrease.
That’s why a simple trade entry confirmation is necessary for trading.
Click here to access the breakout indicator
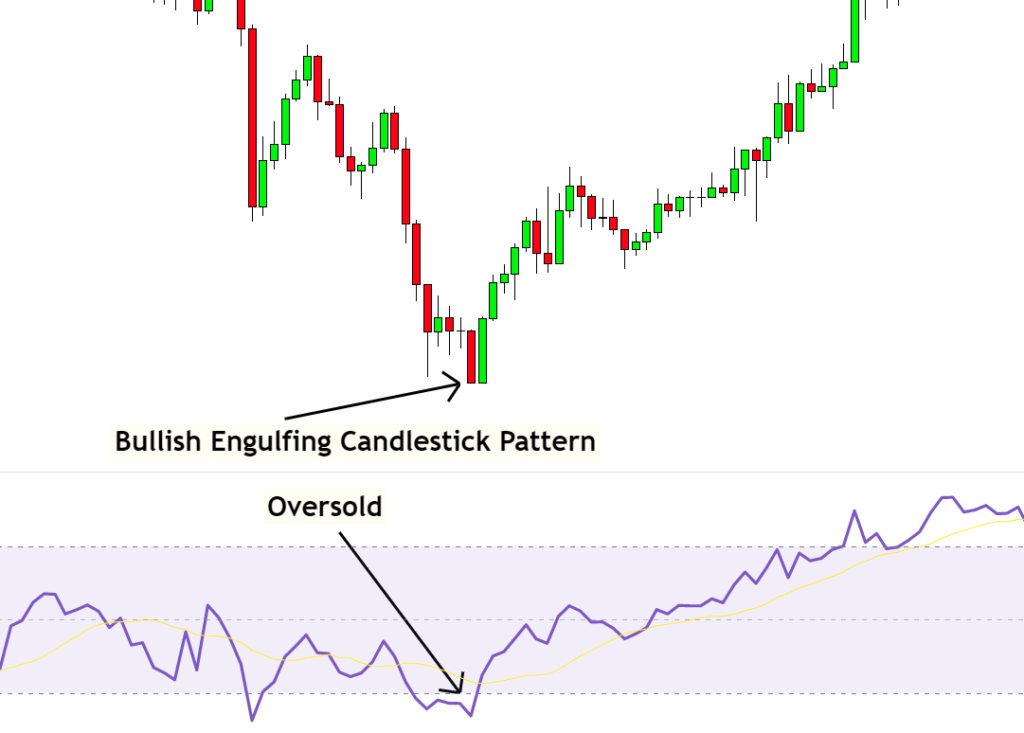
RSI indicator for trade entry
RSI is a perfect and beginner-friendly indicator for trade entry signals because it is elementary and most influential in trading.
For example, if you’re trading with a strategy that gives a buy signal. So before opening the buy trade, you can look at the RSI indicator for the trade entry signal. If the RSI indicator value is below 30, you can open a buy trade according to your strategy.
In the same way, if your strategy is signalling a sell trade, then look at the value of the RSI indicator. If the RSI value is above 70, you can open a sell trade. However, if it’s below 70, you should wait or skip that trade.
Using the indicator for trade entry will undoubtedly improve the winning ratio of the trading strategy.
click here to access the RSI indicator
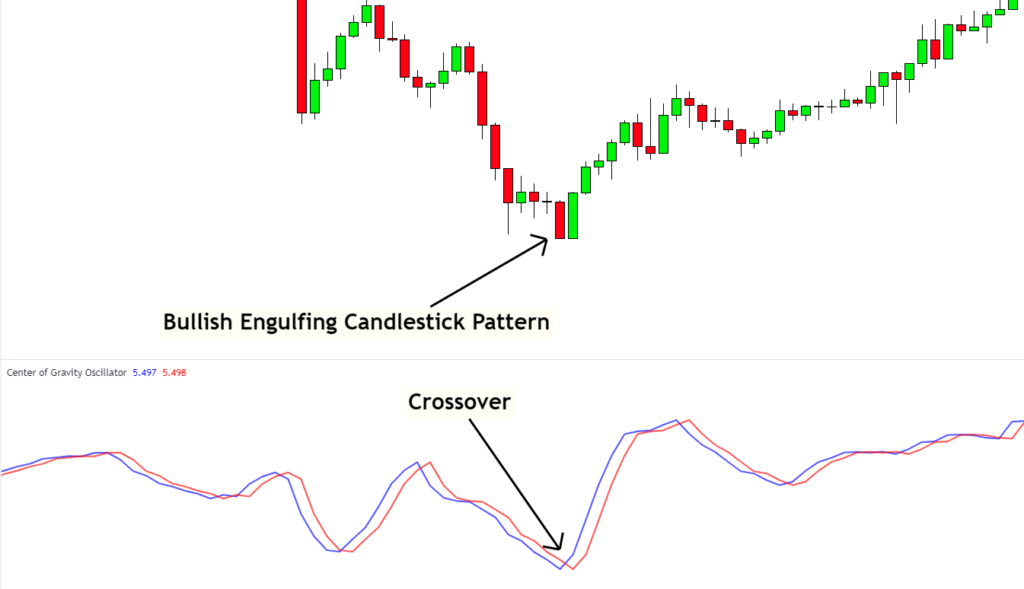
Centre of gravity indicator
The Centre of gravity indicator can also be used for trade entry confirmation. It’s based on simple moving averages crossover with fast and slow MA lines. The crossover of both lines determines the trend reversal.
So, if you’re trading with a trend line or any other similar strategy, then the Centre of gravity indicator will be perfect for trade entry.
For example, a trend line breakout in a bullish direction confirms that the upcoming trend will be bullish. So before opening a buy trade, if you check the crossover of the Centre of gravity indicator in the direction of the trend, the probability of a bullish trend will increase. And you can open a buy trade just after crossover.
click here to access the center of gravity indicator
What does the trade entry indicator tell traders?
Trade entry confirmation is just a piece of confirmation before opening a trade. You must be serious about trading because you’re going to invest your money, so you should be extra cautious before investing.
So if you use these entry confirmation indicators before investing your money, then your strategy’s winning probability will increase. It will also save you from losses.
The bottom line
I recommend that retail traders use the candlestick patterns indicator and RSI indicator as trade entry confirmation indicators. After trying this, you’ll see improvements in trading.
Don’t look for quick profits; instead, struggle to become a better trader.