
Definition
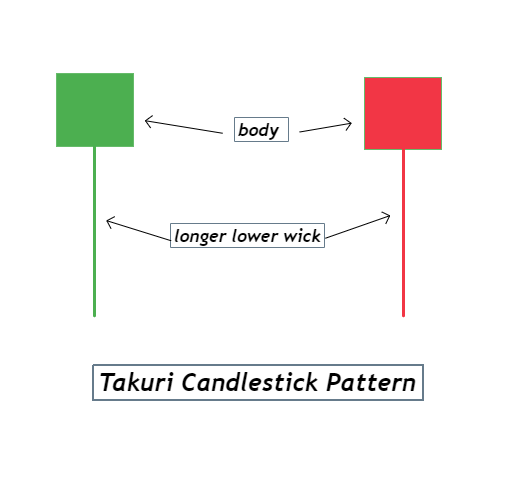
The Takuri candlestick pattern is a unique single-candle bullish reversal pattern. Candlestick in this pattern is rare in shape. The body of the candlestick is very small. The lower wick is exceptionally long in size, and the upper wick is absent.
The length of the lower wick is usually three times the size of the candlestick’s body.
This candlestick pattern is found in both colors, i.e., black and white.
The color of the candlestick doesn’t matter. The trend is primarily the bullish reversal one despite the color of the Takuri line candlestick pattern.
How to identify the Takuri candlestick pattern?
| Number of candlesticks | The pattern is composed of a single candlestick. The body of the candlestick is usually three times shorter than the lower wick. There is no upper wick in this candlestick pattern. |
| Prior Trend | It indicates that its prior trend is bearish. |
| Forecast | . The pattern usually indicates that in the near future, bulls are gradually going to replace the bears. The number of buyers in the market is going to take over the number of sellers. |
| Candlestick Sequence/color | As you already know, it is a single candlestick pattern. There is no sequence of the candlesticks. As far as the color of the candlestick is concerned. The color, in this case, doesn’t matter. The candlestick can show both the white and black colors. |
Avoid False Takuri Patterns in the market
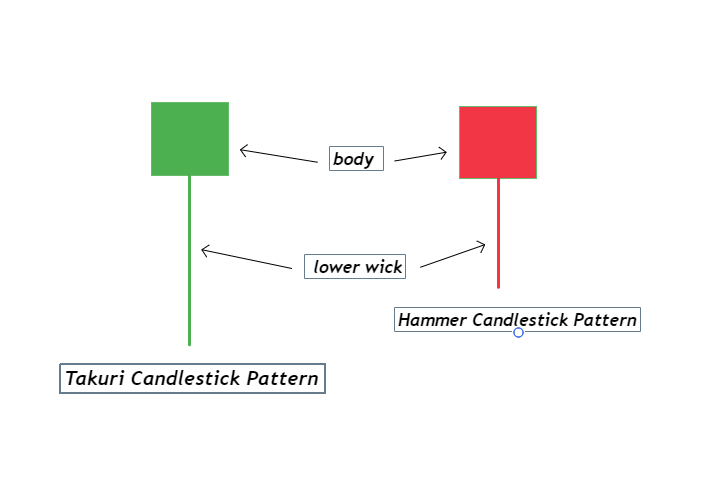
A trader may fall into a trap as the Takuri candlestick pattern can resemble the Hammer candlestick pattern.
The hammer candlestick pattern differs from the Takuri pattern in terms of the lower wick. The lower wick is always smaller in the Hammer candlestick pattern, as it never exceeds twice the body length of the candlestick. In the case of a Takuri pattern, the lower wick is always more than thrice in length compared to the length of the candlestick’s body.
The psychology behind the Takuri Candlestick
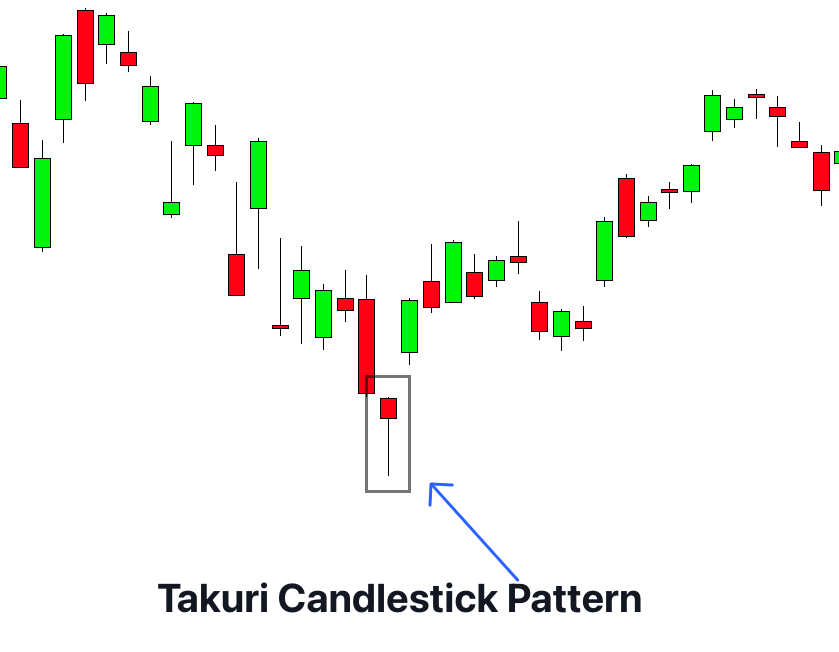
This pattern appears at the bottom of a candlestick chart. It indicates that the bearish trend will face a reversal, and bulls will take on the market. The smaller body of the candlestick suggests that there is a manageable gap between opening and closing. The appearance of this candlestick pattern suggests that the market is trying to find the lowest point. As the pattern confirms, the buyers become active because the market’s bullish sentiment is promoted in the future.
Trading strategy
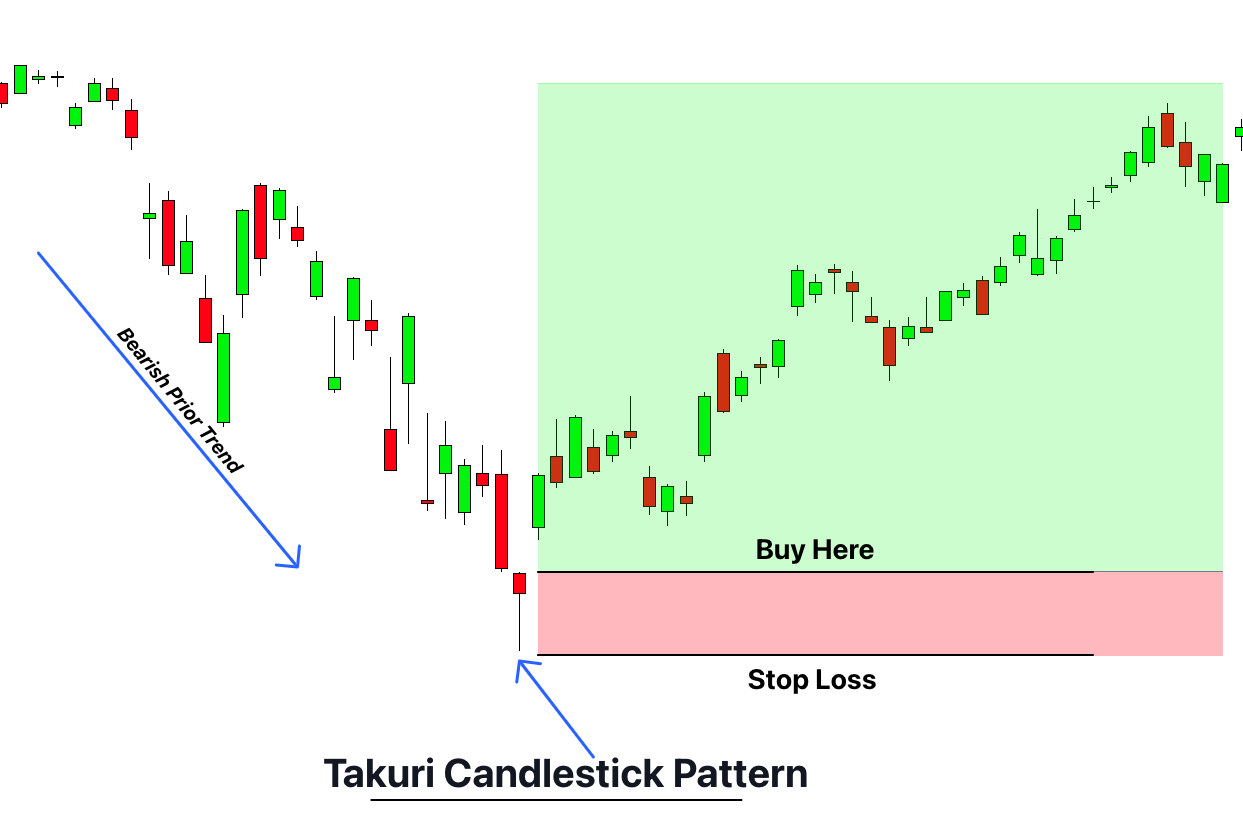
Takuri candlestick trading strategy is formed with the confluence of the support zone.
The trading strategy involves,
Entry
The bullish reversal sentiment of this pattern suggests to traders that bulls are regaining their power. The prices are about to rise in the near future, so it is the ideal time to buy assets. The bullish sentiment in the future encourages short sellers and aggressive traders to buy the assets. If this candlestick appears at a support zone, it is a reliable time to buy the assets.
Sometimes the Takuri candle appears after a price gap. In this case, some traders open a trade at the candlestick’s opening. In this way, traders can gain maximum profits from the future prevailing bullish trend.

Stop loss
In the case of this candlestick pattern, place the stop loss a bit below the main body of the candle. The longer lower wick suggests that the market is trying to find the lowest point; to stay on a safer side, the stop loss is placed just under the body of the candlestick.
Take profit
I suggest you use the ATR trading stop indicator to take profits. It is an automated system to close the trade as a reversal in trend appears.
Success ratio
This pattern shows a 34.6% success rate. So, we recommend only partially relying on this pattern.
The bottom line
The Takuri candlestick is a bullish reversal candlestick pattern in nature. It suggests that in the near future, the market’s bullish sentiment will prevail. It is a strong buying indicator. The formation of a single shorter candle with a longer lower wick defines the uniqueness of this pattern.
The success rate is much higher if this candlestick appears after a price gap. However, we don’t recommend using this candlestick alone for your trading.