
A Squeeze momentum indicator is a technical trading volatility indicator that shows the change in the price of an asset. It identifies the time when the price of the asset increase or decreases. This indicator tells us about the period when the market is flat and when it is following a trend.
An SM indicator gives a clear picture of the market regarding price change. It helps a trader in better decision-making.
Objectives
The main objectives of this indicator,
- To provide information about price rise and drop.
- To indicate a trend change.
Despite the main objectives of the SM indicator, it is capable enough to signal a trend reversal and form a trading strategy around it.
Significance
This indicator is very helpful in a volatile trading market. It can improve your decision-making with a better market picture regarding price change. The important benefits of this indicator are as follows.
- It can indicate a price change in a market.
- The SM indicator is very effective in a volatile market where price shows strong swings.
- It is a very user-friendly indicator.
- It is capable of signaling a trend reversal of both natures (bullish/bearish).
- It tells a user when the price consolidates and when the market has a trend.
- It can help in finding the entry and exit points.
- SM can help in finding the buy/sell signals.
Working of SMI
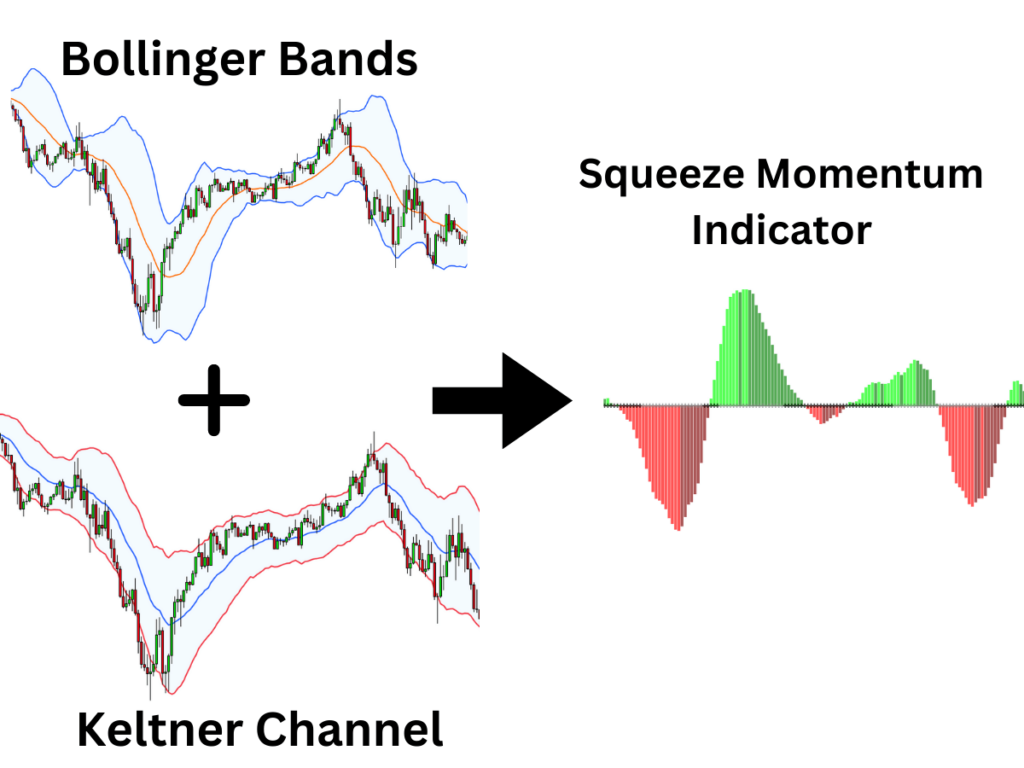
A squeeze momentum indicator combines two indicators for its working.
- Bollinger bands
- Keltner channel
The Bollinger bands provide information about the lower and higher range of price swings. The price usually stays between the upper and lower bands. If the bands are in a squeezing shape and their distance from each other is narrow, it means the prices are not facing an active change. As the upper and lower bands are at a significant distance, it means the market is facing a breakout in prices. It is a decent tool for measuring the volatility in a trading market.
On the other hand, Keltner Channel helps to measure the average true range in a market.
SM combines these two indicators to measure the level of volatility and trend change in a trading market.
SM representation
There are two ways to represent this indicator on a trading chart.
- Grey and Black dots
- Histogram
In the case of the dots, when the Bollinger bands form inside the Keltner channel, the black dots visualize. These black dots turn grey when the Bollinger band forms outside the channel.
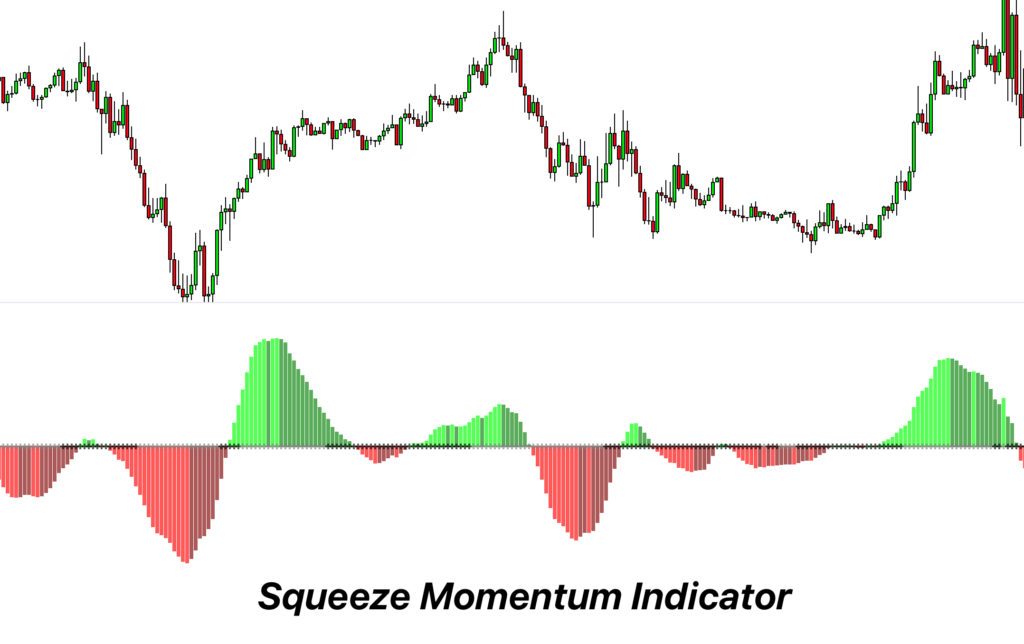
I prefer the histogram representation of the squeeze momentum indicator. This visualization gives a better picture of the market as well as provides more information.
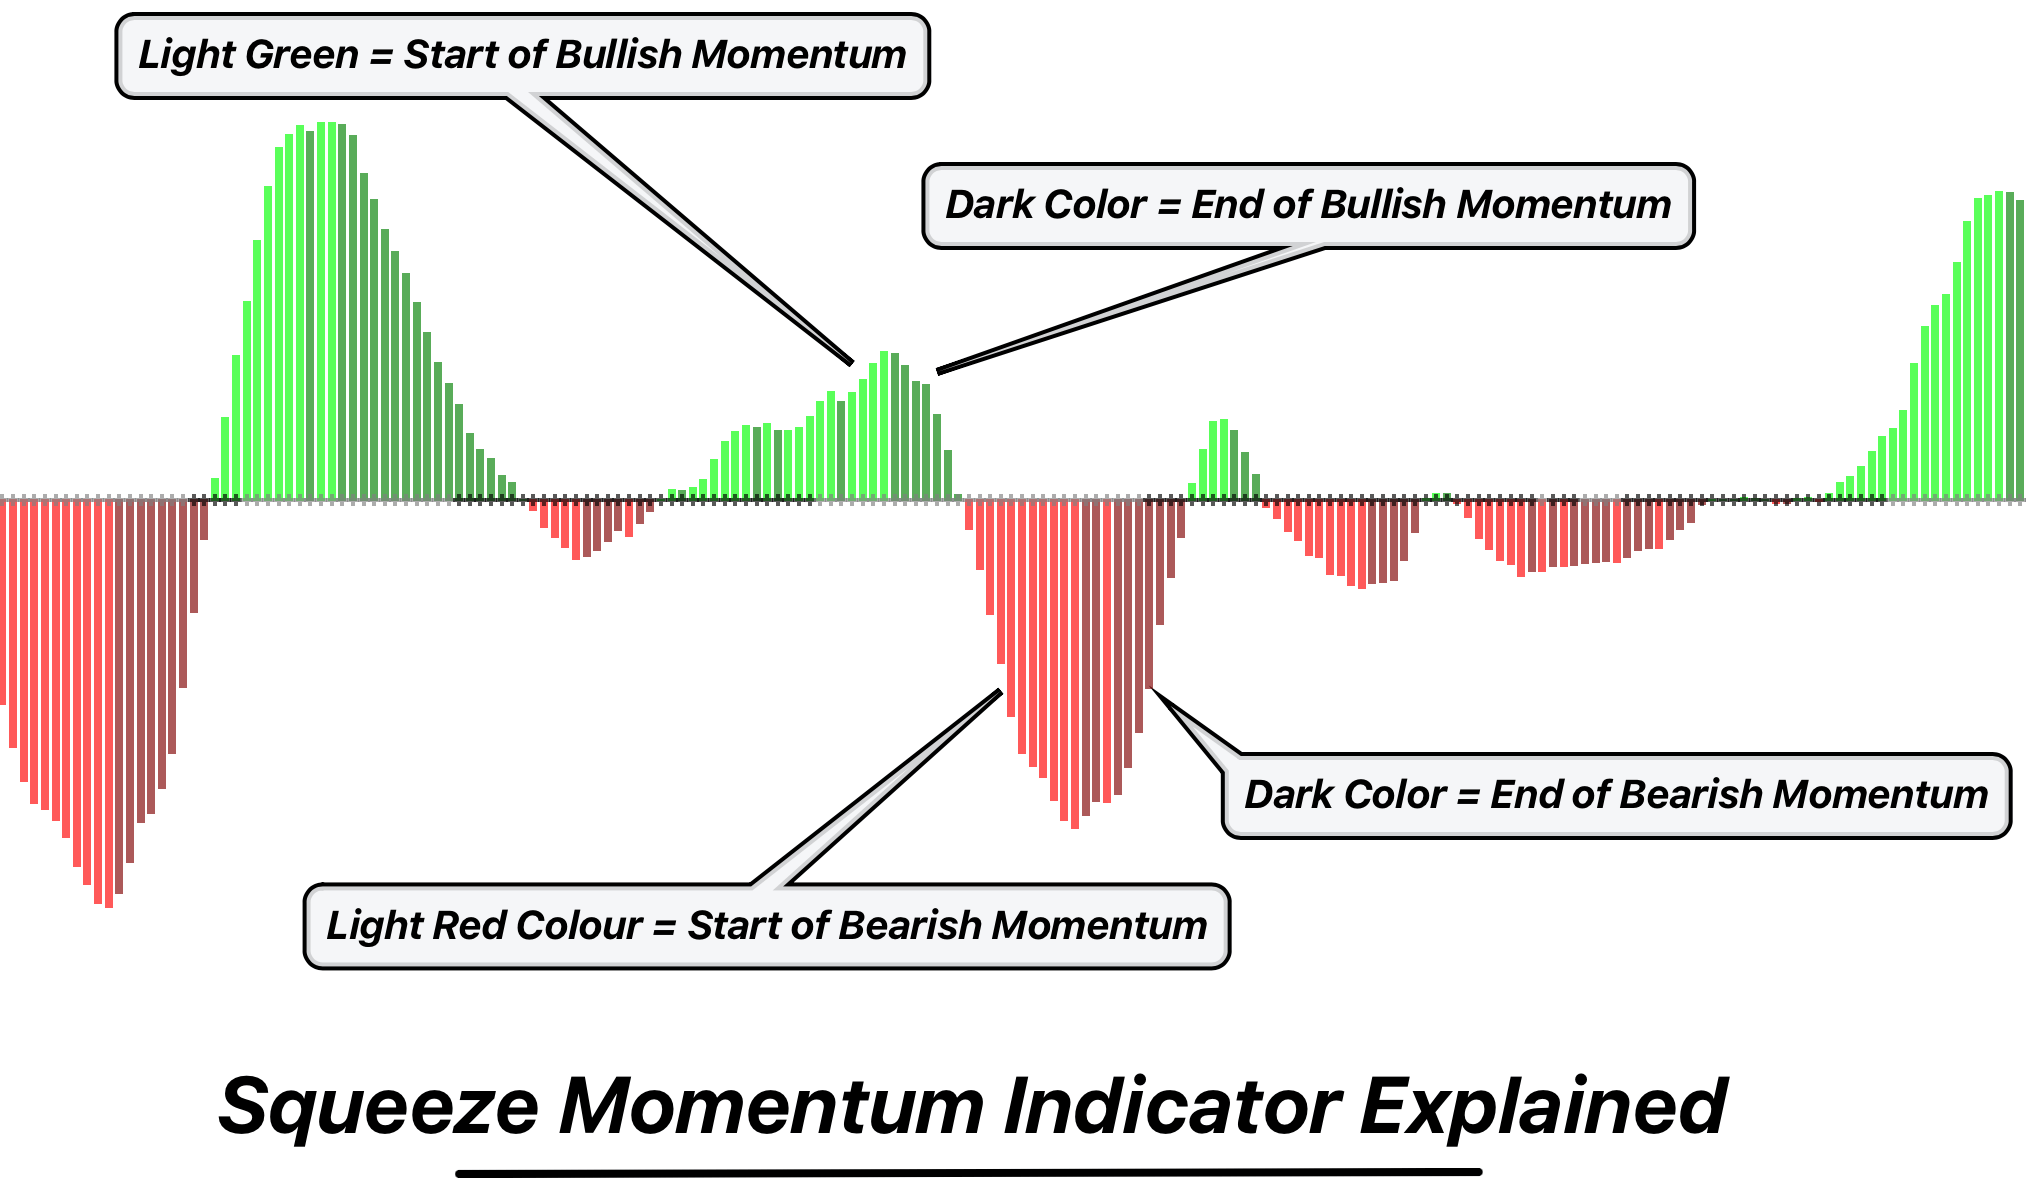
A histogram is composed of 4 colors.
- The light green color indicates the formation of a bullish market trend. This color tells us that bulls are gaining strength, and the number of buyers is about to take over the market.
- The dark green color signals that the market is about to take a reversal in the near future. It tells us that bulls are losing their power, and a bearish reversal is awaiting.
- The bright red color is antagonistic to the light green color. It tells a trader that bears are gaining control of the market. The market is facing a bearish trend, and the number of sellers is dominating the market.
- The dark-red color tells us the market is facing a bullish reversal period. The bears are losing their strength, and soon the bulls will take control of the market. It tells us that soon the number of buyers will take over the number of sellers.
This histogram forms next to SM values. When the market is near the value of zero, it means that the price of security is at an average level. If the histogram bars are near the zero value, the market is solidified. As the prices move above zero, it is a bullish divergence. When the prices fall below zero, it is a bearish divergence.
Best settings
The best setting for the SM indicator is as follows.
| Function | Value |
|---|---|
| Bollinger Bands length | 20 |
| Bollinger Bands multfactor | 2 |
| Keltner channel length | 20 |
| Keltner channel multfactor | 1.5 |
A trader can change these settings according to the strategy and trading experience. You can also change the color of the histogram according to your choice.
Trading strategy
The trading strategy around the SM indicator is very basic and easy to understand. We can divide it into three following steps.
Entry and Exit
For a long position, I recommend trading above the zero value. If the value is below zero, it is a good time to take a short position.
The bright green color is an indication of a bullish trend. It is the time to buy and make an entry into the market. As the color of the histogram turns dark green, it means the market is facing a reversal soon, and you can make a safe exit from the market. Some traders may wait for the appearance of the first red bar to confirm a bearish trend and exit the trade.
This goes for the bearish trade, but you must focus on the bright red and dark red colors instead of green.
Risk management
To minimize your losses and protect your profit, you must smartly manage your risk. You can use support and resistance zone for confirmation of the market behavior. I advise you to place a stop loss at the prior lower point in the case of a bullish trade and below the prior higher point in the case of a bearish trade.
Take profit
It is best to use RSI, Fibonacci retracement levels, and support and resistance zone to maximize profit levels.
Squeeze Momentum Divergence strategy
SMI also identifies the divergence between the indicator and the price. Divergence gives very powerful trading signals. so i will recommend to use the SMI indicator for identifying the trend and trading using SMI divergence.
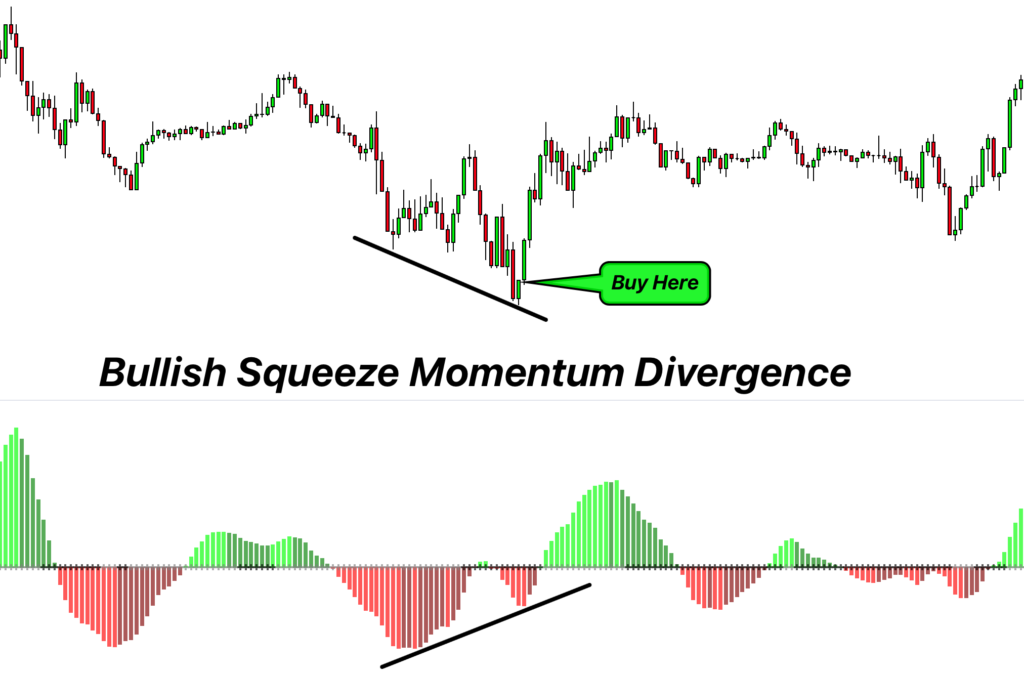
Bullish SMI divergence
If the price is making a lower low and the SMI indicator is making a higher low then it means a bullish squeeze momentum divergence is forming. it is a bullish signal.
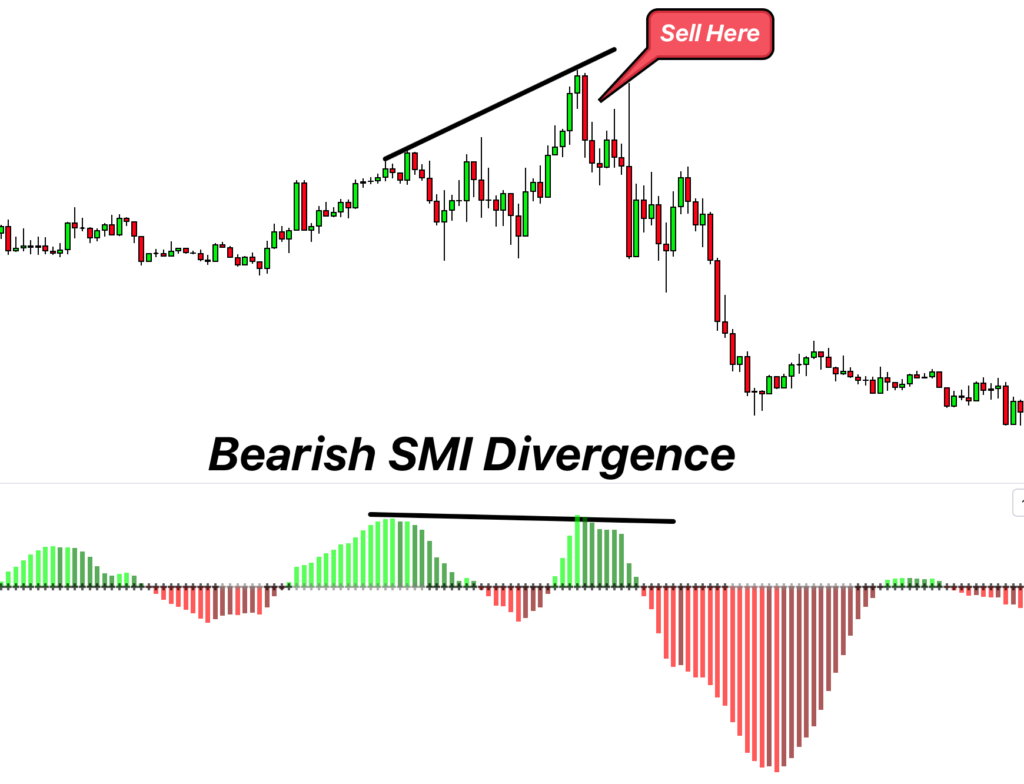
Bearish SMI divergence
If the price is making a higher high and the SMI indicator is making a lower high then it means a bearish squeeze momentum divergence is forming. in this situation, you should open a sell trade.
Success ratio
It is a highly successful and profitable indicator. The founder of this indicator, John Carter, made more than 18 million dollars with this indicator in a single year. These numbers are good enough to tell you about this indicator’s success ratio. In general, the success rate of this indicator is more than 75%.
John didn’t make all this money with a 100% reliance on the SM indicator alone. So, I suggest you use this indicator in a proper confluence with other technical trading indicators.
Pros
- It gives information about volatility in a market.
- It can signal a trend reversal.
- It is a very user-friendly and easy-to-understand indicator.
- It is equally helpful in short and long trade.
- It can signal price breakouts.
- It helps in forming a trading strategy.
Cons
- It can struggle in multiple timeframes.
- SM can create false signals.
- This indicator can lag in real-time.
- It requires the confluence of other trading tools.
Conclusion
The squeeze momentum indicator is a winning indicator that can improve your trading decisions. This indicator provides better information about the prices and behavior of the market. You can enhance your chances of success with the confluence of this indicator with other technical tools like RSI and Fibonacci retracement numbers.