
This article is about the method in which you can use tradingview premium features for free. There are many tradingview hacks, but only two will be discussed here.
Add Emojis in Tradingview Chart
Emojis are used to express feeling or activity. Like use fire emoji to show high Volatility in the market or a currency pair.
The plotchar is a function that is used to plot emojis on the chart in tradingview. It will plot series of emojis according to the applied condition in pine editor.
For example, input variable is [close>open] then plotchar function will plot emojis on all the bullish candlesticks depending on the input location. By default, plotchar function will plot star, but we can customize by copying and pasting uni code characters. “char” is a parameter used to define Unicode in the plotchar function.
study("My Script", overlay=true)
emoji_1=  open<close
plotchar(emoji_1, title= "Emoji", char='☻️', location=location.belowbar)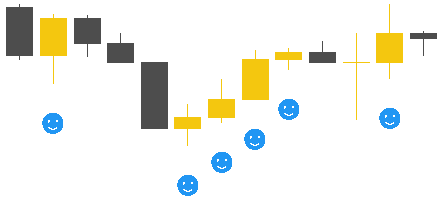
How to plot multi timeframe candlesticks on the same chart?
This is the best feature so far. If you don’t have premium version of tradingview, but you want to get access to multi timeframe on a single screen, then use this method and enjoy premium features free.
Plotcandle() is a feature that is used to plot multi timeframe candlesticks on the same chart. Let’s draw daily chart on any lower timeframe like 4H.
Remember: you can see higher timeframe candlesticks on lower timeframes, but you will not be able to get lower timeframe candlesticks on higher timeframe. There are a few limitations. You can only use daily, weekly or monthly higher timeframe to plot on lower timeframes.
- First define ohlc
- Security() function is used to get higher timeframe candlesticks
- plotcandle() function is used to higher timeframe candlesticks on lower TF chart
study("My Script", overlay=true)
symbol_info=input(defval="AUDUSD", type=input.symbol, confirm=true)
ohlc()=> [open, high, low, close]
[o,h,l,c] = security(symbol_info, resolution='1D', expression=ohlc())
plotcandle(open=o,high=h,low=l,close=c)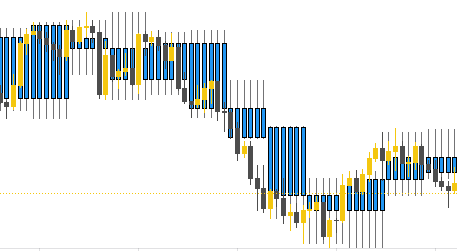
The above chart is 4H and daily candlestick has been shown on this chart in blue color. As there are 6 hourly candlesticks in a daily timeframe candlestick, that is why 6 candlesticks are shown.
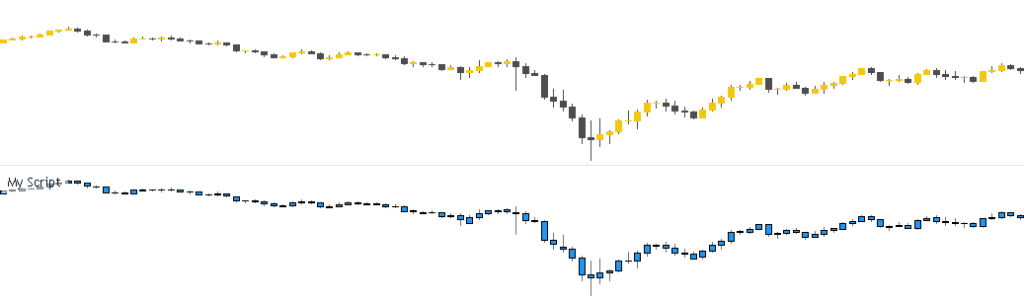
How to view more charts layout on single screen on tradingview free?
To get a chart in a separate window, write overlay equal to false. The program will remain the same as above. We will add input to a variable to change currency pair later from indicator settings. In the resolution parameter, write (timeframe.period) because this will also let you change timeframe according to the requirement.
//@version=4
study("My Script", overlay=false)
symbol_info=input(defval="AUDUSD", type=input.symbol, confirm=true)
ohlc()=> [open, high, low, close]
[o,h,l,c] = security(symbol_info, resolution='1D', expression=ohlc())
plotcandle(open=o,high=h,low=l,close=c)
Let’s execute the program. Congrats, you just get access to tradingview premium feature free. There are many other hacks too like to add more than three indicators on the same chart, but those will be discussed in the upcoming articles.
Note: All the viewpoints here are according to the rules of technical analysis. we are not responsible for any type of loss in forex trading.