
Introduction
Supply and demand: two simple words, but when it comes to trading, they hold a lot of power. Whether you’re dealing with stocks, forex, or cryptocurrencies, these forces play a big role. This cheat sheet is here to help.
Based on multiple resources, we’ve pulled together the key points about supply and demand in trading. Let’s dive in and make sense of how these factors move the market.
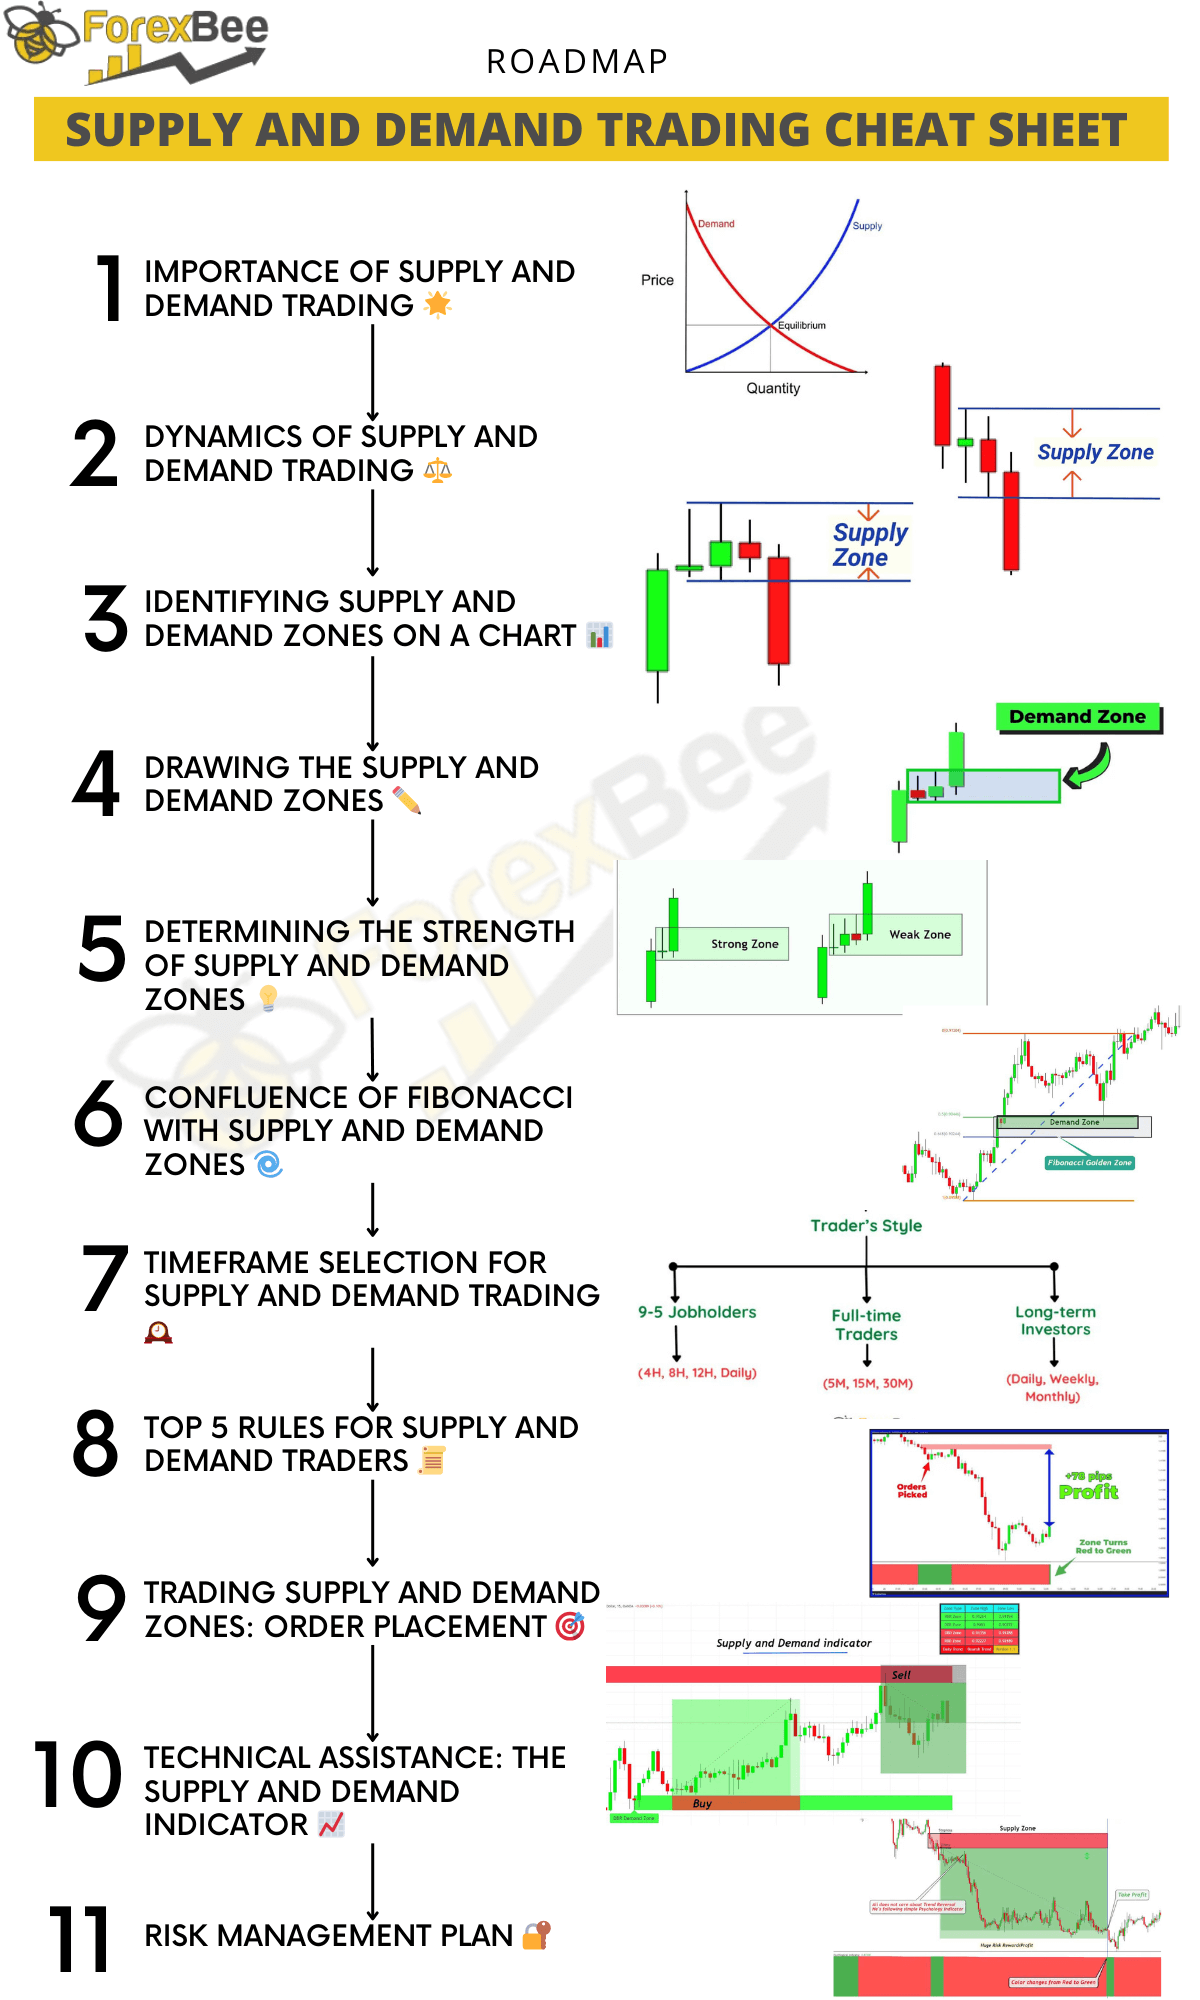
Here’s the complete roadmap to supply and demand trading mastery.
Roadmap to Mastering Supply and Demand Trading
- Laying the Groundwork 📚
- Importance of Supply and Demand Trading 🌟: Grasp why this strategy stands out in the trading world.
- Dynamics of Supply and Demand Trading ⚖️: Understand the underlying forces that drive these zones.
- Spotting and Drawing Zones 🔍
- Identifying Supply and Demand Zones on a Chart 📊: Learn the visual cues and patterns to look out for.
- Drawing the Supply and Demand Zones ✏️: Master the technique of marking these crucial areas on your charts.
- Analyzing Zone Strength and Confluence 💪
- Determining the Strength of Supply and Demand Zones 💡: Delve into factors that signal strong vs. weak zones.
- Confluence of Fibonacci with Supply and Demand Zones 🌀: Integrate Fibonacci tools to reinforce your zone identifications.
- Strategy Development and Implementation 🛠️
- Timeframe Selection for Supply and Demand Trading 🕰️: Choose the right timeframe aligning with your trading style.
- Top 5 Rules for Supply and Demand Traders 📜: Abide by these golden rules to elevate your trading game.
- Trading Supply and Demand Zones: Order Placement 🎯: Grasp the mechanics of setting your trades correctly.
- Technical Assistance and Continuous Learning 🤖
- Technical Assistance: The Supply and Demand Indicator 📈: Discover how this tool can automate and enhance your analysis.
- Risk Management Plan 🔐: Safeguard your investments by understanding and applying solid risk management principles.
- Reflect and Refine 🧘
- Conclusion 📝: Summarize your learnings, and stay committed to continuous improvement in the ever-evolving market
Importance
Supply and demand trading is more than just basic market principles. It’s a tool that can provide insights and guide traders in making decisions. Let’s look at why it’s so vital:
- Universal Concept: No matter where you trade – be it forex, stocks, or cryptocurrencies – supply and demand rules apply. It’s a universal truth in the trading world.
- Predict Price Movement: By understanding where the demand zones (buyers) and supply zones (sellers) are, traders can better predict where the price might go next.
- Low Risk, High Reward: Properly identifying these zones can help traders set up trades with a favorable risk to reward ratio.
- Clarity in Chaos: Markets can be unpredictable. Supply and demand zones provide clear areas of interest to watch, helping to reduce the noise and focus on what’s important.
- Consistent Results: While no strategy is foolproof, using supply and demand as a basis can offer more consistent results compared to some other strategies.
In short, mastering supply and demand trading can give traders an edge, offering clarity and a systematic approach in the often chaotic world of trading.
Dynamics of Supply and Demand Trading
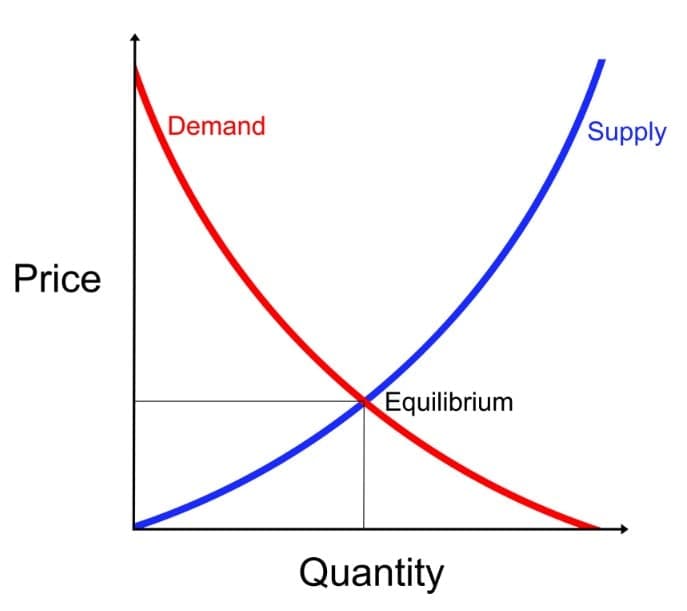
Supply and demand is a natural phenomenon governing prices of commodities, assets, and virtually everything in the market. At the core, when the demand for something rises beyond its supply, its value or price goes up. Conversely, if the supply overshadows demand, the price drops. This simple principle forms the backbone of trading.
Let’s dive deeper into these dynamics with real-life analogies and their technical counterparts.
Everyday Analogies of Supply and Demand
Imagine visiting a bakery early in the morning. Freshly baked bread has just been shelved. If there’s a limited number of loaves and a long queue of customers, the price of each loaf might be higher. As the day progresses and fewer customers come in, any remaining loaves might be sold at a discount.
Trading Parallel:
- Rising Prices: Likened to the morning rush for bread where demand surpasses supply.
- Falling Prices: Analogous to late afternoon discounts, where supply exceeds demand.
Technical Analysis Through Candlestick Patterns
Candlesticks are the graphical representation of price movements in trading. The shape, size, and pattern they form over time can indicate shifts in supply and demand.
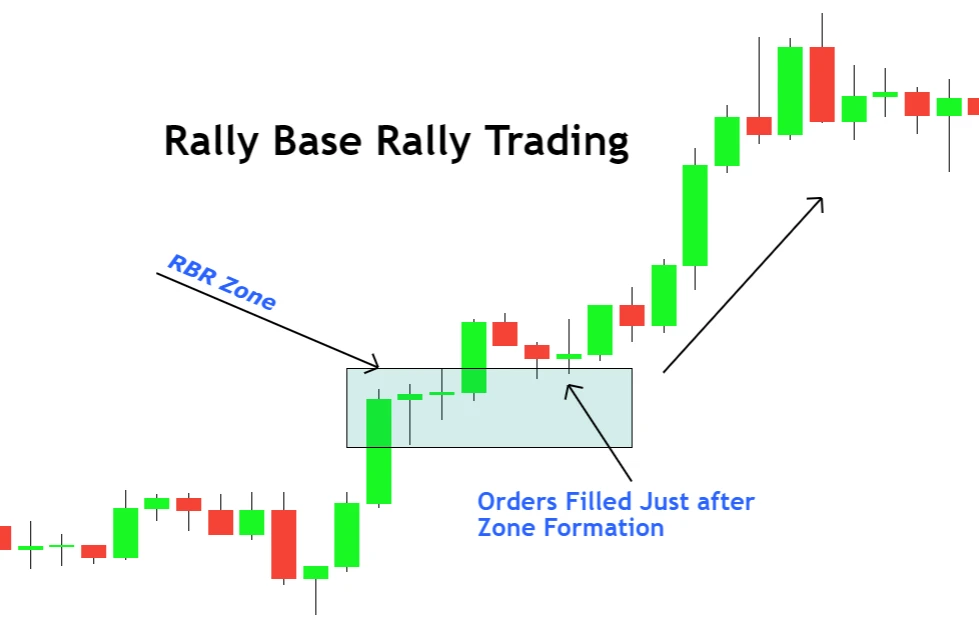
Rally Base Rally (RBR): Signifying Strong Buyer Momentum
- Pattern Breakdown: Upward move → Consolidation → Upward move.
- What It Indicates: A surge in buying interest.
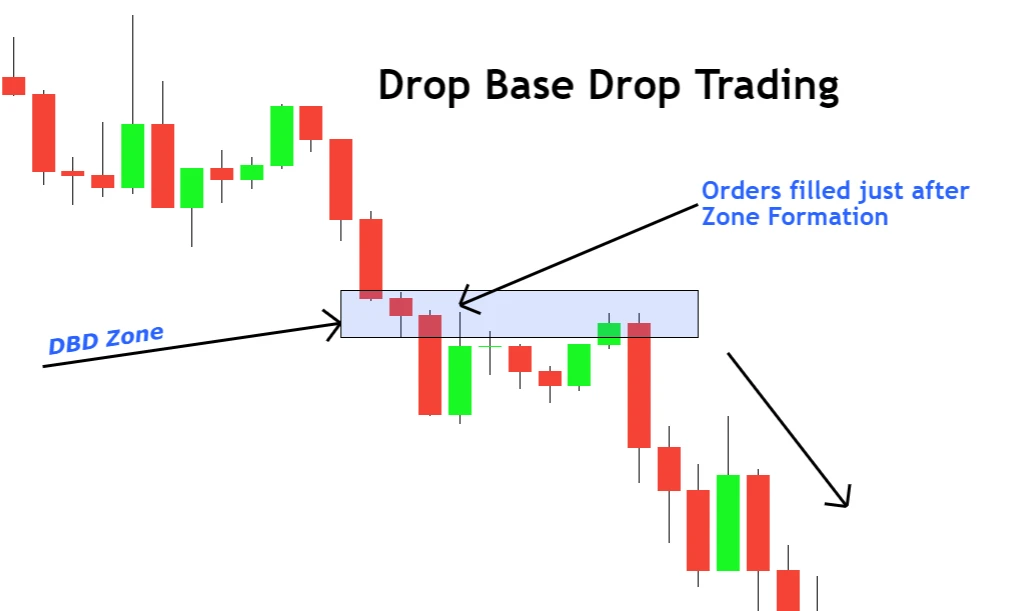
Drop Base Drop (DBD): Highlighting Seller Dominance
- Pattern Breakdown: Downward move → Consolidation → Downward move.
- What It Indicates: Overwhelming selling interest.
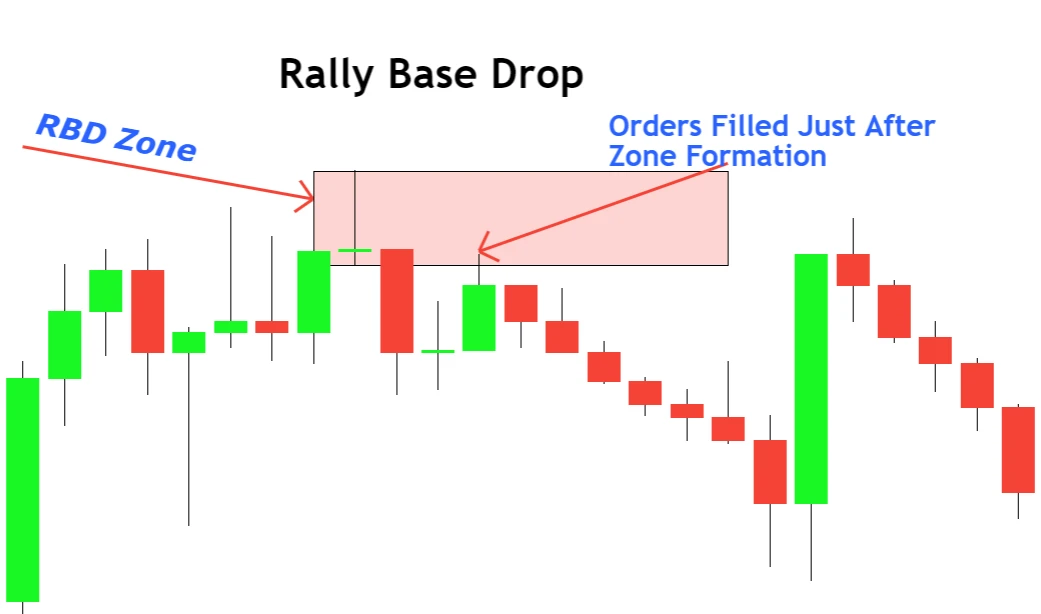
Rally Base Drop (RBD): From Buyers to Sellers
- Pattern Breakdown: Upward move → Consolidation → Downward move.
- What It Indicates: Sellers overpowering buyers.
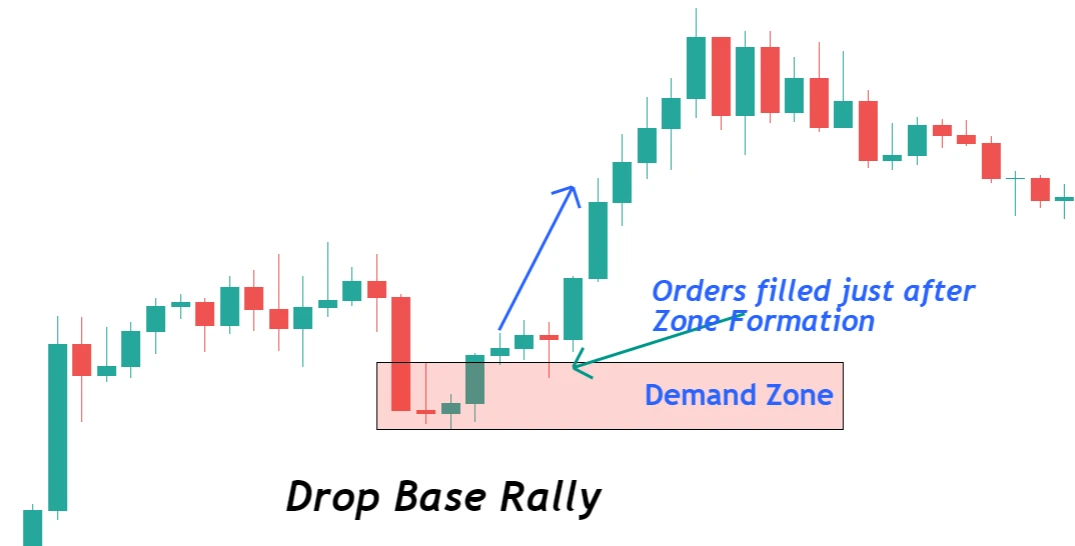
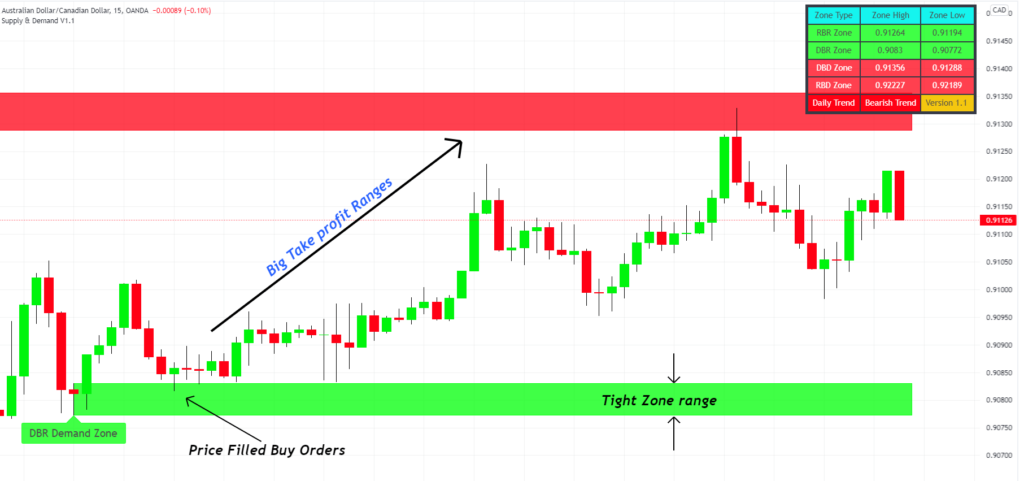
Drop Base Rally (DBR): The Buyer’s Comeback
- Pattern Breakdown: Downward move → Consolidation → Upward move.
- What It Indicates: An influx of buying, overpowering sellers.
This framework offers a dual perspective – the simplicity of everyday scenarios and the technical depth of candlestick patterns – enabling a holistic understanding of supply and demand in trading.
Identifying Supply and Demand Zones on a Chart
When delving into the intricacies of supply and demand in trading, it’s crucial to understand that these aren’t just pinpoint prices, but rather zones or regions on a chart. These zones indicate where there’s a significant amount of buying or selling interest, making them pivotal areas for traders to monitor.
Understanding Zones
A “zone” signifies a range in which there’s a clustering of buy or sell orders. These clusters aren’t at an exact price point but span across a range, which is why they’re termed ‘zones’.
Composition of Supply and Demand Zones
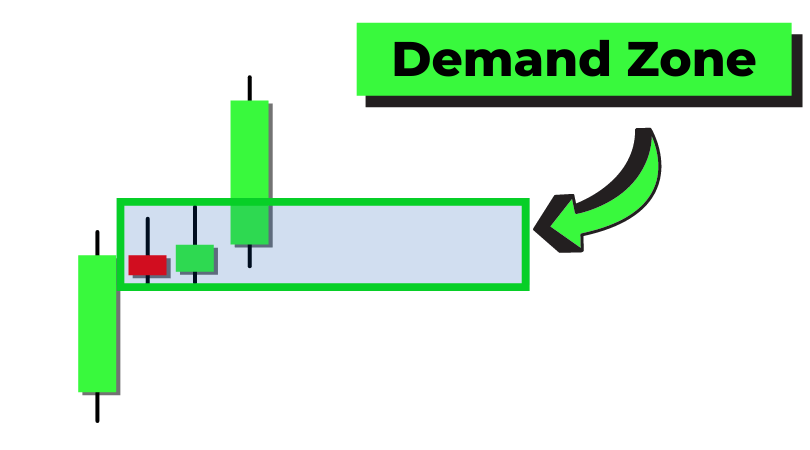
Demand Zones:
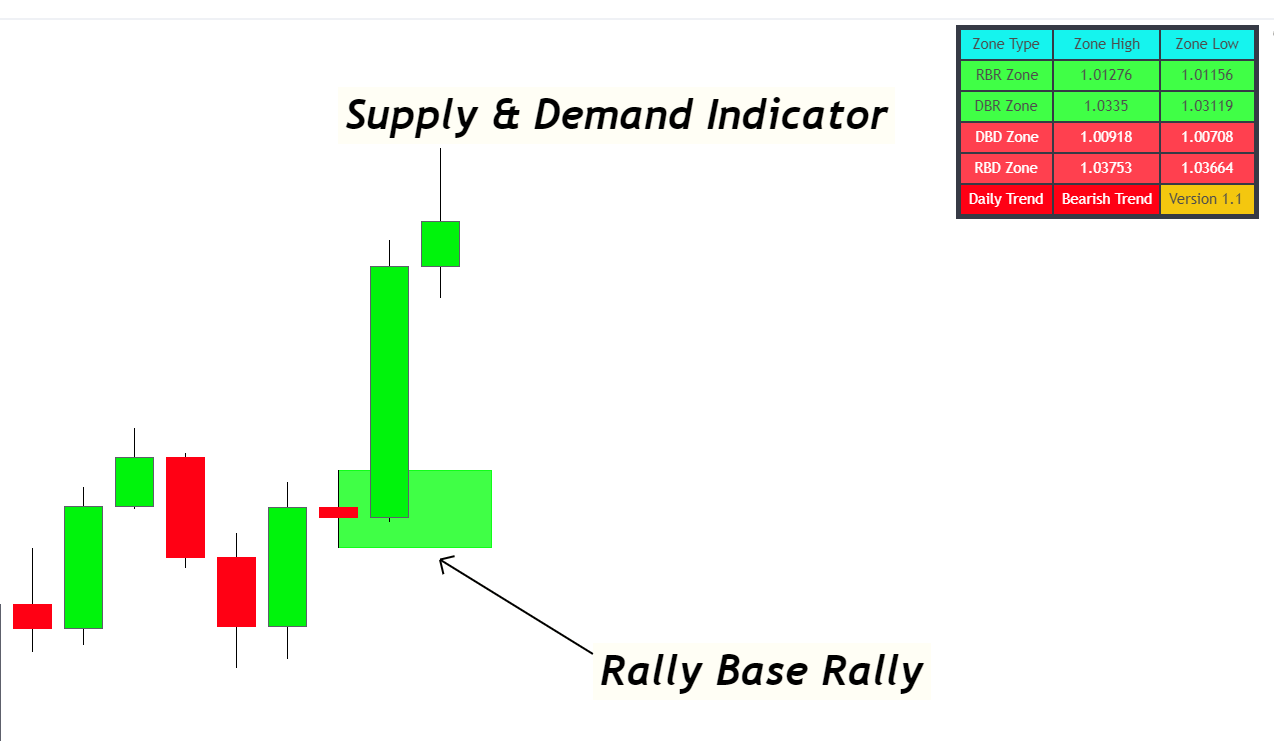
- Rally Base Rally (RBR):
- First Candlestick: A large bullish candle forms, showing the beginning of buying interest.Base Candlestick(s): One or multiple smaller candles appear, representing a period of market indecision with longer wicks.Final Rally Candlestick: Another bullish candle arises, confirming the strong presence of buyers.
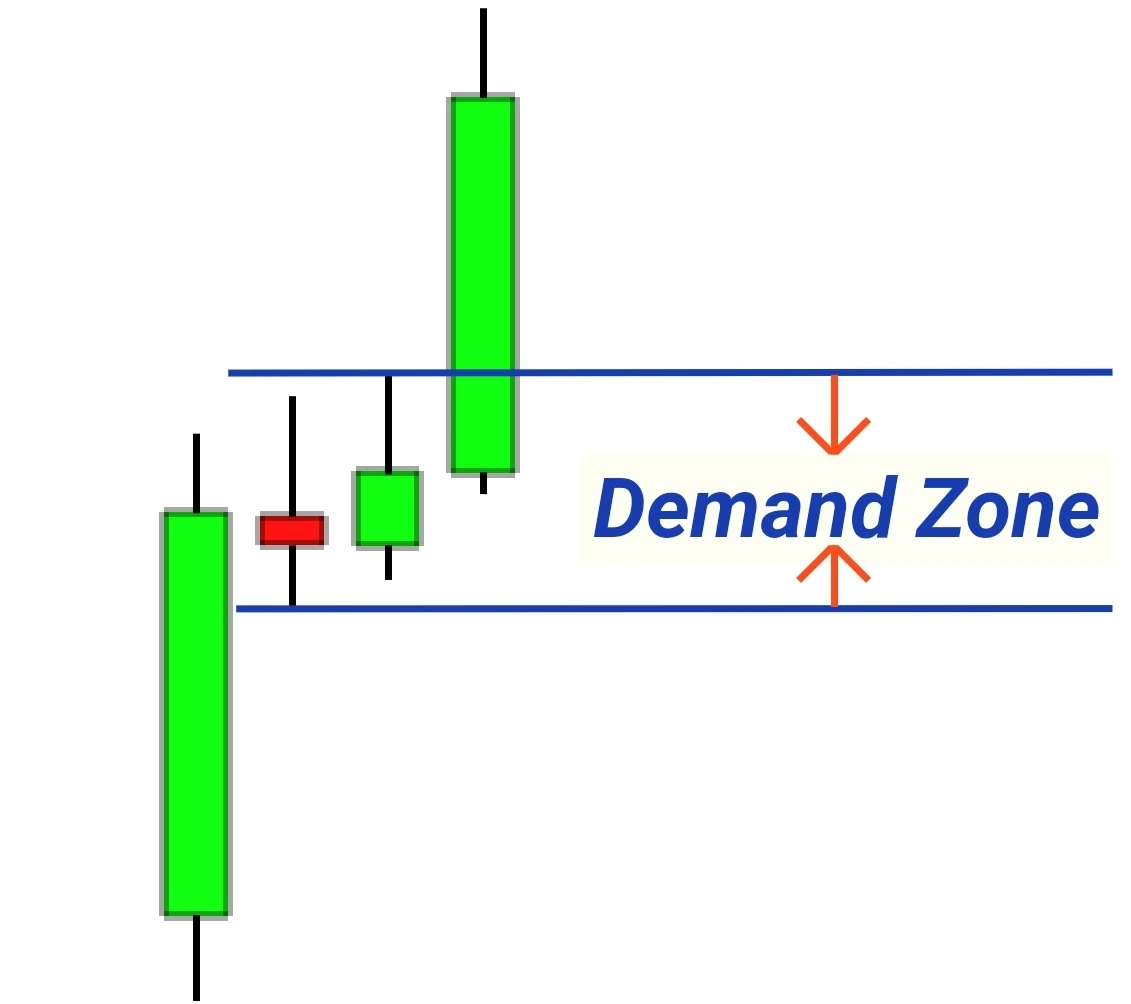
- Drop Base Rally (DBR):
- First Candlestick: A large bearish candle emerges, reflecting dominant selling interest.Base Candlestick(s): Small body candles like doji signal market indecision.Final Rally Candlestick: A bullish candle appears, demonstrating the comeback of buyers.
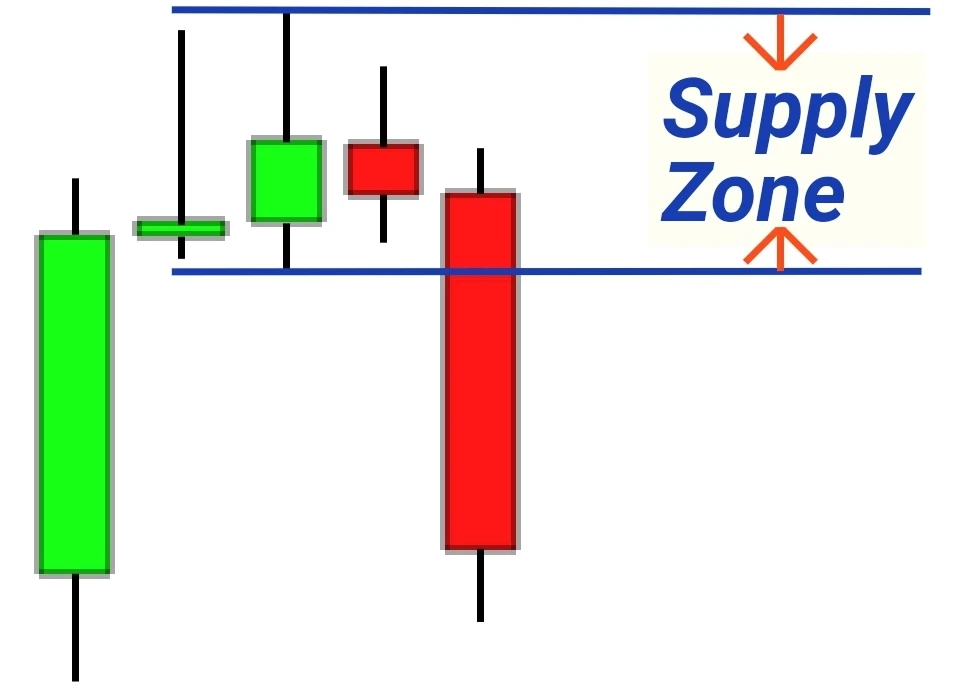
Supply Zones:
- Drop Base Drop (DBD):
- First Candlestick: A prominent bearish candle indicates the initiation of selling momentum.Base Candlestick(s): Small body candles materialize, representing market pause or a tug-of-war between buyers and sellers.Final Drop Candlestick: Another bearish candle confirms the dominating selling interest.
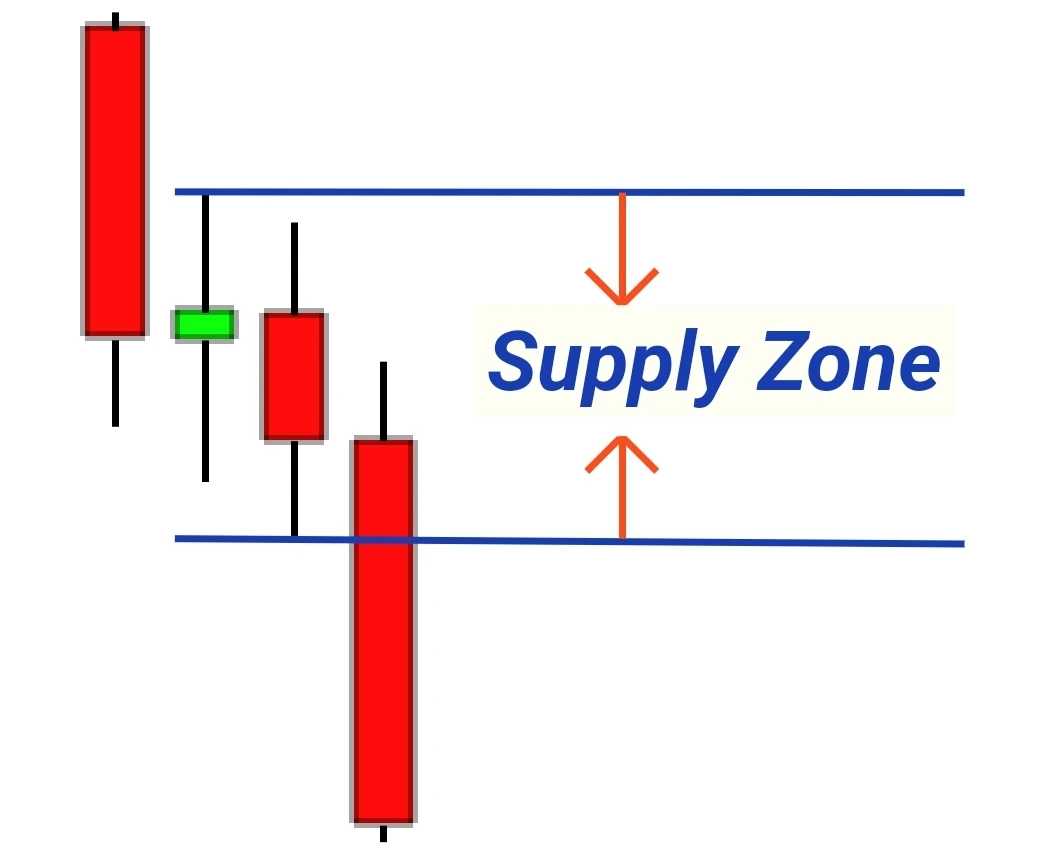
- Rally Base Drop (RBD):
- First Candlestick: A bullish candle signifies the initial buying interest.Base Candlestick(s): The market enters a phase of indecision with one or more smaller candles.Final Drop Candlestick: A bearish candle signals that sellers have now taken control.
Drawing the Supply and Demand Zones
To graphically represent these zones on a chart:
- Spot the Base Region: This is the area of consolidation between the rally and drop or vice-versa.
- Determine the High and Low: Within the base region, identify the highest and lowest price points.
- Draw the Zone: Use the high and low of the base region to sketch out your demand or supply zone.
The essence is to combine these candlestick formations to deduce where the zones of buying and selling interest lie. By identifying and understanding these zones, traders gain a clearer picture of potential market movements.
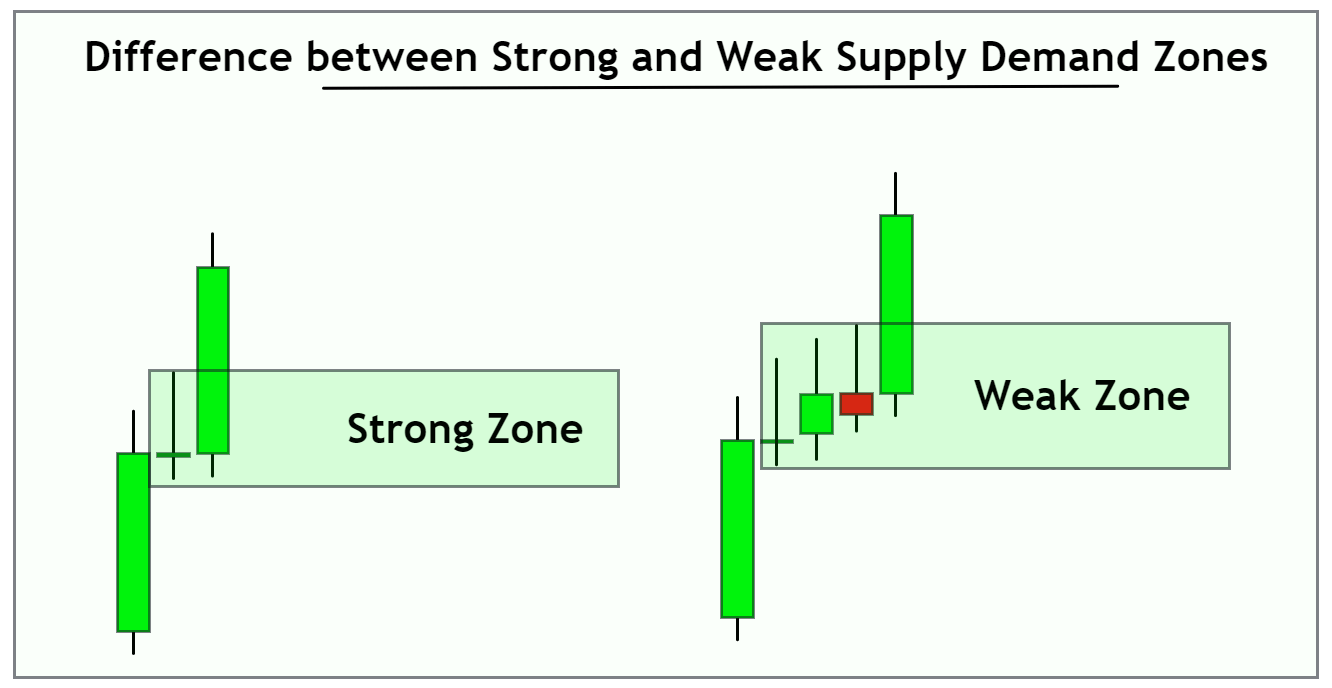
Determining the Strength of Supply and Demand Zones
A key component of successful supply and demand trading is the ability to differentiate between strong and weak zones. Not all zones are created equal, and understanding their strength can mean the difference between a profitable trade and a loss. Here’s a guide to help you discern:
- Key Levels:
- When a zone aligns with historically significant levels where price has shown strong reactions in the past, its strength is likely enhanced. These key levels have often acted as strong barriers for price in the past, indicating large imbalances in supply and demand.
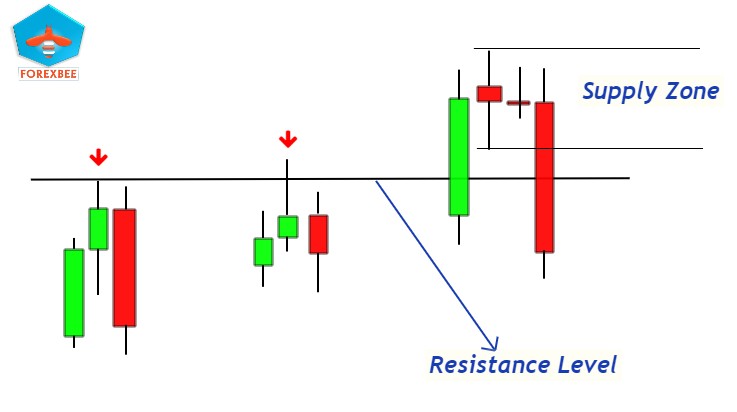
- Tip: Always cross-reference current zones with historical key levels. If there’s a confluence, the zone’s robustness might be amplified. This overlap signifies that the zone is not only influenced by recent supply and demand imbalances but also has the weight of historical trading decisions backing it.
- When a zone aligns with historically significant levels where price has shown strong reactions in the past, its strength is likely enhanced. These key levels have often acted as strong barriers for price in the past, indicating large imbalances in supply and demand.
- Time Spent at the Zone:
- If the price spends very little time within a zone before reversing, it’s a sign of a strong zone.
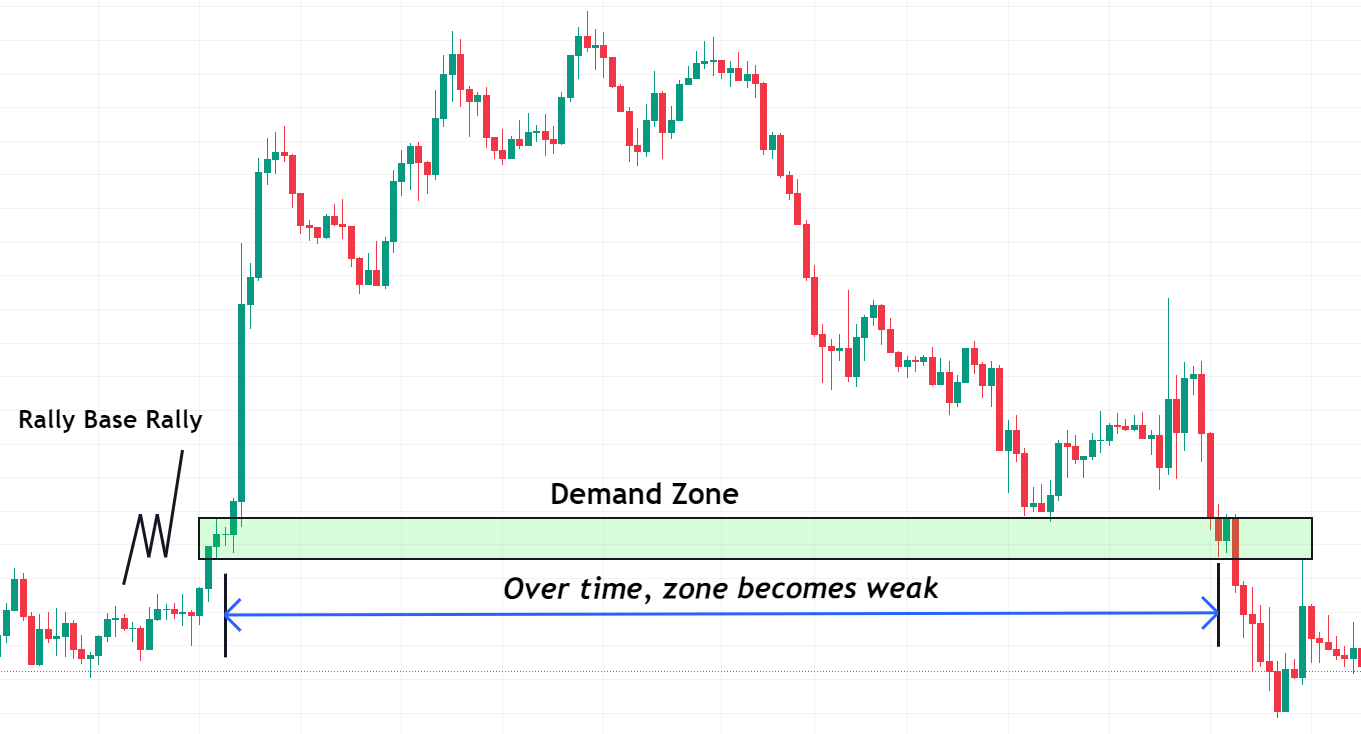
- Tip: Quick departures from zones are indicative of major imbalances in supply and demand, signifying zone strength.
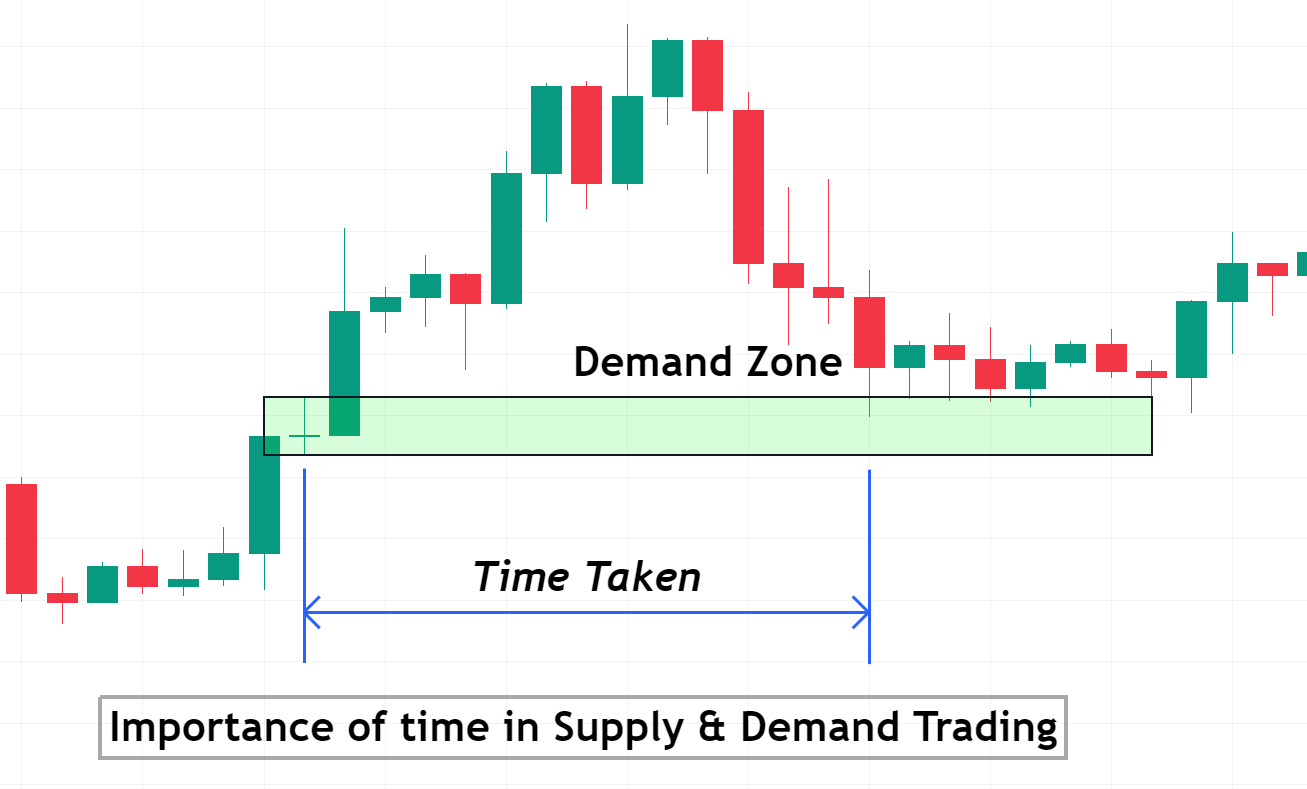
- If the price spends very little time within a zone before reversing, it’s a sign of a strong zone.
- Freshness of the Zone:
- A zone that hasn’t been revisited since its creation is often referred to as a “fresh zone”. These fresh zones tend to be stronger as there are likely still significant pending orders.
- Tip: Prioritize trading from fresh zones over ones that have been touched multiple times.
- Presence of Gaps:
- Gaps in price, where the price jumps without any trading occurring between, are indicators of very strong supply or demand. Gaps near or inside zones can increase the zone’s strength.
- Tip: Always take note of gaps; they’re a clear sign of supply and demand imbalances.
- Zone Width:
- Narrow zones can often indicate a stronger imbalance than wider zones. This is because the price couldn’t stay long at that level due to significant supply or demand.
- Tip: While narrow zones can be strong, ensure they have other indicators of strength to back them up.
By understanding and implementing these factors into your analysis, you can better navigate the charts and make more informed decisions.
Confluence of Fibonacci with Supply and Demand Zones
Confluence in trading refers to the coming together of more than one factors that support a trade decision. One of the most significant confluences in trading is when Fibonacci retracement levels align with supply and demand zones.
Why is this Confluence Important?
From your articles, it’s clear that combining the precision of Fibonacci retracement with the power of supply and demand zones can lead to high-probability trade setups. These overlapping zones provide traders with both an entry zone and a validation point, adding more weight to the decision to enter or exit a trade.
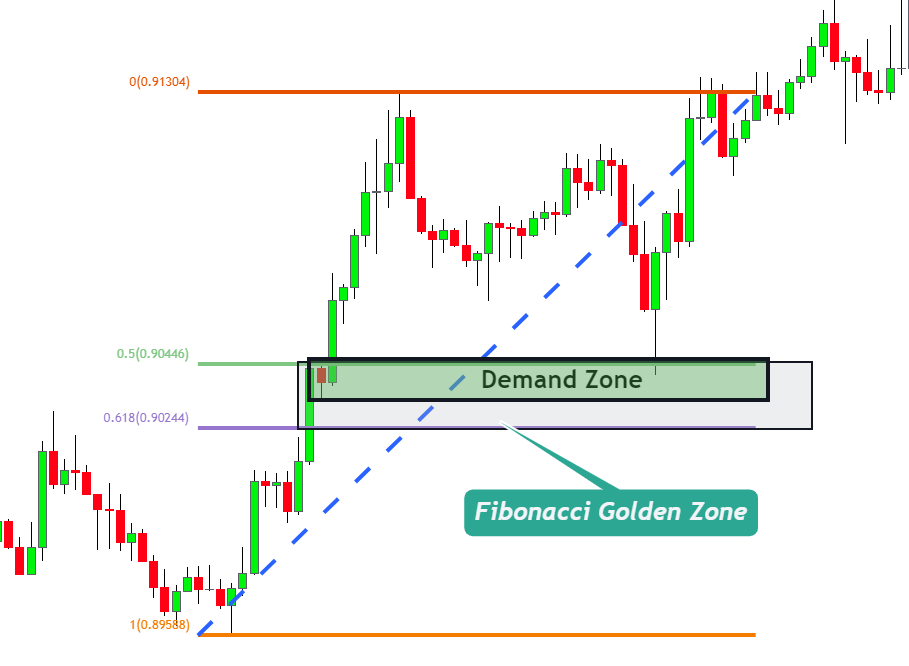
Golden Zone and Its Significance:
The “Golden Zone”, specifically, refers to the area between the 61.8% and 38.2% Fibonacci retracement levels. It’s termed “golden” because:
- This region is often viewed by traders worldwide as the most significant retracement area, making it a hotbed for trading activity.
- When a supply or demand zone forms right within this Golden Zone, it is considered a particularly potent signal. This is because the zone is now backed by both the natural imbalances of supply and demand and the collective belief in the importance of the Golden Zone.
Trading Tip:
Before entering a trade based on a supply or demand zone, check its position relative to major Fibonacci levels. If there’s a confluence with the Golden Zone, the trade setup might offer a higher winning probability.
Timeframe Selection for Supply and Demand Trading
Forex trading encompasses a broad spectrum of timeframes, from seconds to months. Not just limited to popular ones like 15M, 30M, or 1D, but also includes unconventional ones like 16M, 17M, or 18M. Each timeframe offers a unique market narrative, and supply and demand principles apply across the board.
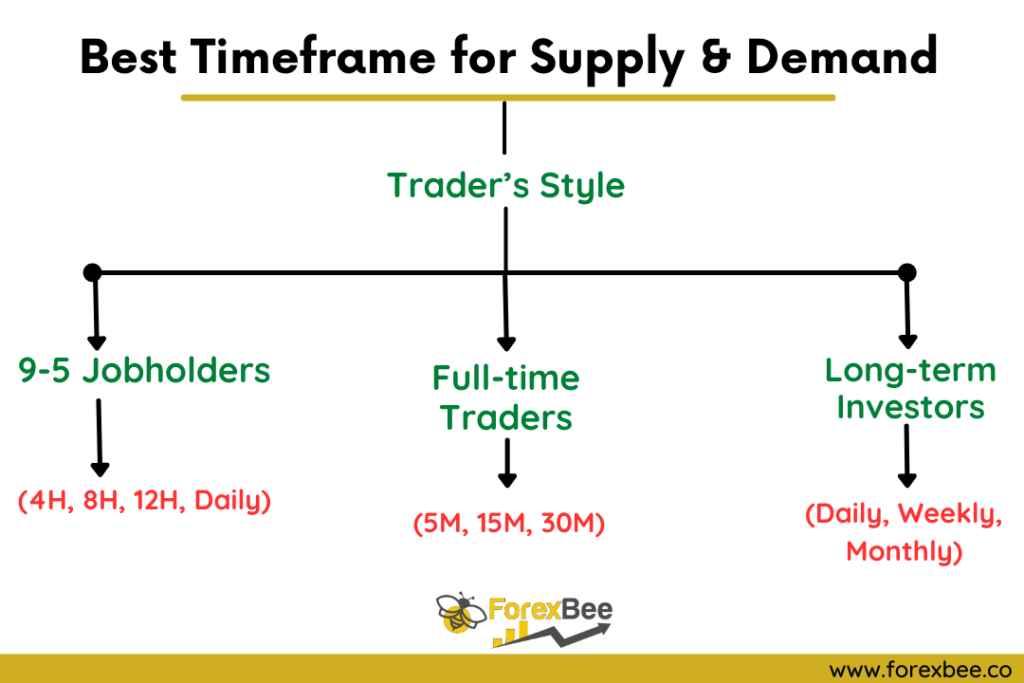
1. Choosing Based on Lifestyle and Objective:
- 9 to 5 Jobholders: Prefer longer timeframes (4H, 6H, or 8H) to avoid rushed decisions and fit trading around job hours.
- Full-time Traders: Shorter timeframes like 15M capitalize on quick market movements, as they’re consistently monitoring.
- Long-term Investors: Opt for daily, weekly, and monthly charts to get a broader market perspective for extended strategies.
2. Profit Potential Across Timeframes:
- Short Timeframes: Target swift profits with smaller investments but can be more stressful.
- Medium Timeframes: Ideal for side trading alongside regular jobs. Offers balance between capital and time flexibility.
- Long Timeframes: Suited for patient traders with more extensive capital, targeting substantial returns over time.
Top 5 Rules for Supply and Demand Traders
Supply and demand trading can be highly effective when done right. As you navigate this strategy, there are a few essential rules to keep in mind. These will not only help guide your trades but also increase your chances of consistent success.
- Understanding Supply and Demand Zones: Zones are regions, not exact price points. Patterns like RBR and DBR indicate demand, while RBD and DBD signal supply. Remember, multiple candles can make up the base region.
- Historical Price Reaction: Look at past price data. Zones that align with past key levels are often stronger and more reliable.
- Incorporate Confluence with Fibonacci: When a zone matches a significant Fibonacci level, especially the golden ratio, it’s likely a stronger trading signal.
- Timeframe Selection: Choose a timeframe that fits your life and trading style. If you work full-time, longer charts might be better. If you trade full-time, shorter charts might suit you.
- Consistent Risk Management: Set clear rules for entering and exiting trades. Good risk management is key to profitable trading, even with a top-notch strategy.
By adhering to these rules, traders can navigate the complexities of supply and demand trading with greater confidence and clarity.
Trading Supply and Demand Zones: Order Placement
Understanding the mechanics of the supply and demand zones is crucial, but it’s equally important to know how to practically execute trades based on these zones. Let’s delve into the specifics of trading each pattern:
1. Rally Base Rally (RBR) – Buying from a Demand Zone
- Pattern Identification: Spot the sequence – a prominent bullish candlestick (rally), followed by one or more small-bodied candlesticks or doji-like formations (base), and then another bullish move (rally).
- Zone Plotting: Draw the demand zone using the high and low of the base region.
- Trade Execution:
- Buy Limit Order: Place a buy limit order slightly above the high of the demand zone. This ensures that when the price revisits the zone, your buy order will be automatically triggered.
- Stop Loss: Set a stop loss just below the low of the demand zone to safeguard against unexpected downward price movements.
2. Drop Base Drop (DBD) – Selling from a Supply Zone
- Pattern Identification: Start by identifying a pronounced bearish candlestick (drop), followed by one or more small-bodied candlesticks or dojis (base), culminating in another bearish move (drop).
- Zone Plotting: Mark the supply zone using the high and low boundaries of the base region.
- Trade Execution:
- Sell Limit Order: Position a sell limit order slightly below the low of the supply zone. Thus, when price approaches the zone, your sell order is auto-triggered.
- Stop Loss: To limit potential losses, set a stop loss just above the high of the supply zone.
3. Rally Base Drop (RBD) – Selling into a Supply Zone
- Pattern Identification: Detect a clear bullish candlestick (rally), succeeded by one or more small-bodied candles or dojis (base), and then a bearish descent (drop).
- Zone Plotting: Sketch the supply zone using the high and low limits of the base area.
- Trade Execution:
- Sell Limit Order: Install a sell limit order a tad below the low of the supply zone, ensuring automatic sell execution as the price touches the zone.
- Stop Loss: Position a stop loss slightly above the high of the supply zone to protect from unforeseen bullish reversals.
4. Drop Base Rally (DBR) – Buying from a Demand Zone
- Pattern Identification: Observe a marked bearish candlestick (drop), leading to one or more small-bodied candles or dojis (base), and then transitioning into a bullish surge (rally).
- Zone Plotting: Outline the demand zone, taking into consideration the highest and lowest points of the base.
- Trade Execution:
- Buy Limit Order: Set a buy limit order just above the high of the demand zone. This guarantees that as the price re-enters the zone, the buy order is set into motion.
- Stop Loss: To counteract any unforeseen bearish movements, fix a stop loss just below the low of the demand zone.
By methodically following these steps for each pattern, traders can navigate supply and demand zones with precision and confidence.
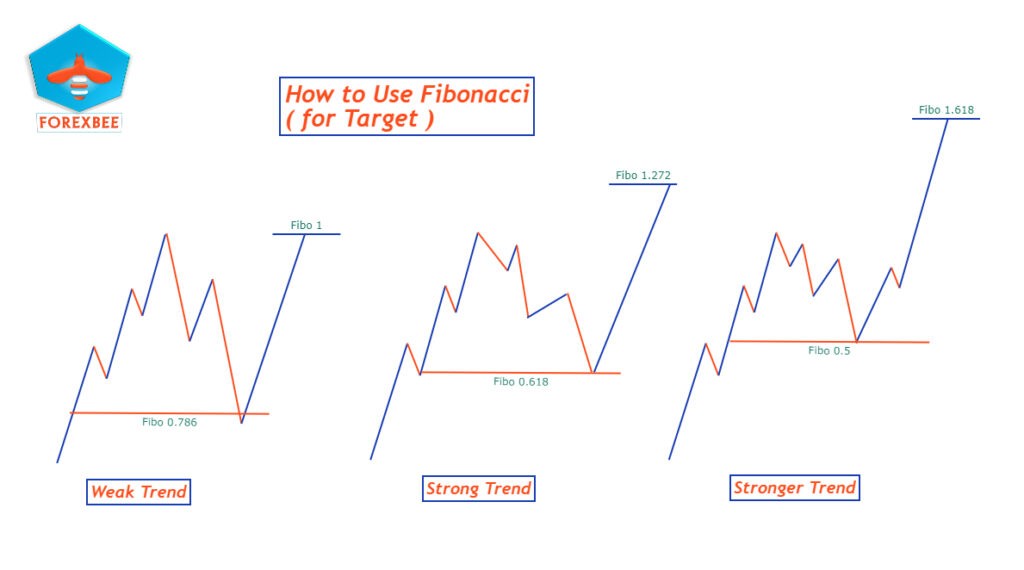
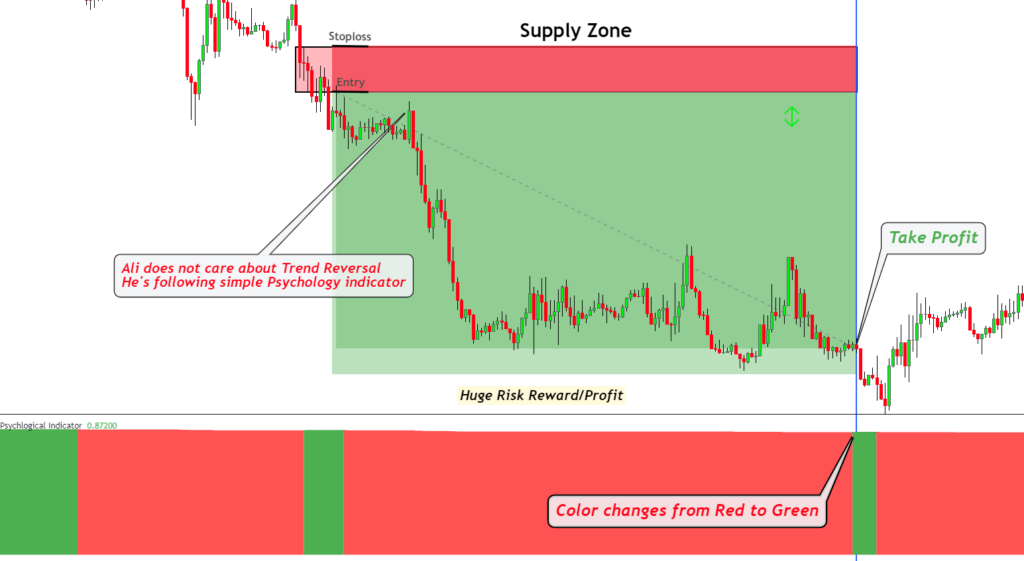
Take Profit Strategy
To decide when to close your trade and take your profit, you can use tools like moving averages or the RSI indicator. They’ll show you potential changes in the market trend or if it’s overbought or oversold
However, for those looking to master the art of holding onto trades for larger profits, we’ve developed a specialized psychological indicator. This unique tool is designed to harness the power of market psychology, assisting traders in making more informed decisions about when to exit trades. By understanding the collective mindset of the market, you can better anticipate major price moves and capitalize on them.
Note: This game-changing psychological indicator, along with our refined strategy, is exclusive to our premium supply and demand package. If you’re serious about elevating your trading game, consider investing in this premium tool. It’s a step towards more informed, strategic, and profitable trading.
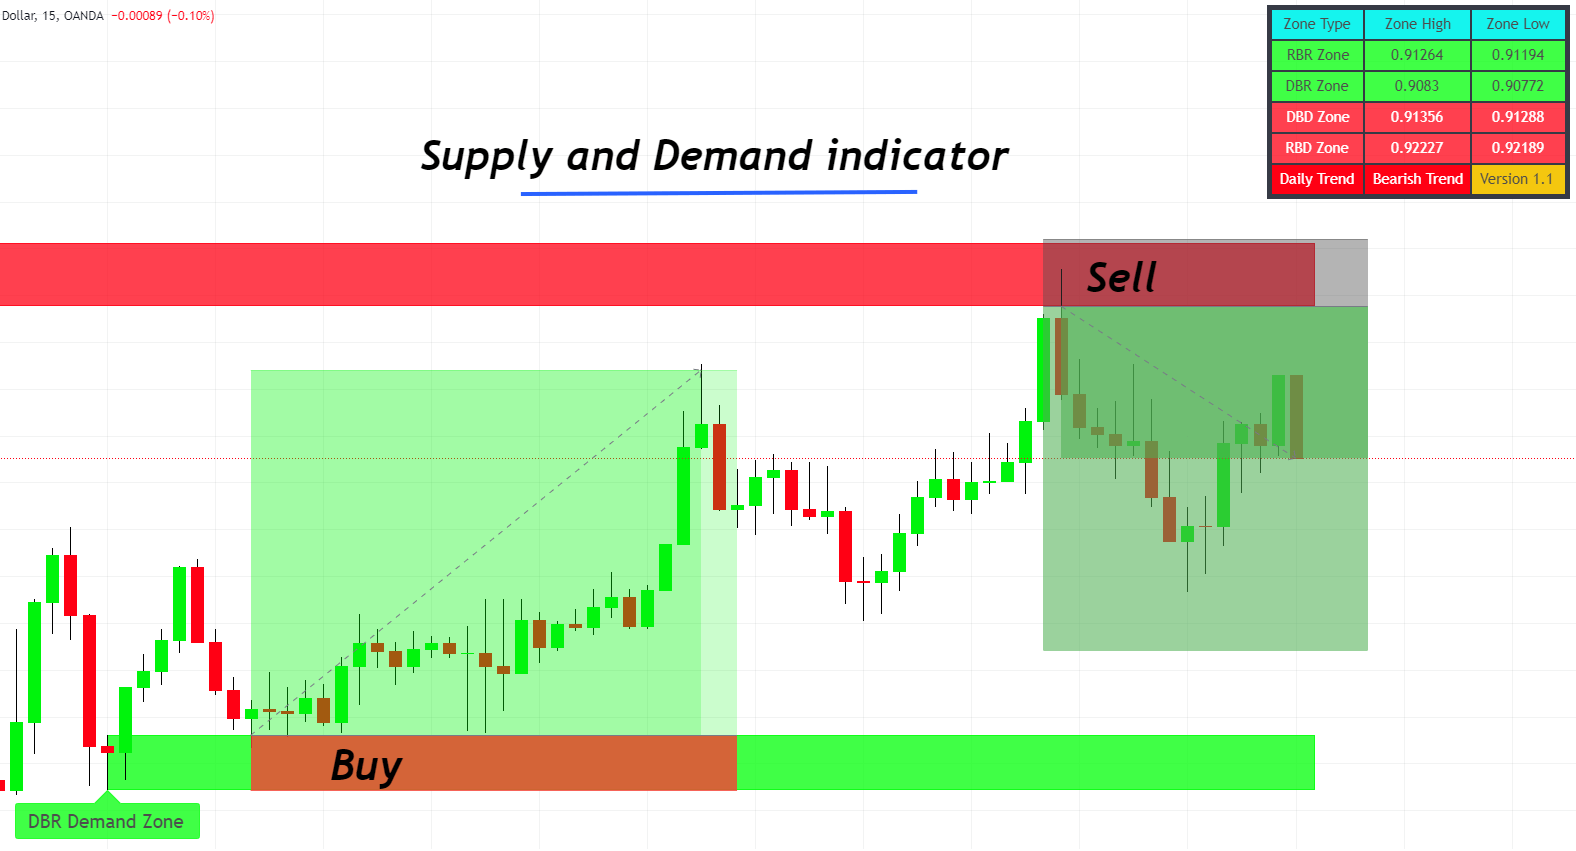
Technical Assistance: The Supply and Demand Indicator
Navigating the financial markets with supply and demand zones can become more straightforward with the right tools. One such essential tool is the supply and demand indicator, designed specifically to highlight potential trading zones based on historical price action and real-time market movements.
Features of the Supply and Demand Indicator:
- Zone Highlighting: The indicator automatically plots supply and demand zones on your chart, making it easier to identify potential trade setups.
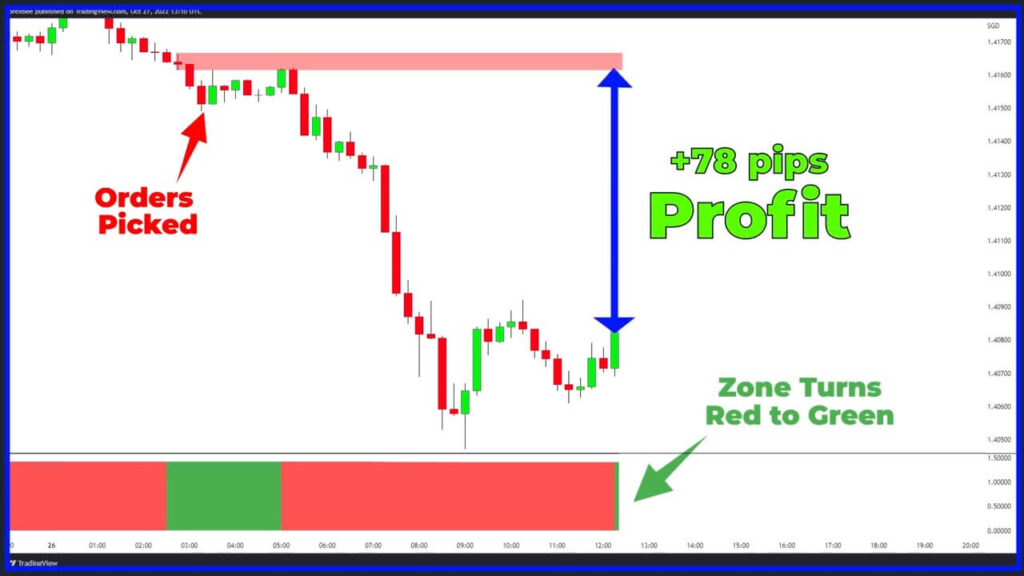
- Historical Analysis: By looking at past price reactions, the indicator can highlight historically significant zones.
- Real-time Alerts: Get notified when price approaches or touches a marked zone, enabling timely trade decisions.
- Compatibility: Works seamlessly with various timeframes, giving traders the flexibility to choose based on their strategy.
Complementary Course and eBook:
To further assist traders, the supply and demand indicator comes with an exclusive course. This course covers:
- Detailed explanations of the supply and demand strategy.
- Real-life trading examples and case studies.
- Tips and tricks to maximize the indicator’s potential.
Moreover, the package includes a comprehensive PDF eBook. This eBook is designed to:
- Serve as a quick reference guide for on-the-go traders.
- Provide deeper insights into the nuances of supply and demand trading.
- Offer practical advice on combining the indicator with other technical analysis tools.
Investing in this indicator, coupled with the course and eBook, provides traders a complete package to master the art of supply and demand trading.
Risk Management Plan
Achieving consistent profits in supply and demand trading requires a diligent risk management plan. The essence of risk management isn’t just about pinpointing entry and exit points; it’s about determining the proportion of your capital to risk on each trade. Employing a robust risk management approach distinguishes successful traders from those who face substantial losses.
Understanding Risk-Reward Ratios:
At the heart of risk management is the concept of the risk-reward ratio. This ratio showcases the potential profit in relation to the potential loss of a trade. Through adept management of this ratio, traders can sustain a sequence of losses yet maintain a profitable standing over time.
Recommended Risk Percentage and Asset Selection:
| Trading Style | Recommended Risk % Per Trade | Recommended Number of Financial Assets/Currency Pairs |
|---|---|---|
| Day Trading | 0.5% – 1% | 1-3 |
| Swing/Long Term | 1% – 2% | 10+ |
This table provides a guideline for traders based on their trading style. Day traders, who often make multiple trades within a single day, should ideally limit their focus to 1-2 financial assets or currency pairs to manage risk and stay updated with asset-specific news. On the other hand, swing or long-term traders, who hold positions for several days or even weeks, can diversify their portfolio by trading in multiple assets, like 10+ currency pairs or other financial instruments.
Example of Risk-Reward Management:
Suppose you decide to risk only 0.5% of your trading account on a single trade. With a 1:10 risk-reward ratio and a successful outcome, your account can see a 5% uplift. However, even if you encounter losses in the subsequent nine trades, each costing you 0.5%, the impact on your account would look like this:
Here’s how the numbers work out:
| Trade Number | Risk % | Risk-Reward Ratio | Profit/Loss % | Cumulative Account Change |
|---|---|---|---|---|
| 1 | 0.5% | 1:10 | +5% | +5% |
| 2 | 0.5% | N/A | -0.5% | +4.5% |
| 3 | 0.5% | N/A | -0.5% | +4% |
| 4 | 0.5% | N/A | -0.5% | +3.5% |
| 5 | 0.5% | N/A | -0.5% | +3% |
| 6 | 0.5% | N/A | -0.5% | +2.5% |
| 7 | 0.5% | N/A | -0.5% | +2% |
| 8 | 0.5% | N/A | -0.5% | +1.5% |
| 9 | 0.5% | N/A | -0.5% | +1% |
| 10 | 0.5% | N/A | -0.5% | +0.5% |
Net Profit: +0.5%
From the table, it’s evident that even with nine straight losses after a single win, the trader stays in a positive position, all thanks to a robust risk-reward strategy.
Conclusion
Supply and demand trading is a potent strategy rooted in the fundamental principles of economics. It offers traders a structured approach to the market, providing clarity on entry and exit points, potential profit zones, and areas of risk.
In simple terms, the supply and demand trading strategy can be a game-changer for traders. But what really boosts its power is the supply and demand indicator. This tool does most of the heavy lifting, handling about 80% of the trading work for you. So, if you’re looking for a way to make your trading strategy more profitable, this indicator is a must-have. It’s like having a trusty sidekick that helps you make better trading decisions.
In essence, supply and demand trading is more than just a methodology. It’s an integrated system of techniques, tools, and disciplines. When these elements converge effectively, they pave the way for consistent, long-term profitability in the trading arena. Success, then, is not just about mastering the charts, but also about mastering oneself, one’s decisions, and one’s approach to risk.