
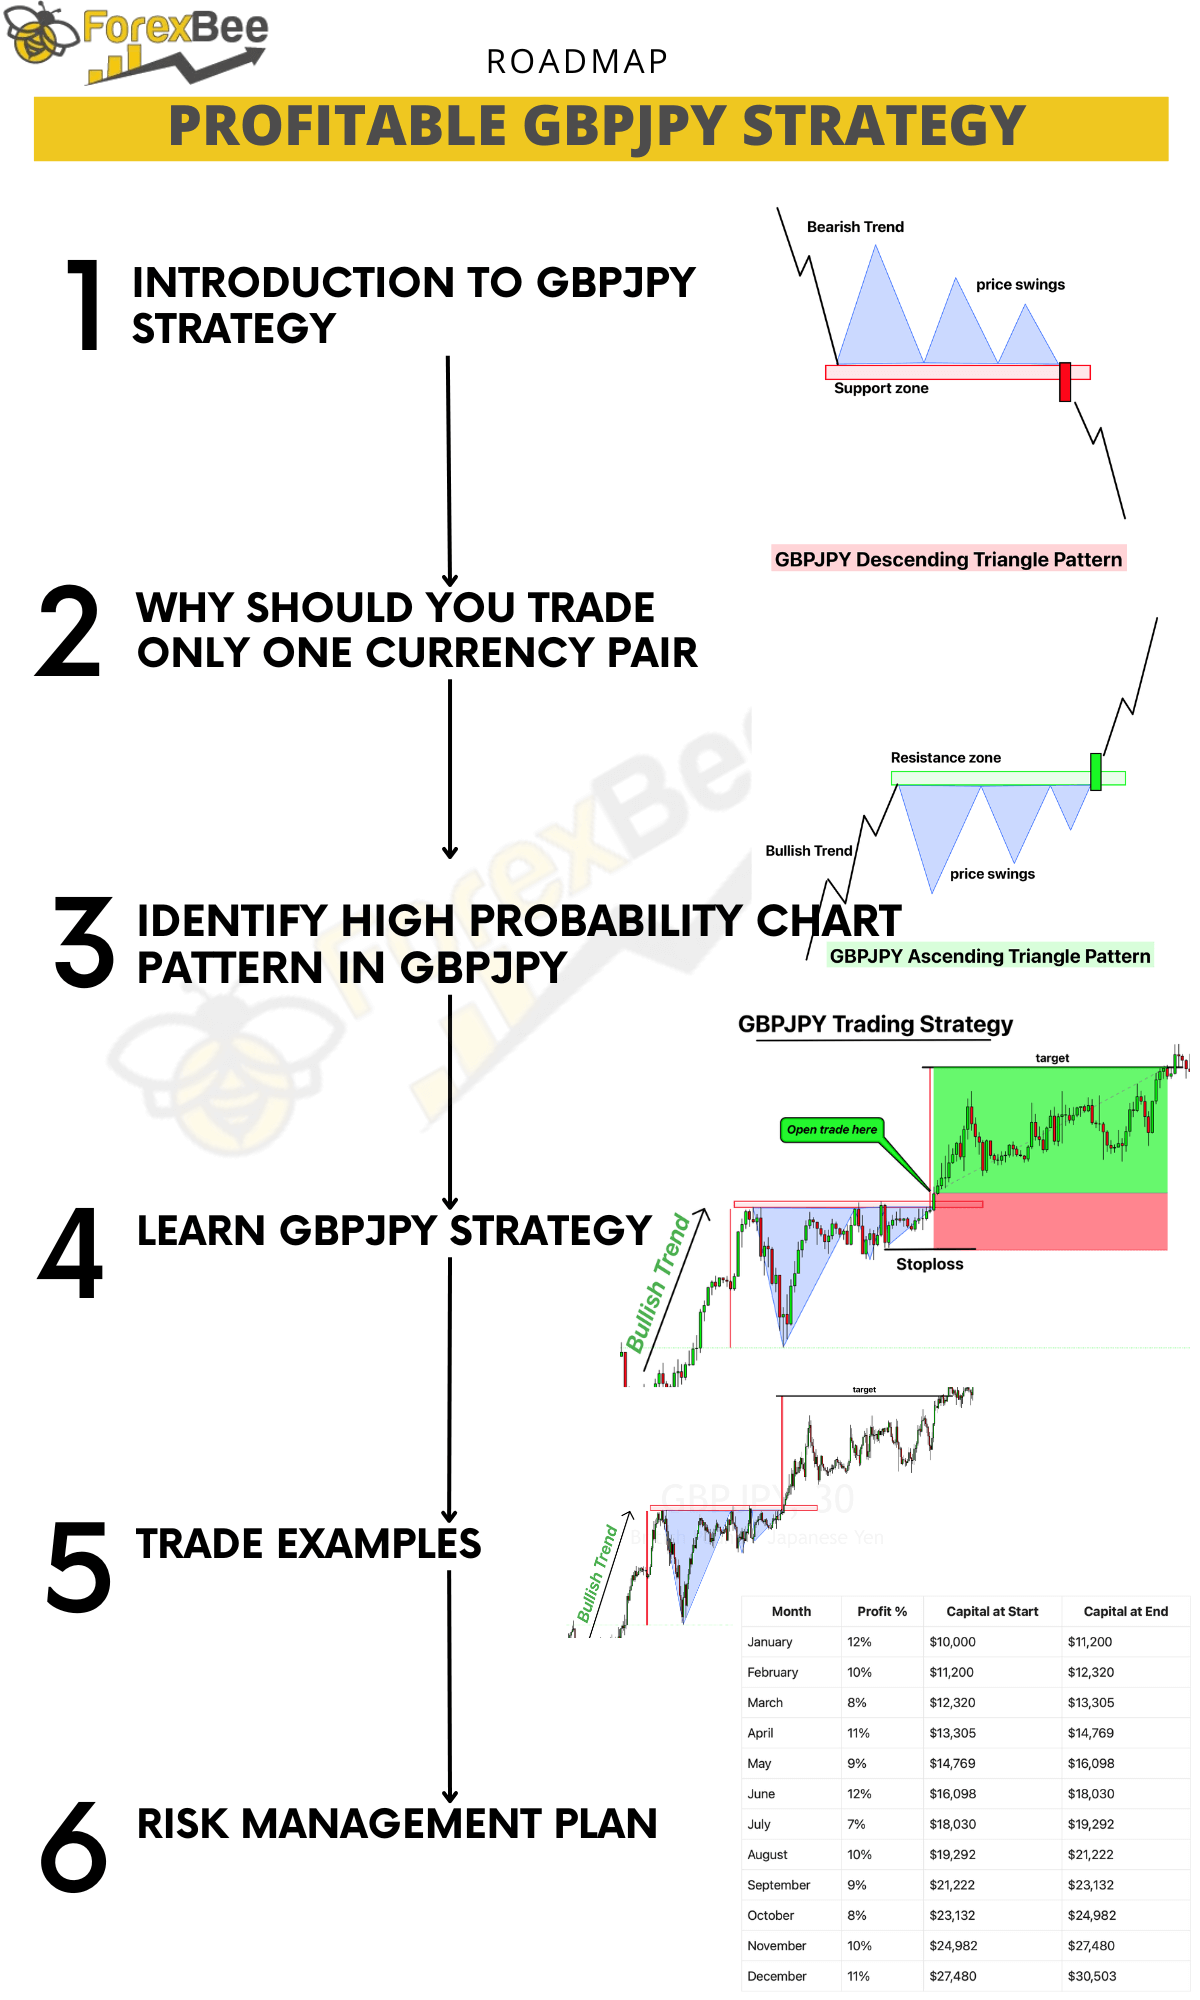
Each currency pair in the world of forex trading carries its own unique traits, and the GBPJPY is no exception, boasting numerous distinct patterns that consistently yield positive results.
In this guide, I’m going to show you a chart pattern that comes up a lot in the GBPJPY pair, and it’s something you can use to your advantage in trading. I’ve also got some backtest results to share, making it easier for you to see how this can work in real trading.
Make sure you read the whole article and don’t skip any parts. Understanding this strategy completely could mean more money in your trading account every month. So, let’s get started and learn how to make the most out of GBPJPY!
Why should you trade a single currency pair?
Focusing on just one currency pair and sticking to a single chart pattern with clear rules can significantly boost your trading psychology, leading to better performance and consistency in the market.
Many traders in the forex world face losses, sometimes substantial ones, which can lead to quitting trading altogether. A major challenge for them is managing their trading psychology. The internet is filled with stories of accounts doubling in a month, but take it with a grain of salt—those stories often come from traders who might not stay profitable in the long run. Trading is about strategy and analysis, not just luck like gambling.
This is why I am eager to share a specific trading strategy with you. It’s designed for traders who might still be finding their focus or who might be struggling with the psychological aspects of trading. By narrowing your attention to just one currency pair and one strategy, you cultivate focus and clarity in your trading practice.
Which chart pattern works in GBPJPY trading?
I’ve spent a lot of time looking at charts, and I like to compare them to patterns in nature to find something that repeats over time. With GBPJPY, I’ve noticed that it often forms two specific patterns on the chart: ascending triangle and descending triangle Patterns.
What makes GBPJPY special is that these triangle patterns are very reliable, with a winning ratio of more than 90%. It’s not often that these setups lead to a losing trade; in fact, most of the time, they result in a win. After noticing this pattern, I put together a trading strategy that I’ll share with you later.
But before we get into the strategy, let’s talk more about these triangle patterns and what makes them unique. This way, you can learn to spot the real deal and avoid the false patterns that might trip you up.
How to identify the GBPJPY chart patterns precisely?
Understanding how to accurately identify GBPJPY chart patterns is crucial for successful trading. Let’s start with a simple example to help illustrate this, and then we’ll move on to applying it to the real GBPJPY currency chart.
Imagine a child tossing a ball to the ground. It bounces up and down, and each bounce gets a bit smaller until the ball finally stops moving. The GBPJPY market acts in a similar way. When a lot of buyers or sellers hit a strong price point, it creates waves in the market. These waves get smaller and smaller until the price finally breaks through the strong point and shoots up or down with a lot of power. This is characteristic of the GBPJPY currency pair.
Spotting chart patterns in GBPJPY can be made simpler with a structured approach. Here’s a breakdown to help you identify the key patterns with ease:
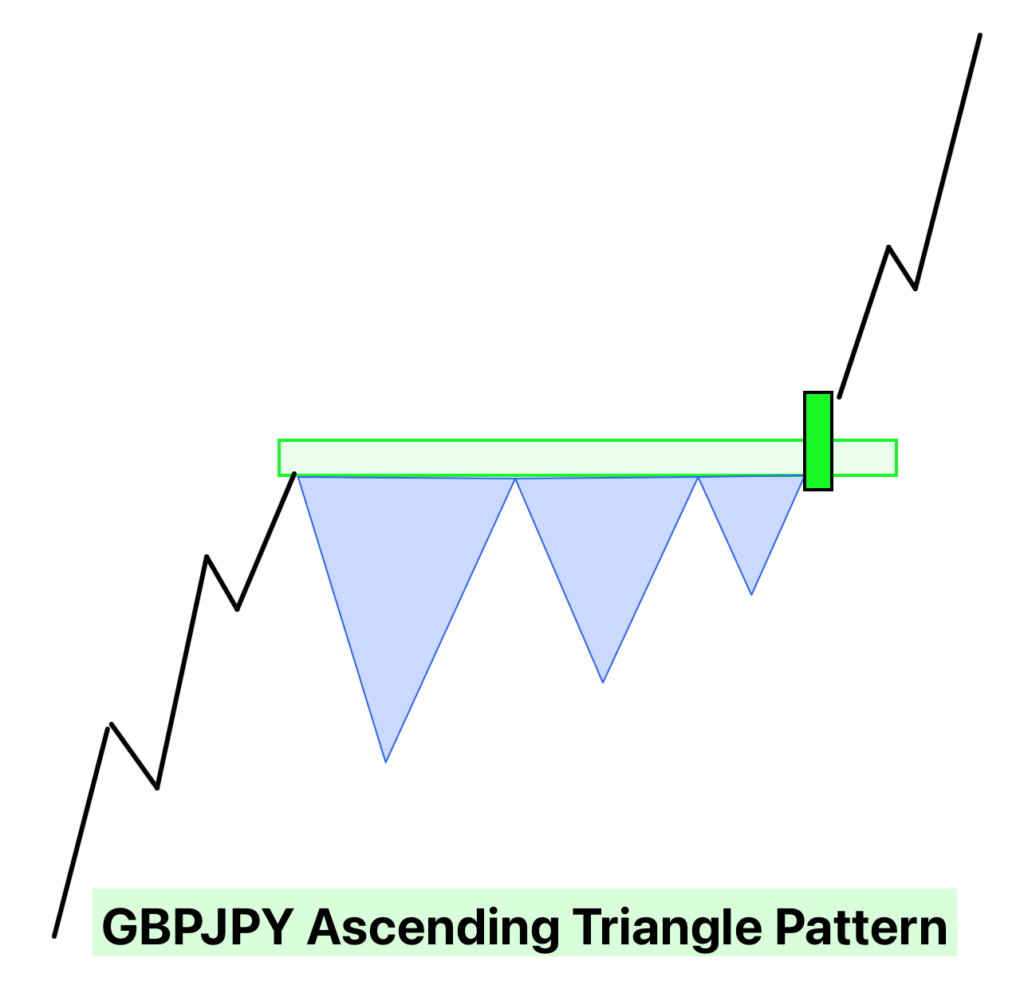
1. Ascending Triangle Pattern:
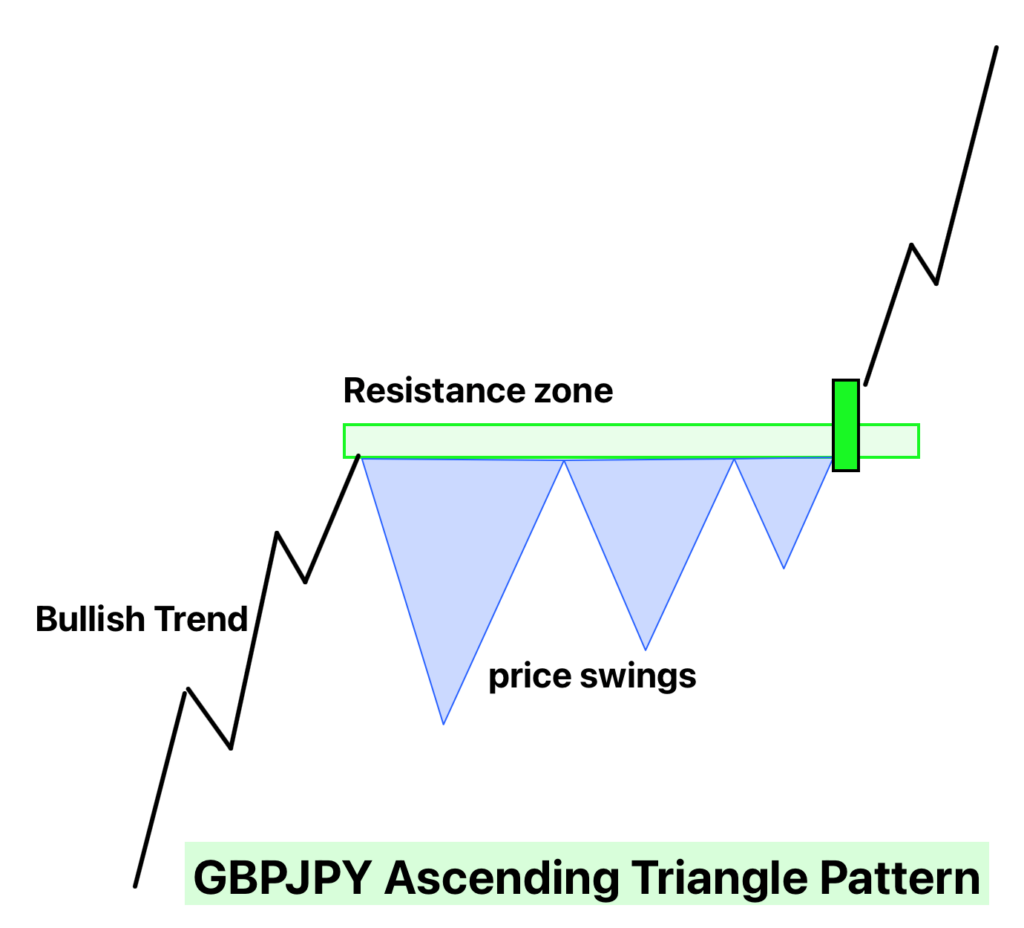
- What It Signals: This is a bullish pattern, suggesting that prices are likely to continue climbing.
- Prior Trend: Make sure the trend before the pattern is bullish; prices should have been moving up.
- Price Swings: Look for at least three V-shaped waves in the price chart. These waves show the natural ups and downs of the market.
- Resistance Zone: Draw a line connecting the high points of the V shapes. This is your resistance zone.
- Breakout: Wait for a clear breakout above this resistance zone. A strong upward move through this area confirms the ascending triangle pattern.
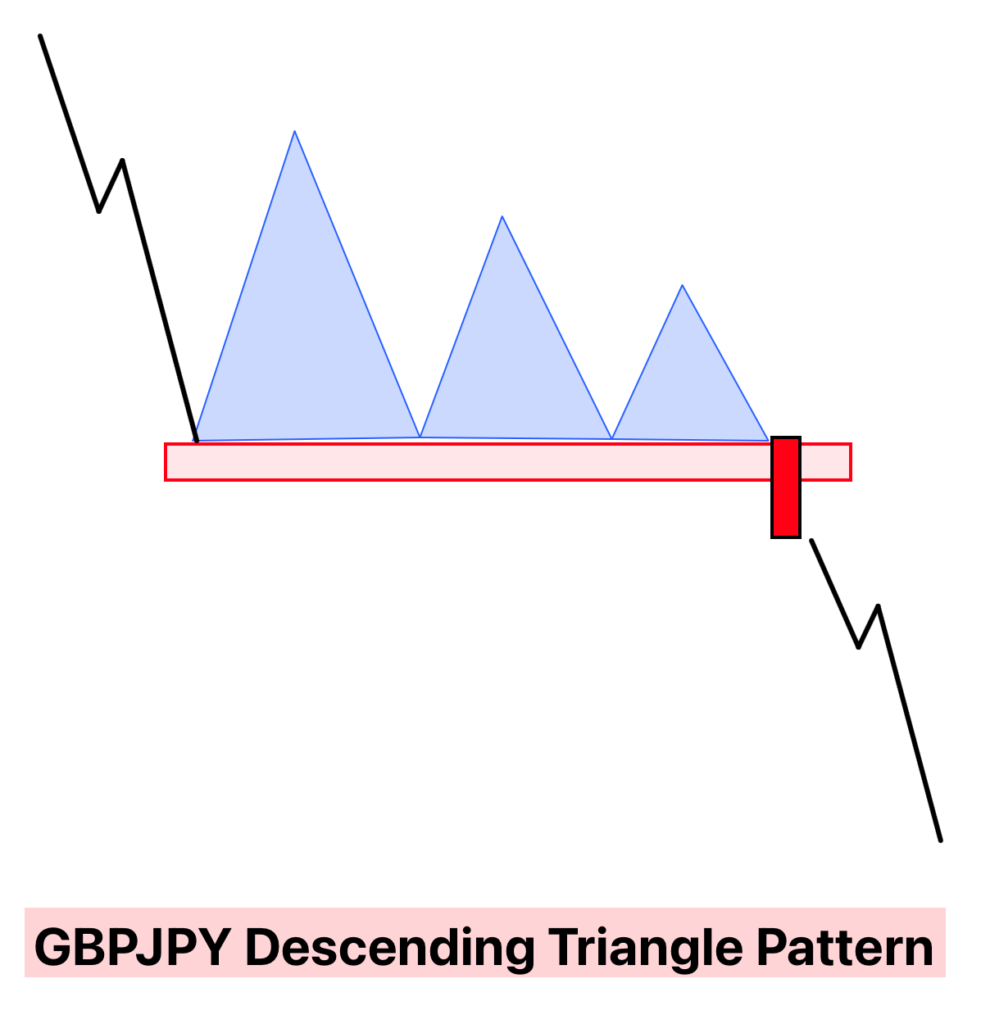
2. Descending Triangle Pattern:
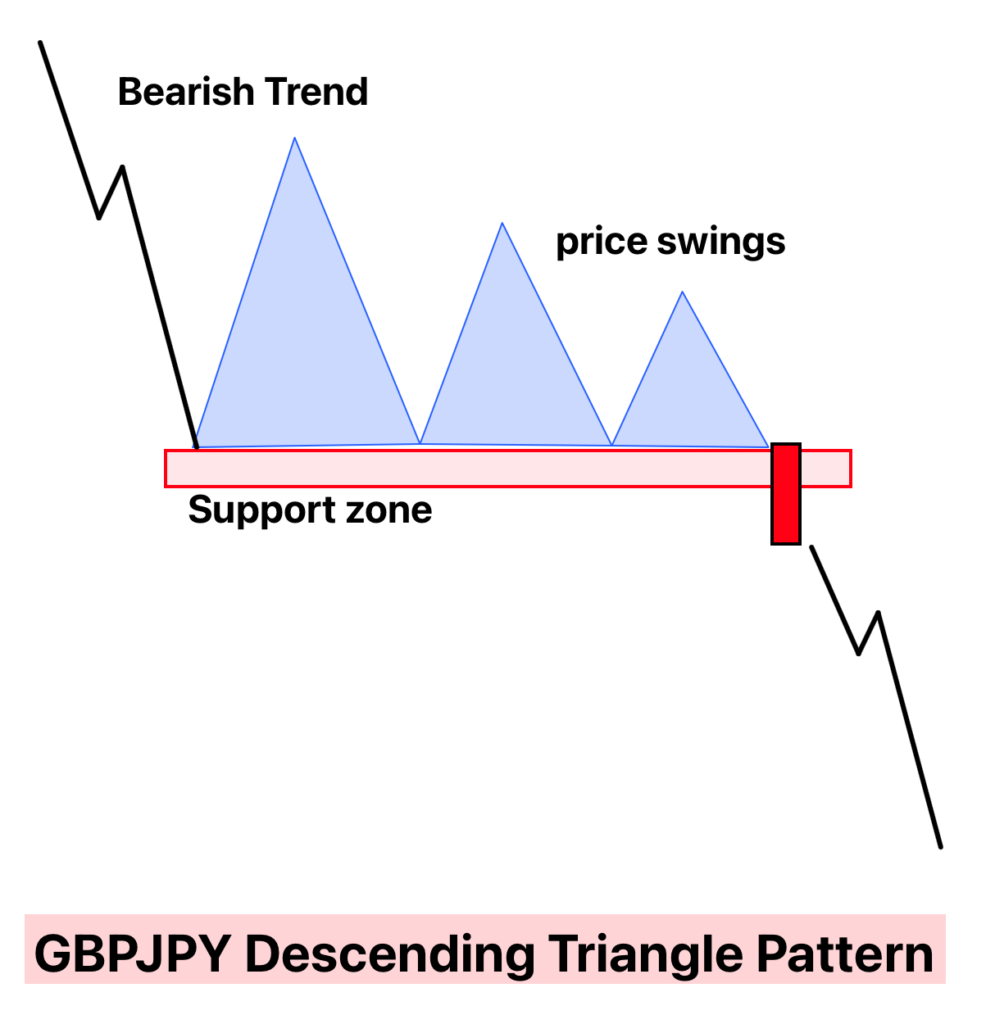
- What It Signals: This is a bearish pattern, suggesting that prices are likely to drop.
- Prior Trend: Make sure the trend before the pattern is bearish; prices should have been moving down.
- Price Swings: Look for at least three V-shaped waves in the price chart, just like with the ascending triangle.
- Support Zone: Draw a line connecting the low points of the V shapes. This is your support zone.
- Breakout: Wait for a clear breakout below this support zone. A strong downward move through this area confirms the descending triangle pattern.
By following these steps, you can confidently identify ascending and descending triangle patterns in GBPJPY, setting the stage for potentially successful trades.
How to trade GBPJPY profitably?
Now that we’ve covered chart patterns, let’s dive into how you can trade GBPJPY to consistently make profits. I’ll guide you through opening a trade, adding confluences, setting a stop loss, take profit, and managing risk.
1. Spotting the Pattern:
Once you identify a clear pattern on the GBPJPY chart, it’s crucial to check for confluences before opening a trade.
2. Adding Confluences:
There are two major confluences to verify:
- Prior Trend: Ensure that the trend before the breakout aligns with the direction of the breakout. For an ascending triangle, the trend should be bullish, and for a descending triangle, the trend should be bearish.
- Breakout Verification:
- Candlestick Size: Look for a breakout candlestick significantly larger than the surrounding candlesticks.
- Direction of Breakout: For a resistance zone breakout in an ascending triangle, there should be a large bullish candlestick. For a support zone breakout in a descending triangle, there should be a large bearish candlestick.
3. Opening a Trade:
Once you have validated the trade setup with the necessary confluences, initiate your trade right after the breakout candlestick completes. This ensures you are entering the market in alignment with the new momentum established by the breakout.
4. Setting a Stop Loss:
The placement of your stop loss is crucial to manage risk effectively and protect your trading capital.
- For a Buy Trade: Set your stop loss below the low of the last V-shaped price wave. This point acts as a safety net, ensuring that if the price reverses and starts to fall, your trade will close before incurring significant loss.
- For a Sell Trade: Place your stop loss above the high of the last V-shaped price swing. This strategy ensures that if the price unexpectedly rises after you enter a sell trade, your potential loss is minimized.
5. Calculating Your Price Target:
Once you’ve successfully entered a trade and set your stop loss, the next crucial step is to establish your take profit level. This is where you’ll secure your earnings and exit the trade. Here’s how you can do it:
- Identify the Largest Price Swing Wave: Look at the chart and find the largest V-shaped price swing within the pattern.
- Measure the Height: Calculate the height of this price swing from the top to bottom (for bullish patterns) or from bottom to top (for bearish patterns).
- Mirror the Height: Project this measured height from the point of breakout. For a bullish breakout in an ascending triangle, project the height upwards from the resistance zone. For a bearish breakout in a descending triangle, project the height downwards from the support zone.
- Set Your Take Profit Level: Place your take profit at this projected level.
By adopting this method, you create a systematic and objective way to determine your profit targets.
Real Trade examples
1. Trade example: Trade Breakdown on GBPJPY 15-Minute Chart
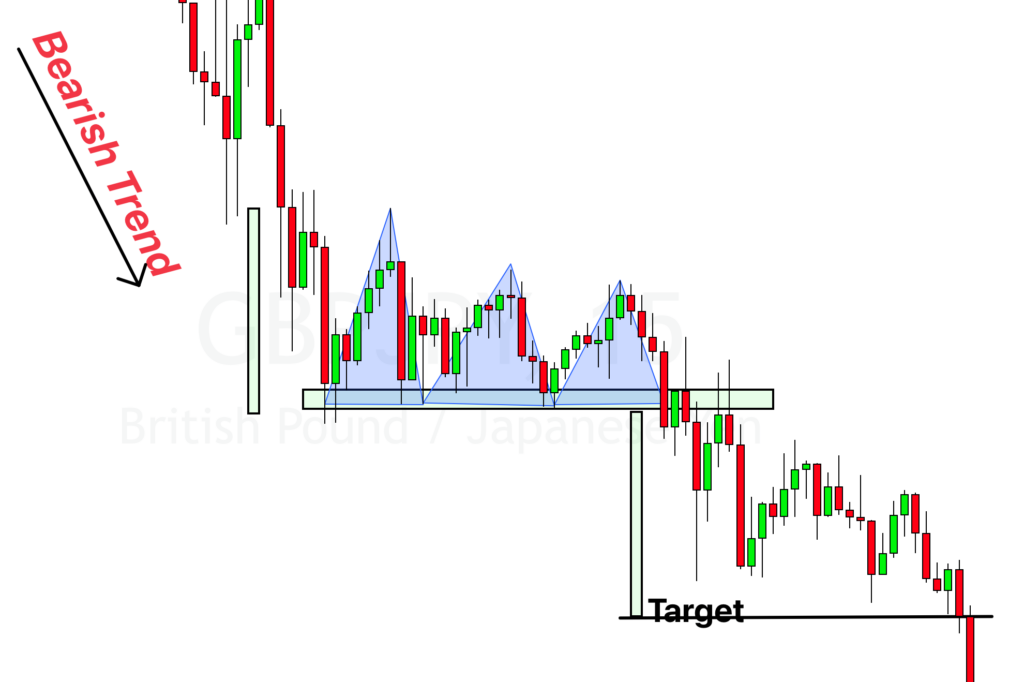
This is an example of a trade on the GBPJPY 15-minute chart:
- Bearish Trend: The chart started with prices going down.
- Descending Triangle: Prices are getting squeezed into a triangle shape.
- Breakout: The price drops below the triangle’s bottom line, suggesting it might keep going down.
- Target: Projected price level post-breakout.
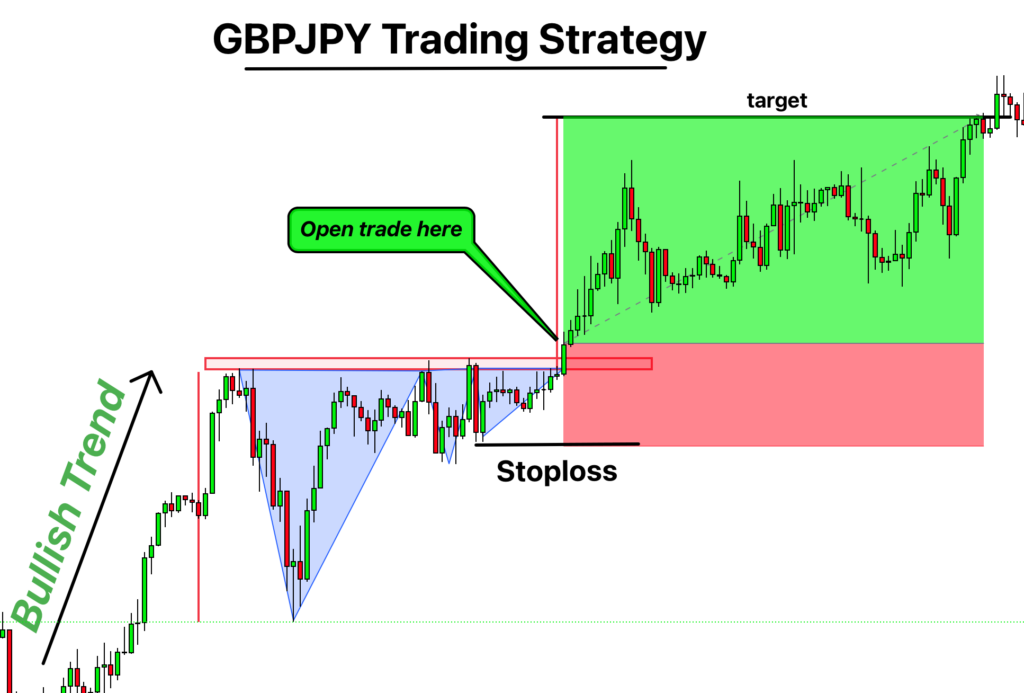
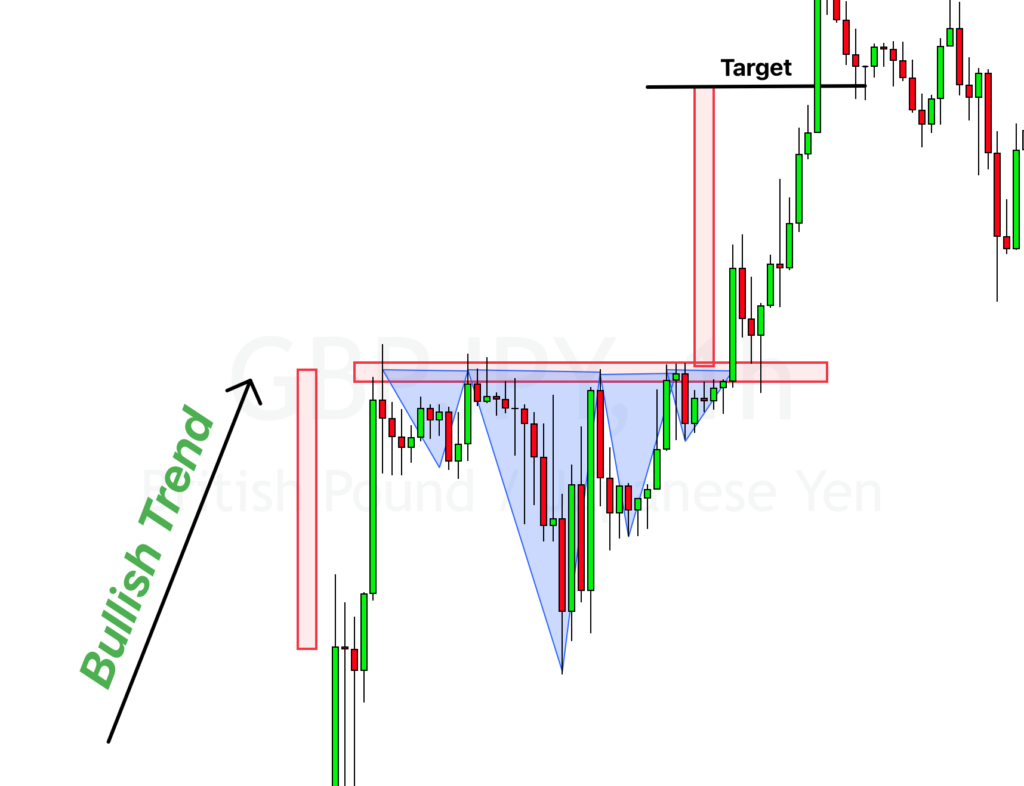
2. Trade Example: Trade Breakdown on GBPJPY 30-Minute Chart
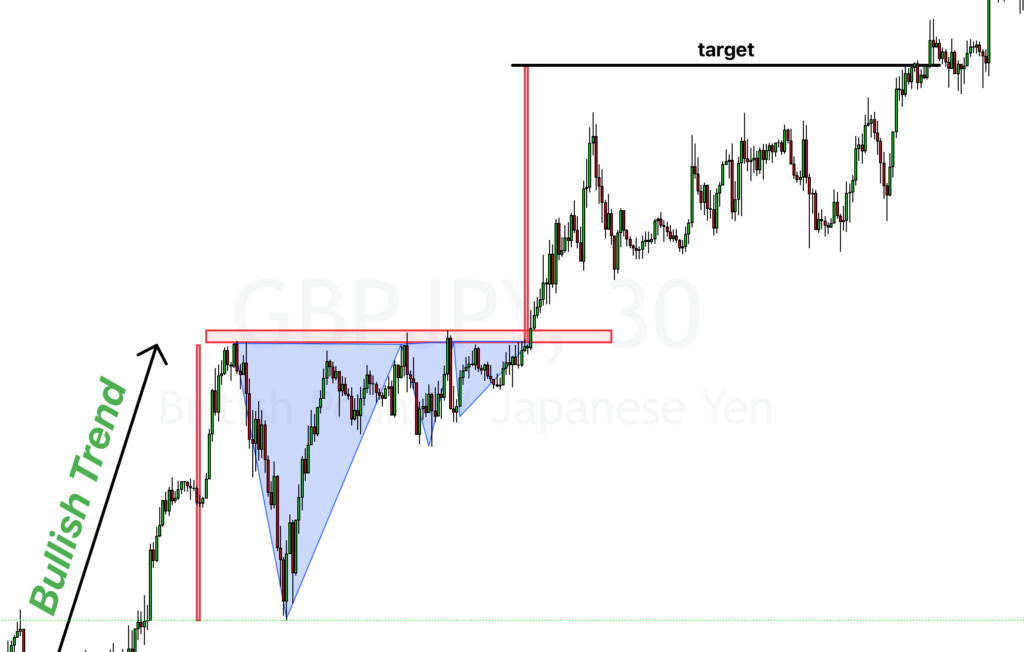
- Bullish Trend: The chart displays a strong upward movement in price.
- Ascending Triangle: Prices consolidate, forming a triangle pattern with a flat top and rising bottom.
- Breakout: The price pushes above the triangle’s top boundary, indicating potential for further upside.
- Target: The projected level where traders should take profit after the breakout.
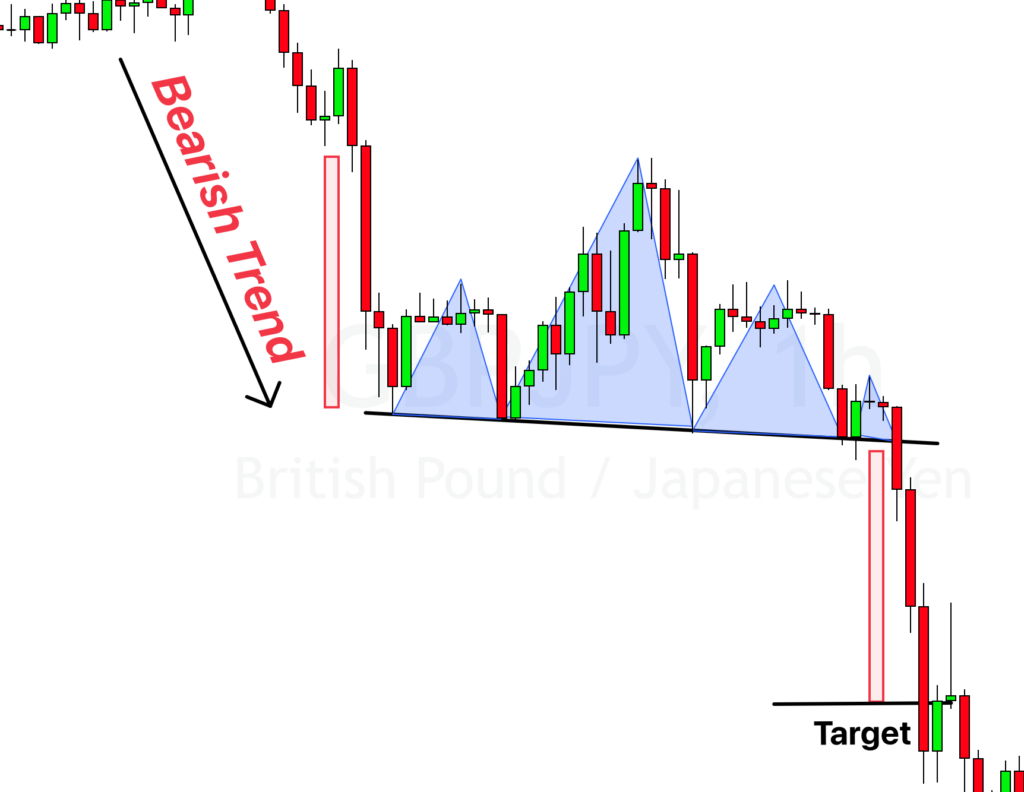
3. Trade Example: Trade Breakdown on GBPJPY 1H-Chart
Here price is also forming an ascending triangle pattern along with bullish prior trend on 1 hour chart of GBPJPY currency pair.
4. Trade Example: Trade Breakdown on GBPJPY 1H-Chart
In this example, price is making an descending triangle chart pattern at 1 hour timeframe on gbpjpy. price didn’t hit target on the first swing but you should hold the trade longer until it hit take profit or stop loss.
5. Trade Example: Trade Breakdown on GBPJPY 1H-Chart
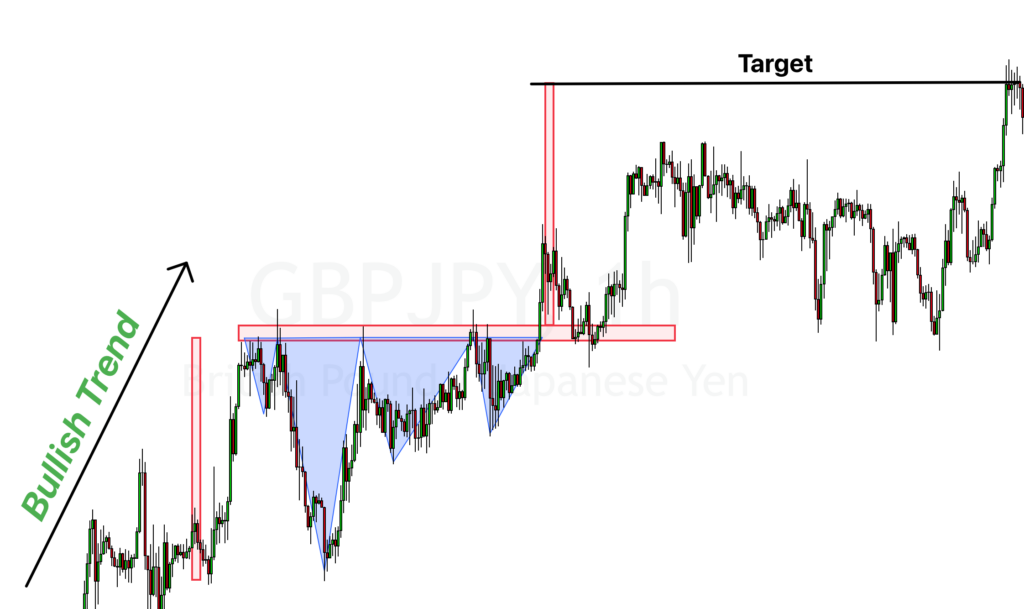
This is an example of ascending triangle chart pattern with bullish prior trend. Price took a lot of time to reach the target level but you should be patient enough to hold the trade until take profit hit.
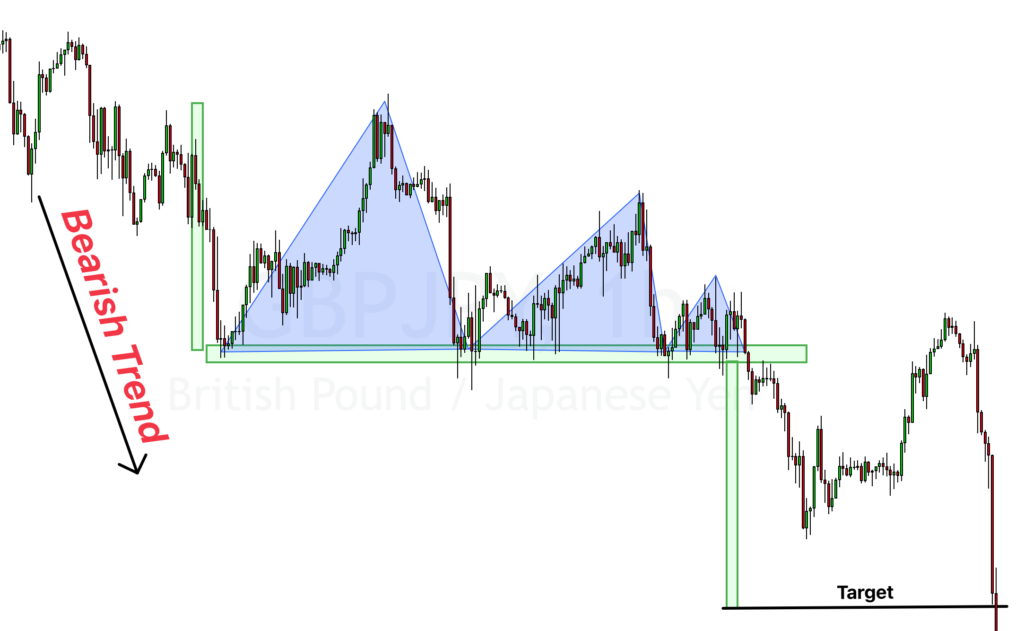
6. Trade Example: Trade Breakdown on GBPJPY 1H-Chart
This is another example of descending triangle pattern on GBPJPY currency pair.
I hope after watching these examples you will be able to find a perfect triangle pattern on the chart.
Risk Management Plan
Risk management is a key part of trading; it’s like a safety net that helps keep your account steady, even when trades don’t go your way. It’s all about controlling your risk on each trade, making sure you don’t lose too much.
Following a clear risk management plan is really important. Without it, you might risk too much on one trade, and that can lead to big problems. It’s like putting too many eggs in one basket. But with a solid risk management strategy, you can keep trading and growing your account, even when things get tough.
Risk Per Trade: 2%
Monthly Trades: 6
Expected Monthly Profit: 15.58%
Monthly Risk Management Table
| Trade Number | Capital at Start | Risk Amount | Trade Result | Capital at End | Cumulative Profit |
|---|---|---|---|---|---|
| 1 | $10,000 | $200 | Win | $10,240 | 2.4% |
| 2 | $10,240 | $204.8 | Win | $10,486.4 | 4.86% |
| 3 | $10,486.4 | $209.728 | Win | $10,741.136 | 7.41% |
| 4 | $10,741.136 | $214.8227 | Win | $11,003.5795 | 10.04% |
| 5 | $11,003.5795 | $220.0716 | Win | $11,275.6782 | 12.76% |
| 6 | $11,275.6782 | $225.5136 | Win | $11,557.8492 | 15.58% |
So, always decide beforehand how much you’re going to risk on each trade – a good rule of thumb could be 2% of your account. Stick to that rule, and you’ll be on your way to trading more consistently and with confidence. Remember, trading is not about hitting the jackpot on one trade, but about winning steadily over time.
Annual Profit Table
Taking a look at the bigger picture, here is an example of what your annual returns might look like with small monthly profit.
| Month | Profit % | Capital at Start | Capital at End |
|---|---|---|---|
| January | 12% | $10,000 | $11,200 |
| February | 10% | $11,200 | $12,320 |
| March | 8% | $12,320 | $13,305 |
| April | 11% | $13,305 | $14,769 |
| May | 9% | $14,769 | $16,098 |
| June | 12% | $16,098 | $18,030 |
| July | 7% | $18,030 | $19,292 |
| August | 10% | $19,292 | $21,222 |
| September | 9% | $21,222 | $23,132 |
| October | 8% | $23,132 | $24,982 |
| November | 10% | $24,982 | $27,480 |
| December | 11% | $27,480 | $30,503 |
Conclusion
To wrap up, trading the GBPJPY currency pair using a clear and simple strategy can significantly boost your trading success. By focusing on just one currency pair and a single chart pattern, you are able to build a solid understanding and develop a keen eye for profitable trade setups. The ascending and descending triangle patterns in GBPJPY have proven to be highly reliable, offering a winning ratio of over 90%.
However, it’s crucial to remember that trading is not about making big profits overnight. Consistency is the key. Like any other skill, trading requires time and practice to master. It’s important to stick to your trading plan, manage your risks wisely, and be patient. Slowly but surely, with consistent effort and disciplined trading, you can build up your trading account and achieve substantial profits.
Remember, every trader faces losses, but managing your risks properly and staying consistent in your strategy can help you stay profitable in the long run. Trading is a journey, not a sprint. So, take your time, keep learning, and stay disciplined – your profits will grow over time.
Happy trading!