

Definition
A bullish rectangle pattern is a chart pattern in which price moves sideways or in range on a candlestick chart with a bullish breakout.
This chart pattern acts as both a trend continuation and trend reversal pattern. However, retail traders mostly use it as a continuation chart pattern because of the high winning ratio.
In this post, you’ll learn about both types of bullish rectangle patterns, along with a simple day trading strategy.
How to identify a rectangle chart pattern?
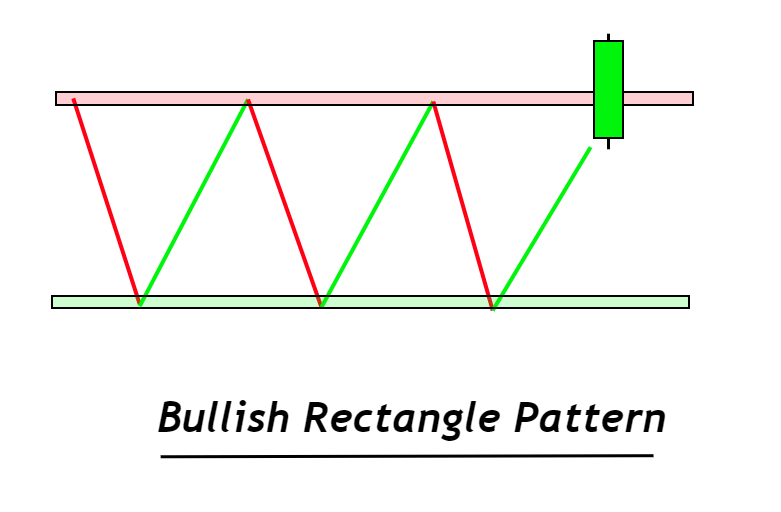
The rectangle chart pattern represents the market condition. For example, during this chart pattern, the price moves sideways. The market moves within a price range with time, forming a rectangle-like shape on the chart.
To find the rectangle pattern accurately on the chart, you should follow the following steps
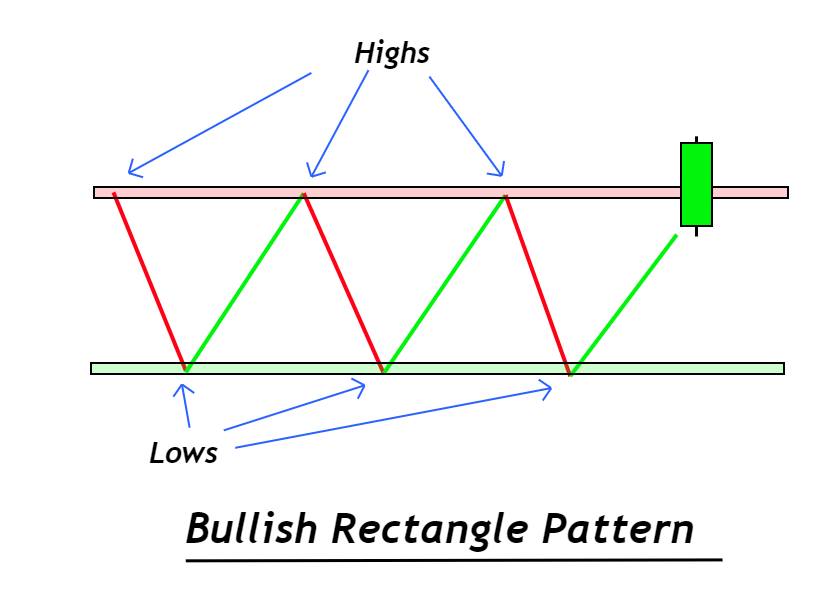
- The price pattern should form two highs and two lows.
- There much be two price touches on the resistance zone, and two price touches on the support zone.
Like in the image below, the price is moving sideways with respect to time.
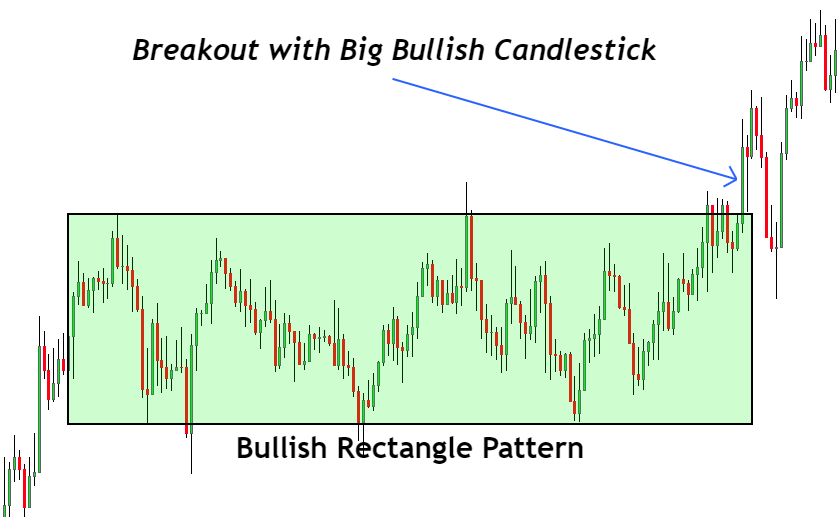
Breakout with a bullish candlestick
is the most critical step you should check carefully. Because the market is full of false breakouts.
A good breakout happens with a big bullish candlestick. The bullish candlestick should have a high body-to-wick ratio. Because it represents a valid breakout. On the other hand, if a doji candlestick or small breakout candlestick form, you should always wait for breakout confirmation with a big candlestick. Because small candlestick has low momentum and primary key level’s breakout always happens with a high momentum candlestick.
Types of the bullish rectangle pattern
There are two types of bullish rectangle patterns based on the market trend.
- Trend reversal rectangle pattern
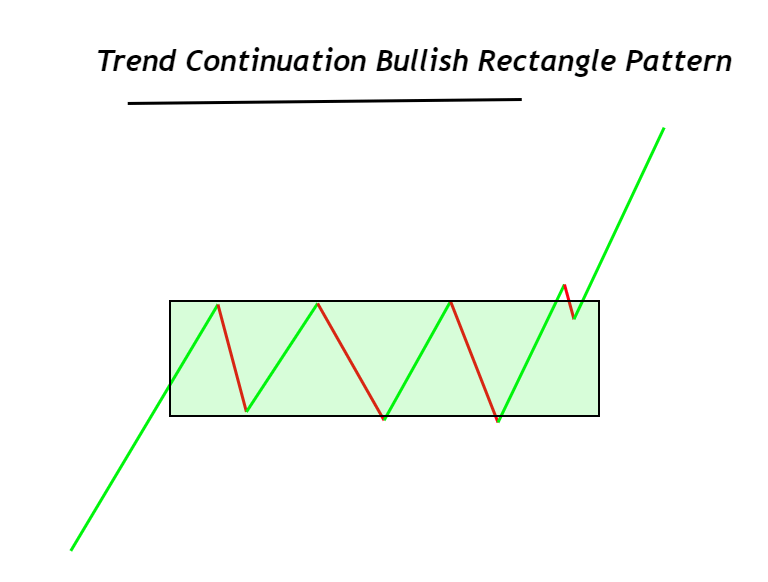
- Trend continuation rectangle pattern
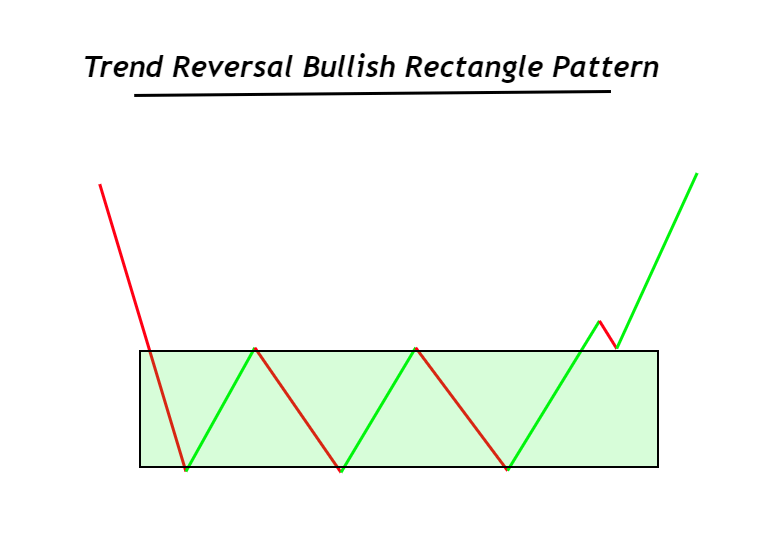
In the case of a trend reversal, the bullish rectangle pattern forms after the bearish market. When the sellers keep pushing down the market, bullish rectangle pattern forms, and then a bullish trend starts.
It is the most aggressive type of pattern because many false breakouts and patterns form, leading to a loss in trading. However, you can also use this forecast for analysis or confluence purposes in trading.
In case of trend continuation, the bullish rectangle pattern forms during the bullish trend. It is a high probability pattern because it creates the direction of the bullish trend. Retail traders widely use this pattern to trade the markets.
I will also recommend continuing the rectangle pattern over the trend reversal pattern to get a high winning ratio.
What does the bullish rectangle pattern tell traders in trading?
The rectangle chart pattern is a symbol of indecision in the market. It means the big traders and institutions are deciding their future direction either they will start a bullish trend or will start a bearish trend. It depends on the breakout of the rectangle pattern on the price chart.
When the price moves sideways, the potential of buyers is almost equal to the power of sellers. That’s why prices move in a range.
However, when a bullish breakout of the rectangle pattern’s resistance zone happens, a bullish rectangle pattern form.
The bullish rectangle pattern completes only after the breakout of the resistance zone in the bullish direction. Before breakout, the price can also start a bearish trend because the price will be in the decisive phase. Only breakout confirms the future direction of the market.
Day trading strategy for rectangle pattern
In this strategy, you’ll learn about the order entry level, stop loss and take profit level.
As a strategy consists of the confluence of three or more technical parameters, we’ll add three technical parameters here in the rectangle pattern strategy to increase the winning probability.
Here are the confluences that we’ll check before looking for entry, stop loss and take profit levels:
- The prior trend before the bullish rectangle pattern should be bullish. It represents a trend continuation chart pattern.
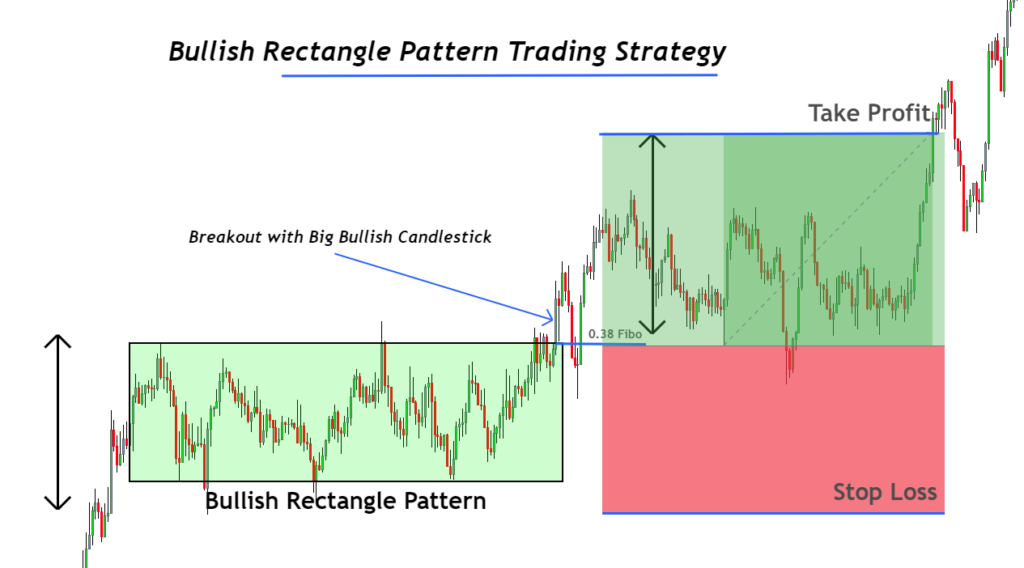
- Breakout of upper resistance zone of rectangle pattern should happen with a big bullish candlestick. It means the price will break the resistance zone with full potential.
- After the breakout, wait for the price to retrace to the 38 Fibonacci level of the previous wave.
These three confluences will give high probability trade setups in the market.
Buy entry
Open a buy order when the price retraces to the 38 Fibonacci level after the resistance zone breakout.
Stoploss
Stop loss should be placed below the low of the bullish rectangle pattern.
Take profit level
Take profit level is the distance between the support and resistance of rectangle pattern in pips. Now project that distance above the resistance zone of the bullish rectangle pattern.
This is the simple day trading strategy for the rectangle pattern.
Conclusion
Trading the trend continuation pattern will always give high probability results because the smart money is trading with the big institutions and market makers. If a retail trader trades against the market makers, he will lose his whole account balance.
Another essential factor in increasing the winning ratio of a trading strategy is confidence in technical tools. It would be best always to consider adding confluences to make a perfect trading strategy.
Make sure to backtest the rectangle pattern at least 100 times to master it.
Frequently Asked Questions
A simple rectangle pattern is neither bullish nor bearish. It simply shows the indecision in the market. A bullish or bearish trend confirms only when the price breaks the rectangle pattern. If the price breaks the resistance zone of the rectangle pattern, then a bullish rectangle pattern forms. On the other hand, if the support zone breaks, then a bearish rectangle pattern forms.
The high probability pattern always forms in the direction of the trend. Because chances of winning a trading setup increase when it forms on the way of a significant trend. So a bullish pattern will have a high winning probability when it forms within a bullish trend. Conversely, a bearish pattern will have high winning probability when it forms within a bearish trend.