
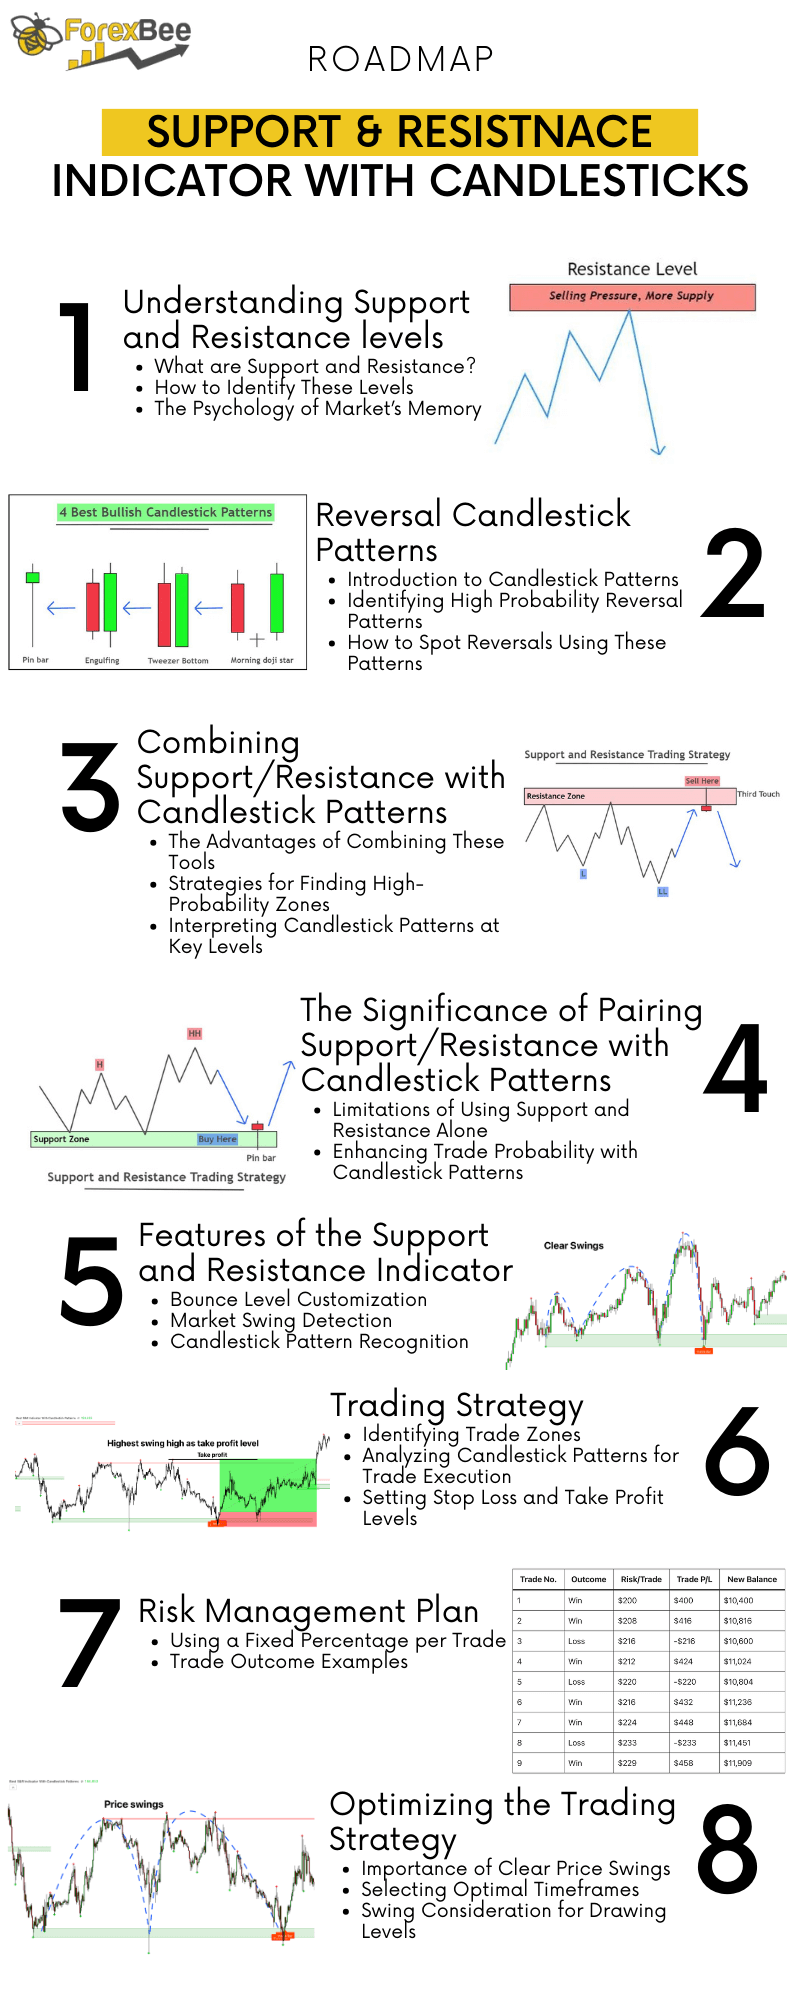
This support and resistance indicator finds the high probability zones and then highlight the formation of candlestick patterns on these zones.
In trading, knowing where prices might turn around, or ‘reverse’, is key. That’s where support and resistance levels come in – they’re like traffic signals on a chart, telling us where prices may stop and change direction. When we see certain candlestick shapes, they can hint that a price reversal is about to happen.
We’ve created an indicator that puts these two powerful tools together, helping you spot the best places to enter or exit trades. Before, we gave you a tool to find support and resistance.
And the best part? We’re giving away this new tool for free.
Keep reading to see how you can use this indicator to spot the right times to enter or exit the market, aiming for a smoother trading journey.
Understanding Support and Resistance levels in Trading
- What are Support and Resistance?
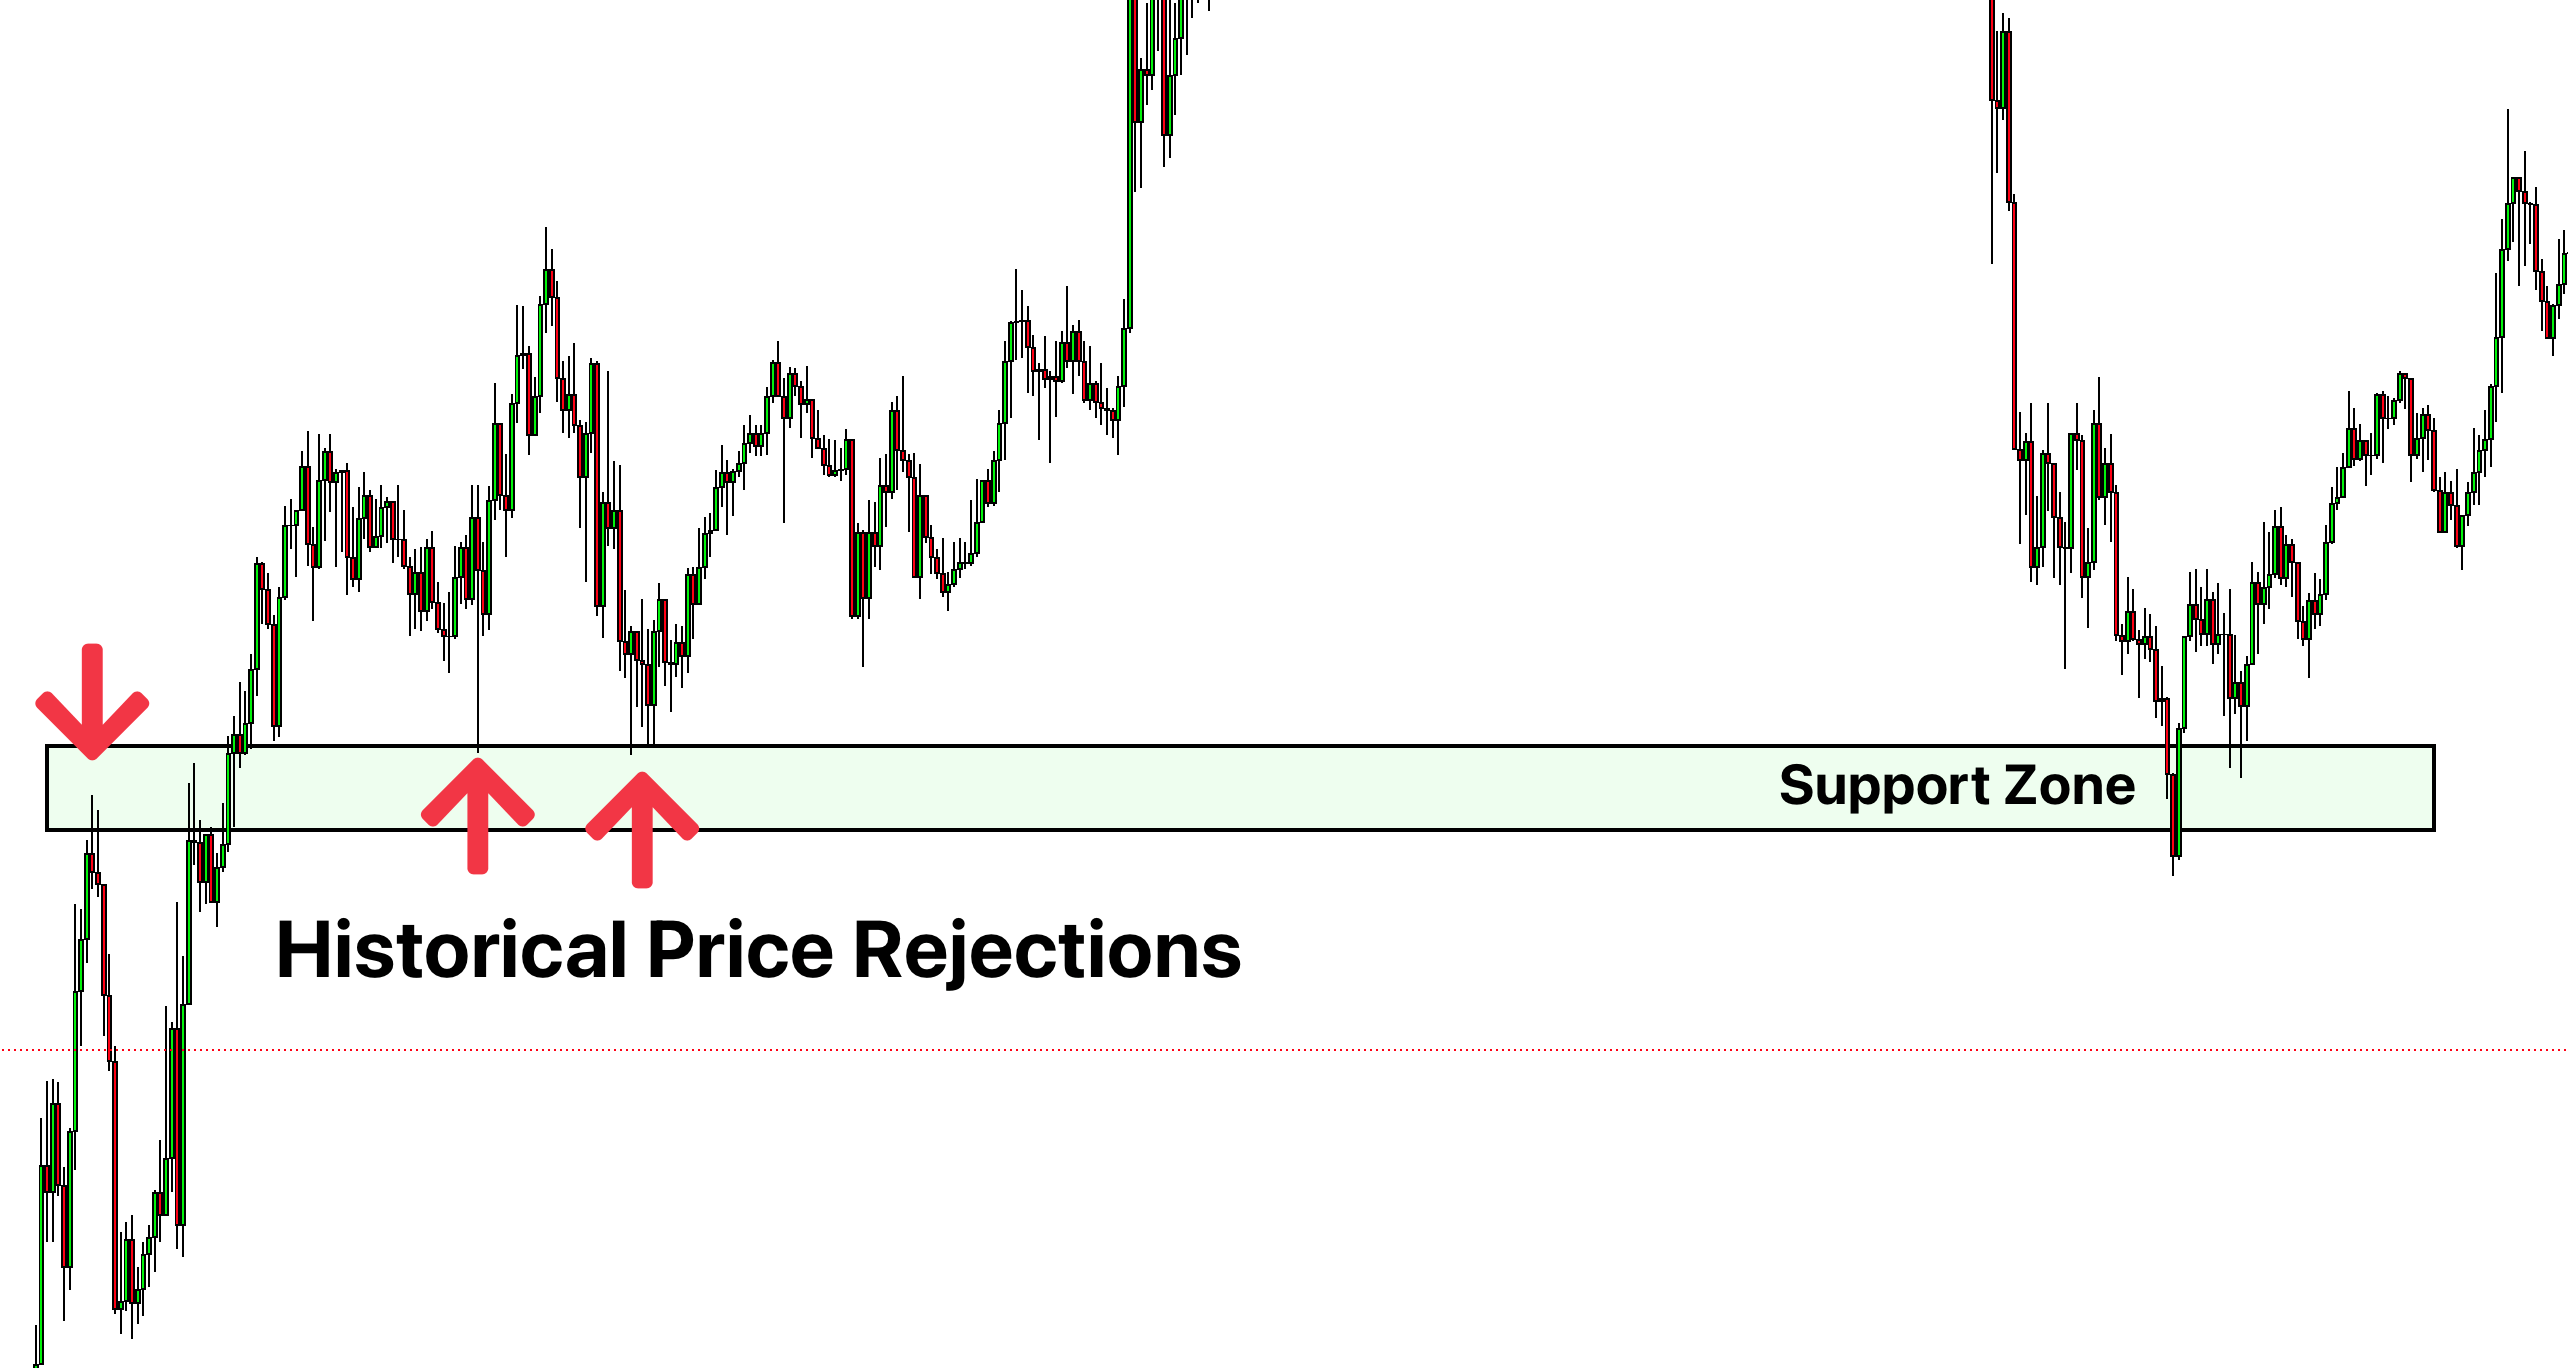
- Support and resistance levels are like the floor and ceiling of a room in trading terms. Support is the floor, where the price tends to bounce upwards; resistance is the ceiling, where the price often bounces back down.
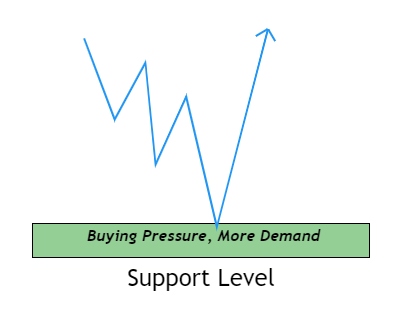
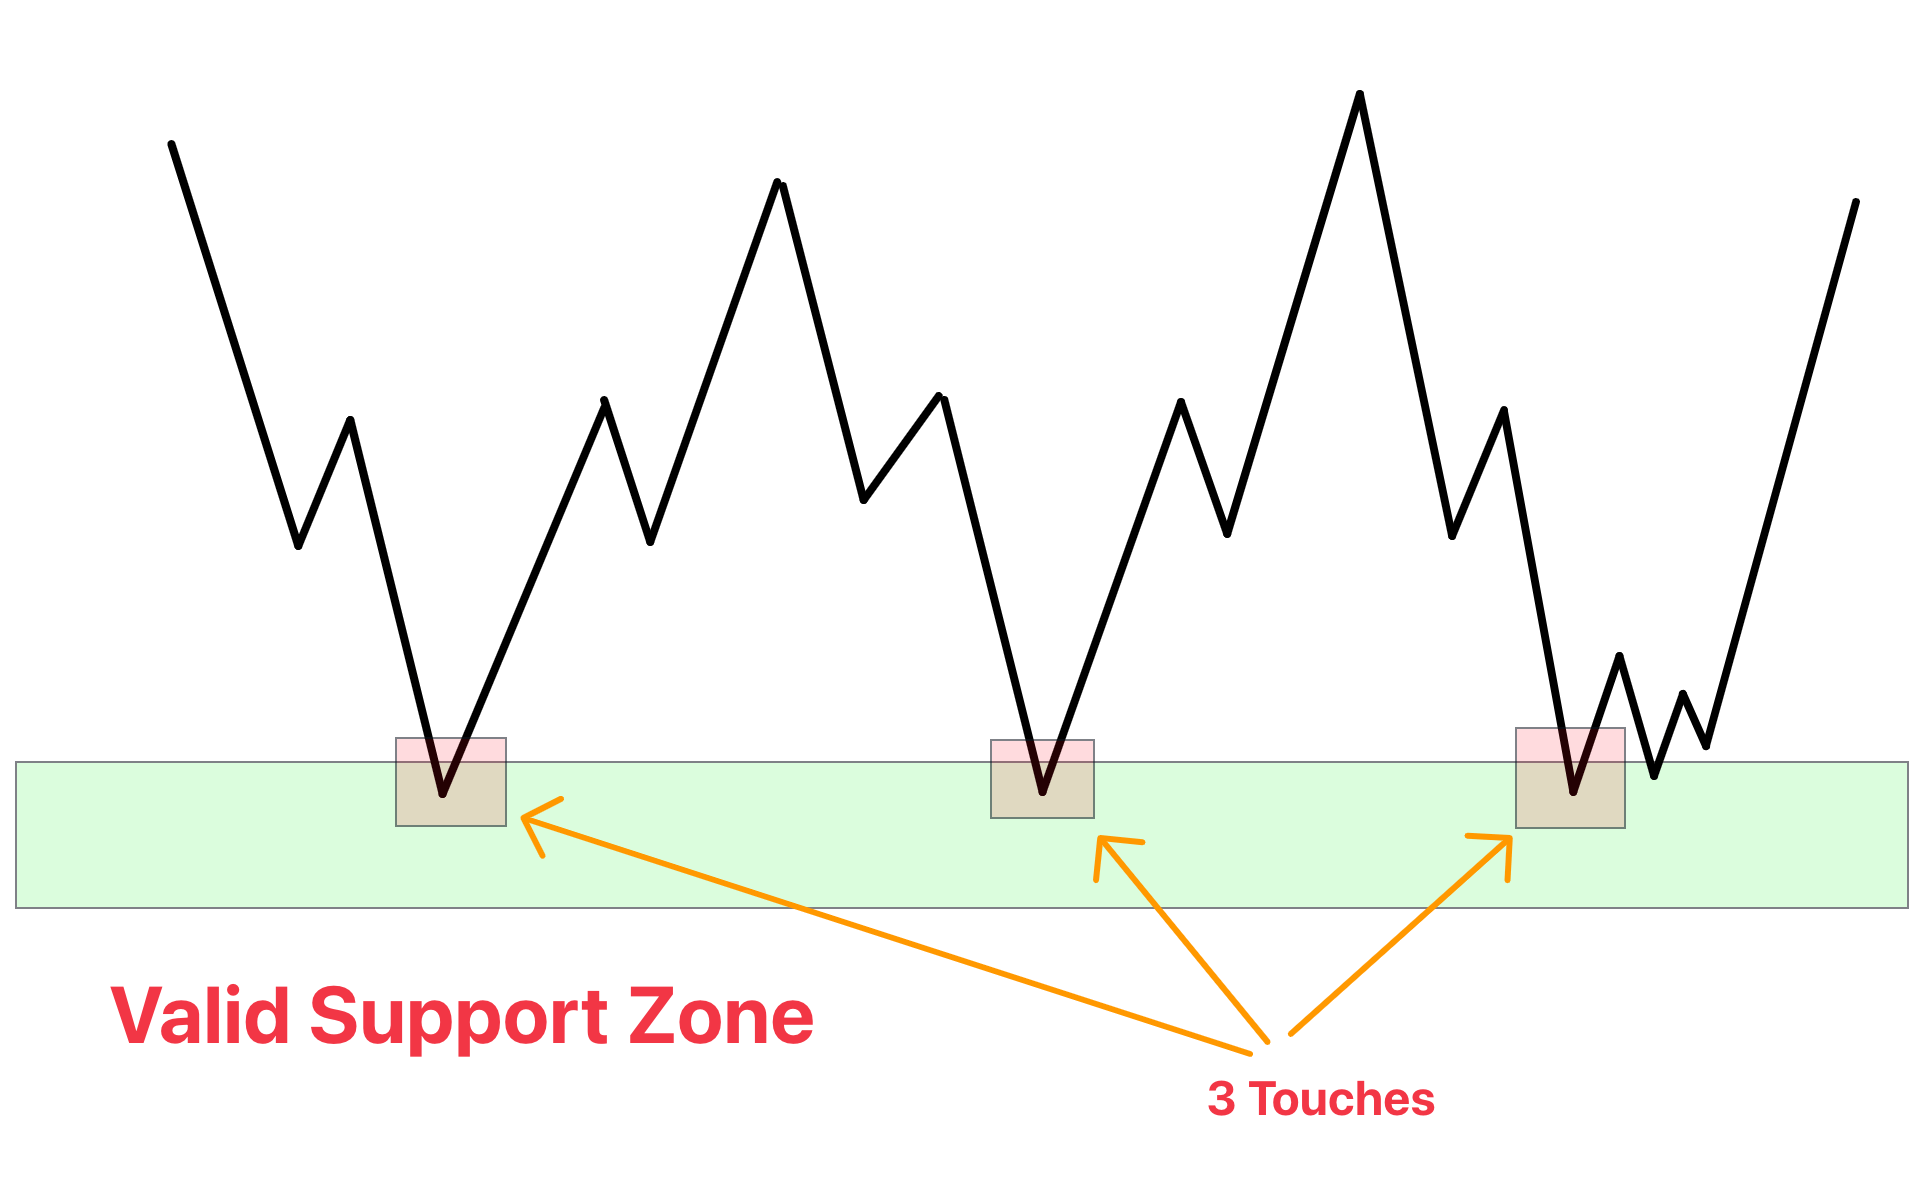
- These levels are found by looking at places on the chart where the price has bounced back multiple times before. For a zone to be valid, typically, you’ll want to see the price react to it at least two or three times.
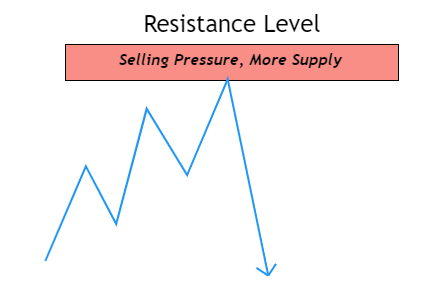
- Support and resistance levels are like the floor and ceiling of a room in trading terms. Support is the floor, where the price tends to bounce upwards; resistance is the ceiling, where the price often bounces back down.
- How to Spot These Levels:
- Look for areas on the chart where the price has changed direction a few times.
- You need to see the price bounce off a level two or three times to call it support or resistance.
- To draw these on your chart, use the high and low points of these bounces and the points where the price closed.
- The Market’s Memory:
- Think of support and resistance as the market’s memory of past price movements.
- When the price gets near these levels again, traders remember what happened before and often act in a similar way.
- This behavior turns these levels into self-fulfilling prophecies – if everyone expects the price to bounce back, it often does just that.

By understanding and identifying these support and resistance zones, traders can better predict where the price is likely to halt and potentially reverse
Reversal Candlestick Patterns
Candlestick patterns are the language of the market’s sentiment, expressed through the price on a chart. These patterns can tell a story about what traders are thinking and, more importantly, what they might do next.
When it comes to chart reading in trading, certain candlestick patterns are like red flags that suggest a change in direction might be on the horizon. These high probability candlestick patterns are essential tools for any trader looking to pinpoint potential reversals.
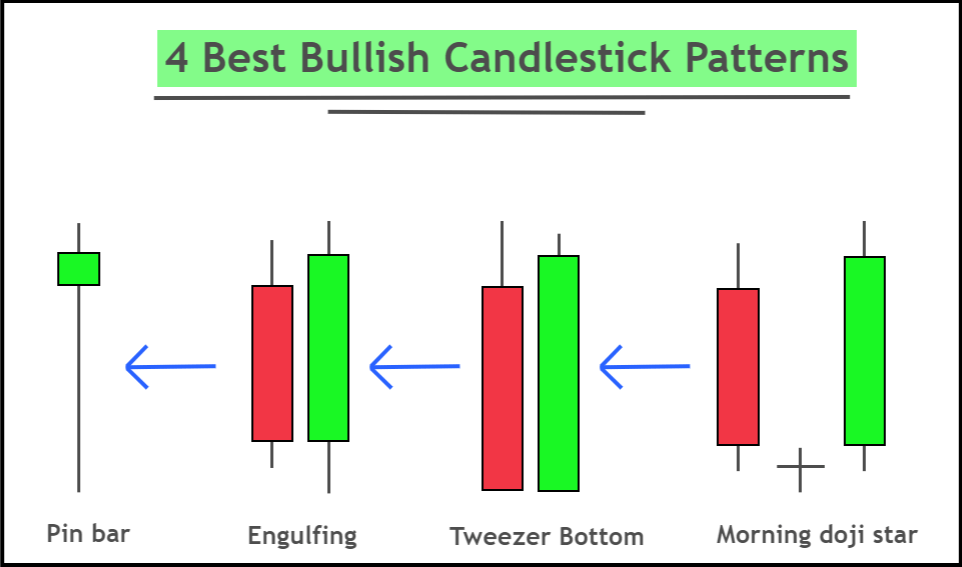
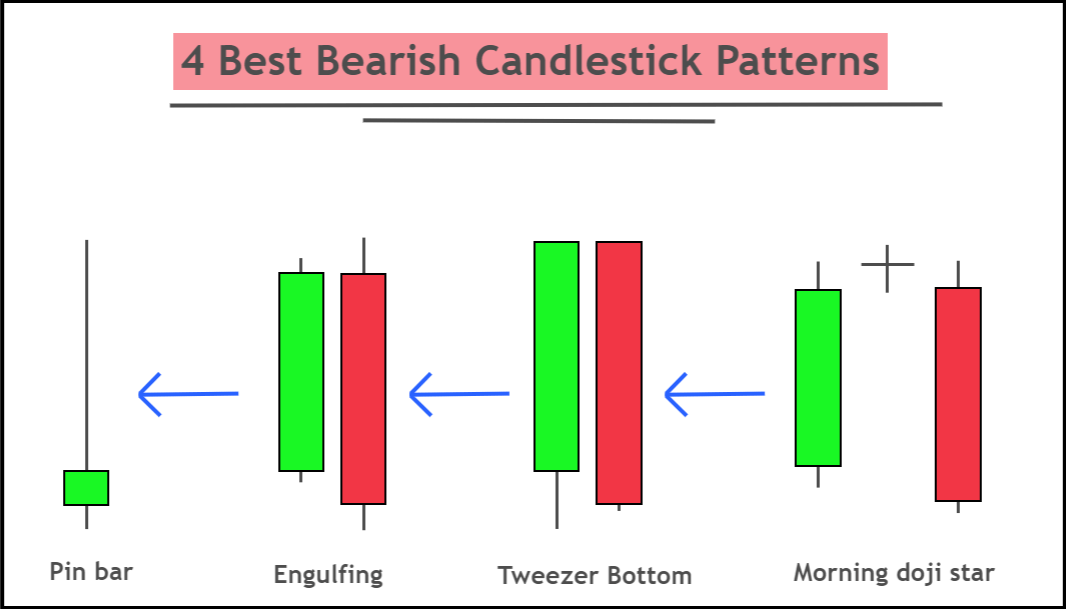
- High Probability Reversal Patterns:
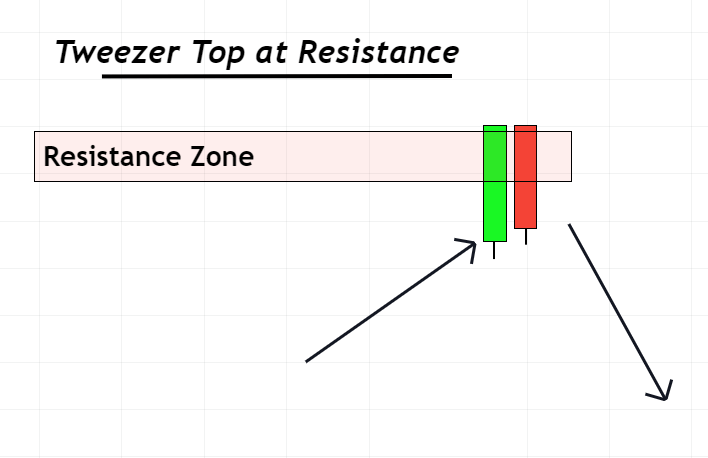
- The patterns that often signal a strong chance of a market turnaround include the Engulfing pattern, Pinbar, Morning and Evening Stars, Inside bar and the Tweezer Tops and Bottoms.
- The patterns that often signal a strong chance of a market turnaround include the Engulfing pattern, Pinbar, Morning and Evening Stars, Inside bar and the Tweezer Tops and Bottoms.
- Identifying Reversals with These Patterns:
- Spotting these patterns involves looking for the specific shapes and configurations of candlesticks at support and resistance levels.
- For example, an Engulfing pattern at a resistance level might indicate an upcoming drop, while a Pinbar at support could suggest a bounce is coming.
By becoming familiar with these patterns and where they form, traders can make more informed decisions about when to enter or exit trades.
Combining Support/Resistance with Candlestick Patterns
For traders, combining support and resistance levels with candlestick patterns is like having a high-precision tool—it makes pinpointing where to buy or sell much clearer.
- Why Use This Combo for Trading:
- It’s like having both a map and a compass; support and resistance guide you to the right area, and candlestick patterns tell you when to make your move.
- Seeing a candlestick pattern right at a known support or resistance level acts as a strong hint that the price might be about to change direction.
- Finding the Best Spots with Support and Resistance:
- Look for zones on your chart where the price stopped and changed direction a few times before—these are your support and resistance zones.
- These zones are your watch areas, where the action is likely to happen.
- Identifying and Interpreting Candlestick Patterns at Key Levels:
- Once a support or resistance zone is established, watch for the formation of reversal candlestick patterns within these zones.
- An engulfing pattern, pinbar, or other reversal patterns at these levels suggest a stronger likelihood of price movement in the anticipated direction.

In essence, this one-two punch of support/resistance and candlestick patterns can give you a clearer signal to enter or exit a trade, potentially leading to better trading results.
Why Pair Support/Resistance with Candlestick Patterns?
Support and resistance levels are great for showing where the price might hold or break, but they don’t tell the whole story. Without additional clues, these levels alone can be like guessing when a traffic light will change—it’s a waiting game. This is where candlestick patterns step in to give us the green light.
- The Limit of Support and Resistance Alone:
- Think of support and resistance as spots on a treasure map. They show you where the treasure (key price levels) might be, but they don’t tell you if it’s the right time to dig.
- Boosting Probability with Candlestick Patterns:
- Adding candlestick patterns is like having a metal detector while you’re treasure hunting. Now, not only do you know where to look, but you also get a signal when you’re right on top of the treasure (the high probability trade).
- When you see a candlestick pattern at a support or resistance level, it’s like both your map and detector agree—there’s something worth checking out here.
By combining these two tools, you’re not just relying on one sign to make your trading decisions—you’ve got a combo that historically increases the chances of making a successful trade.
Fine-Tuning Trades with the Support and Resistance Indicator
Now you don’t need to look for the trading opportunities on the chart instead you can just use our support and resistance indicator which will find both support resistance zones along with candlestick patterns forming at these zones.
| Feature | Function |
|---|---|
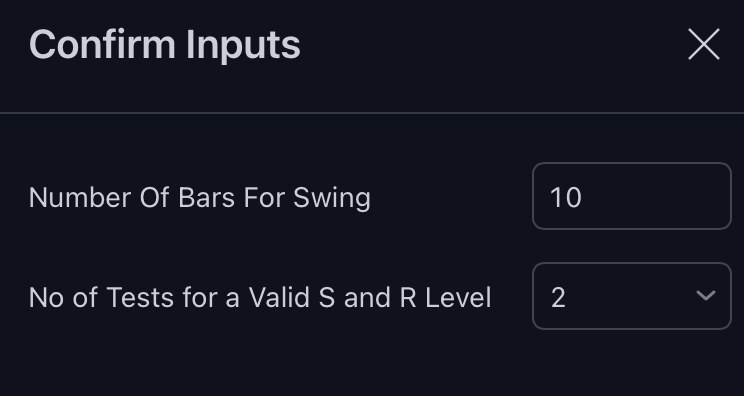
| Bounce Level Customization | Choose the number of bounces for a zone to be recognized. |
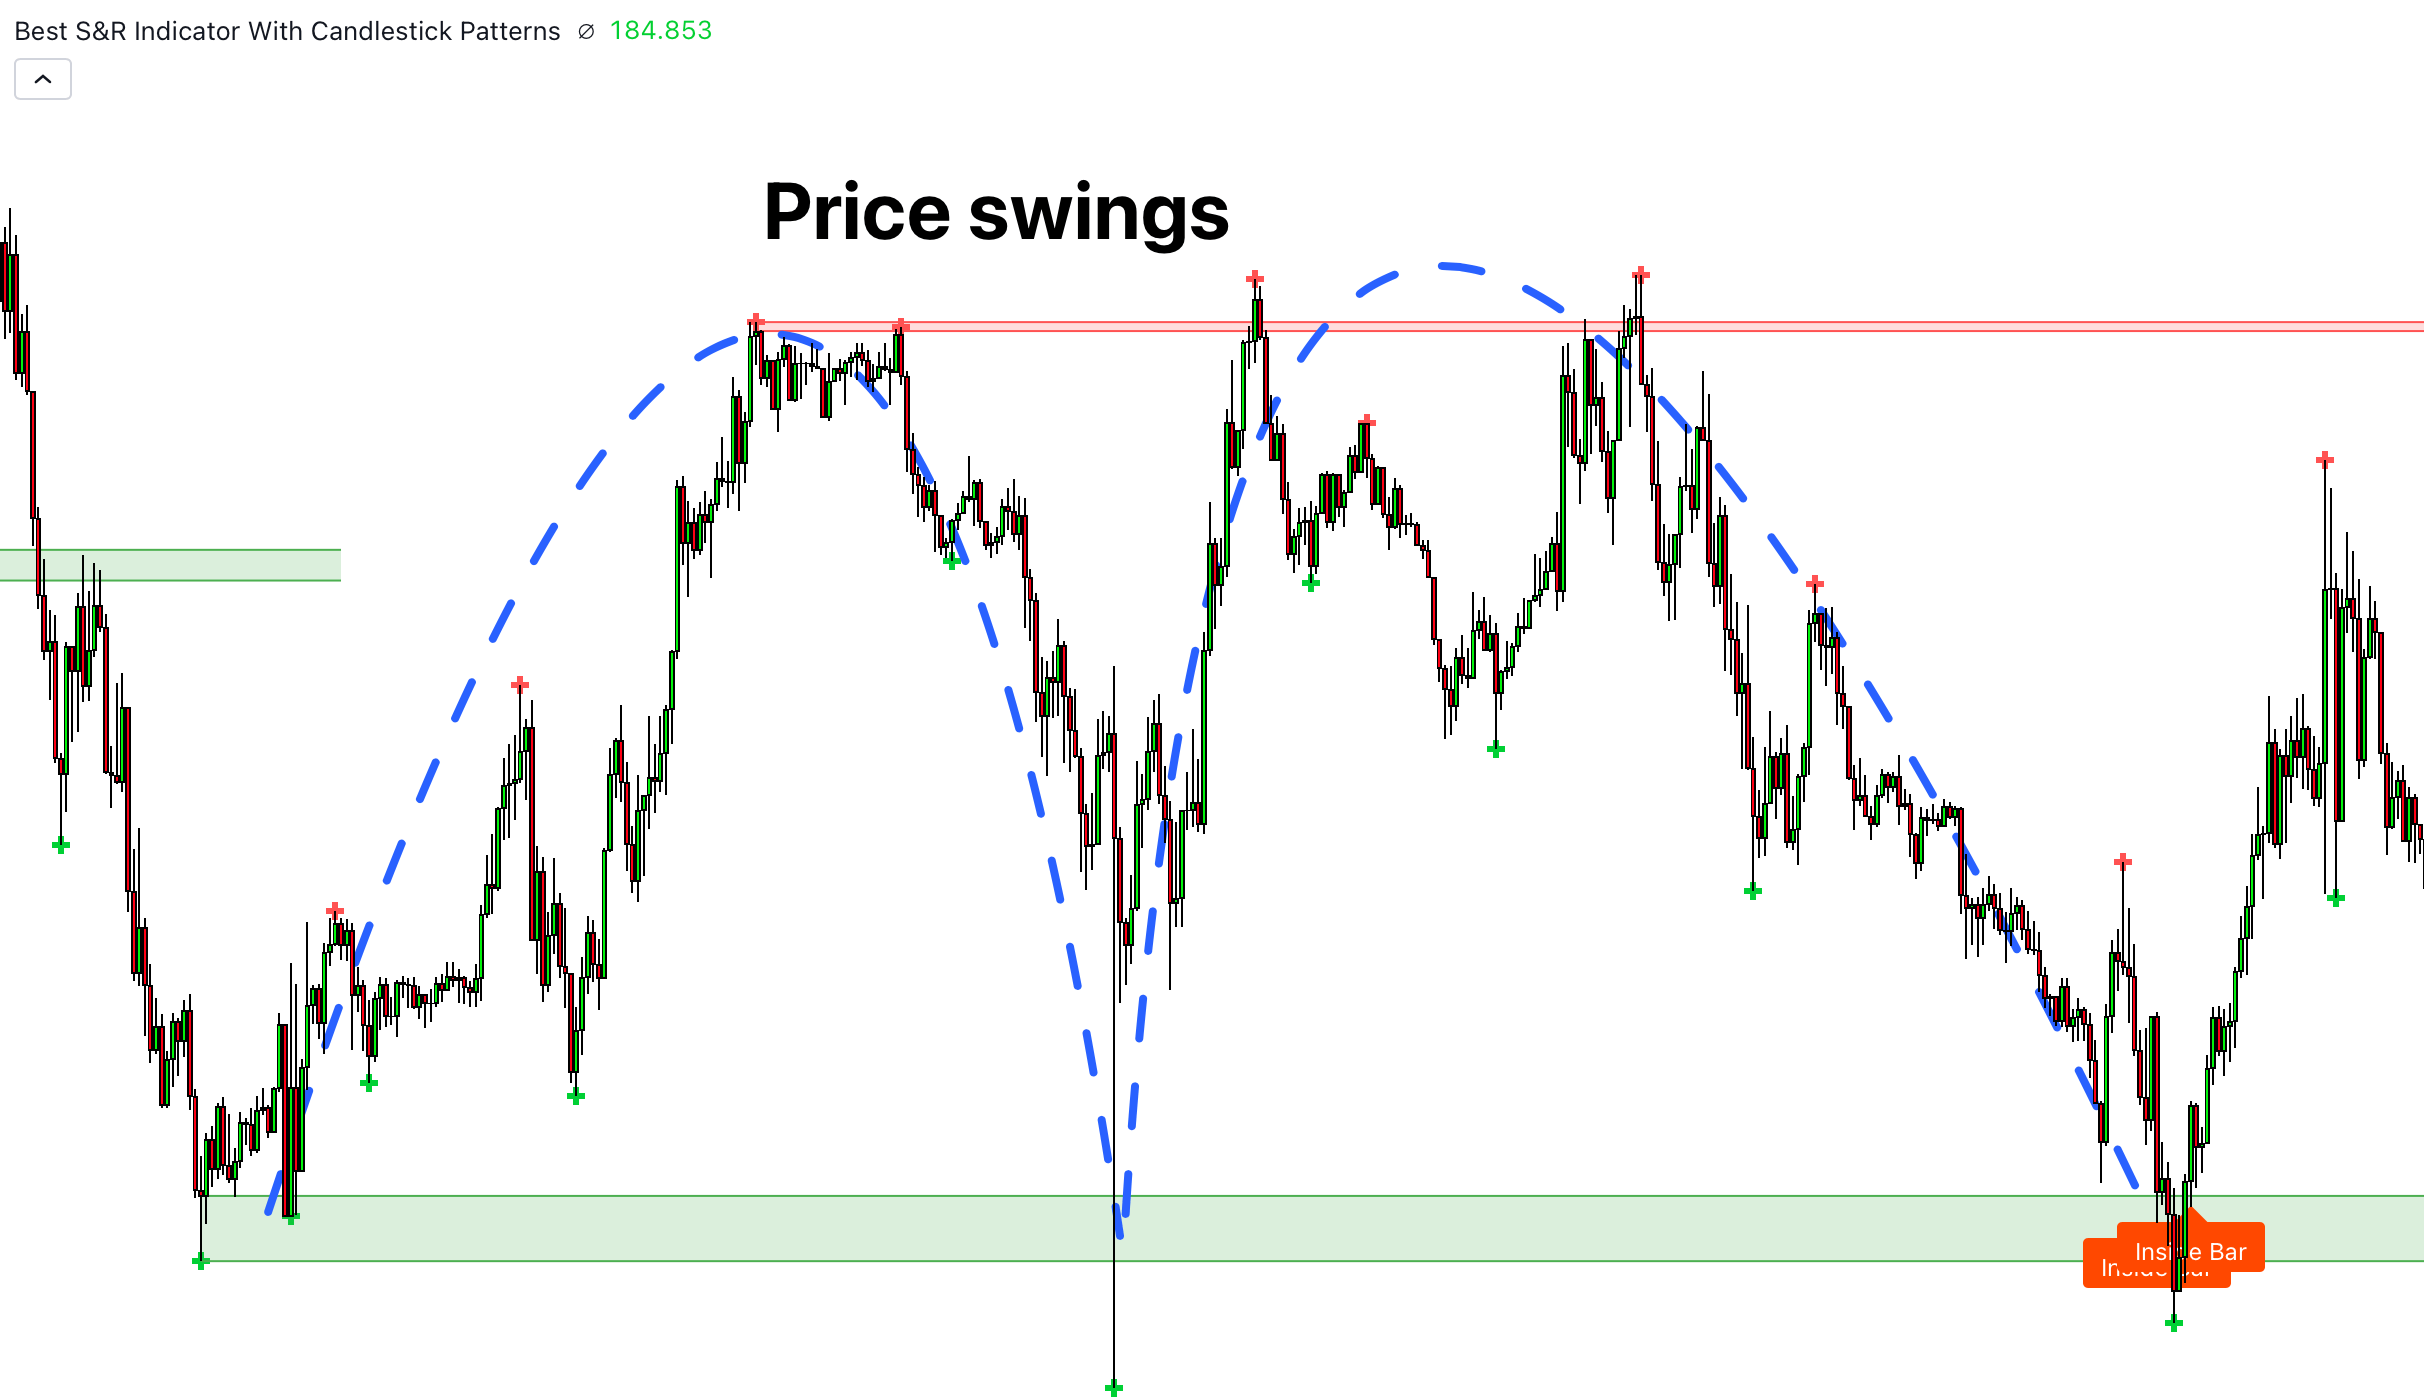
| Market Swing Detection | Marks significant market moves for strong levels. |
| Candlestick Pattern Recognition | Identifies and signals key reversal patterns such as Engulfing, Pin bar, and Inside bar, as well as Morning and Evening Stars when they appear at critical support or resistance zones, providing timely alerts for potential trade entries or exits. |
Trading Strategy Using Support and Resistance with Candlestick Patterns
This simple yet effective trading strategy leverages the strengths of the Support and Resistance Indicator along with key candlestick patterns to identify entry points. Here’s how to implement it:
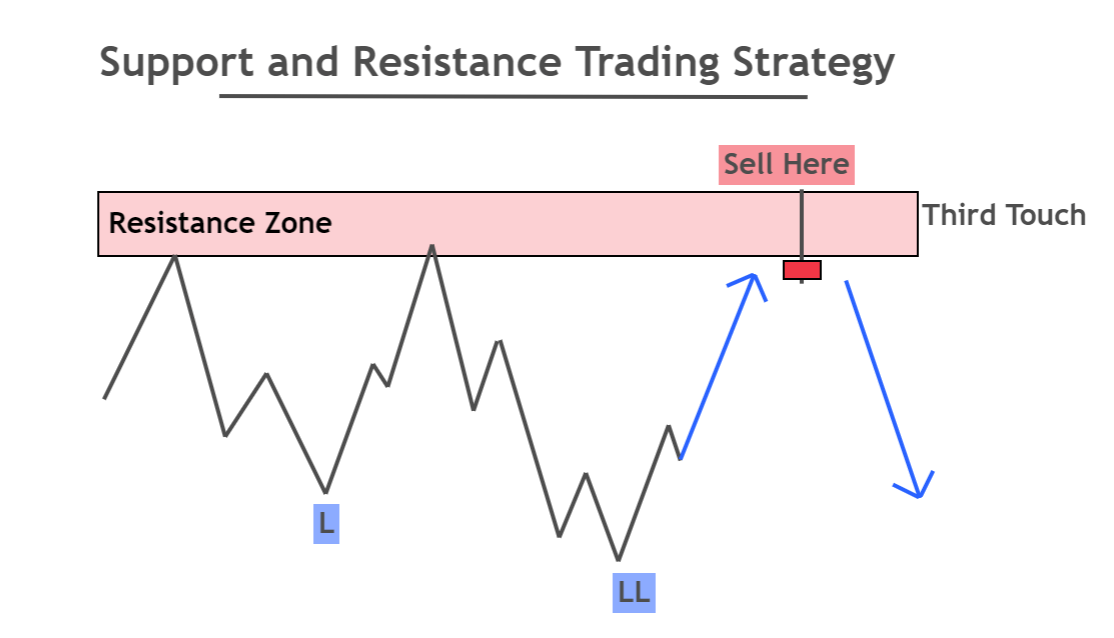
- Identifying the Zone:
- For resistance zones: Look for the lower lows of the last 2-3 swings.
- For support zones: Find the higher highs of the last 2 swings and mark the topmost point.
- Analyzing Candlestick Patterns:
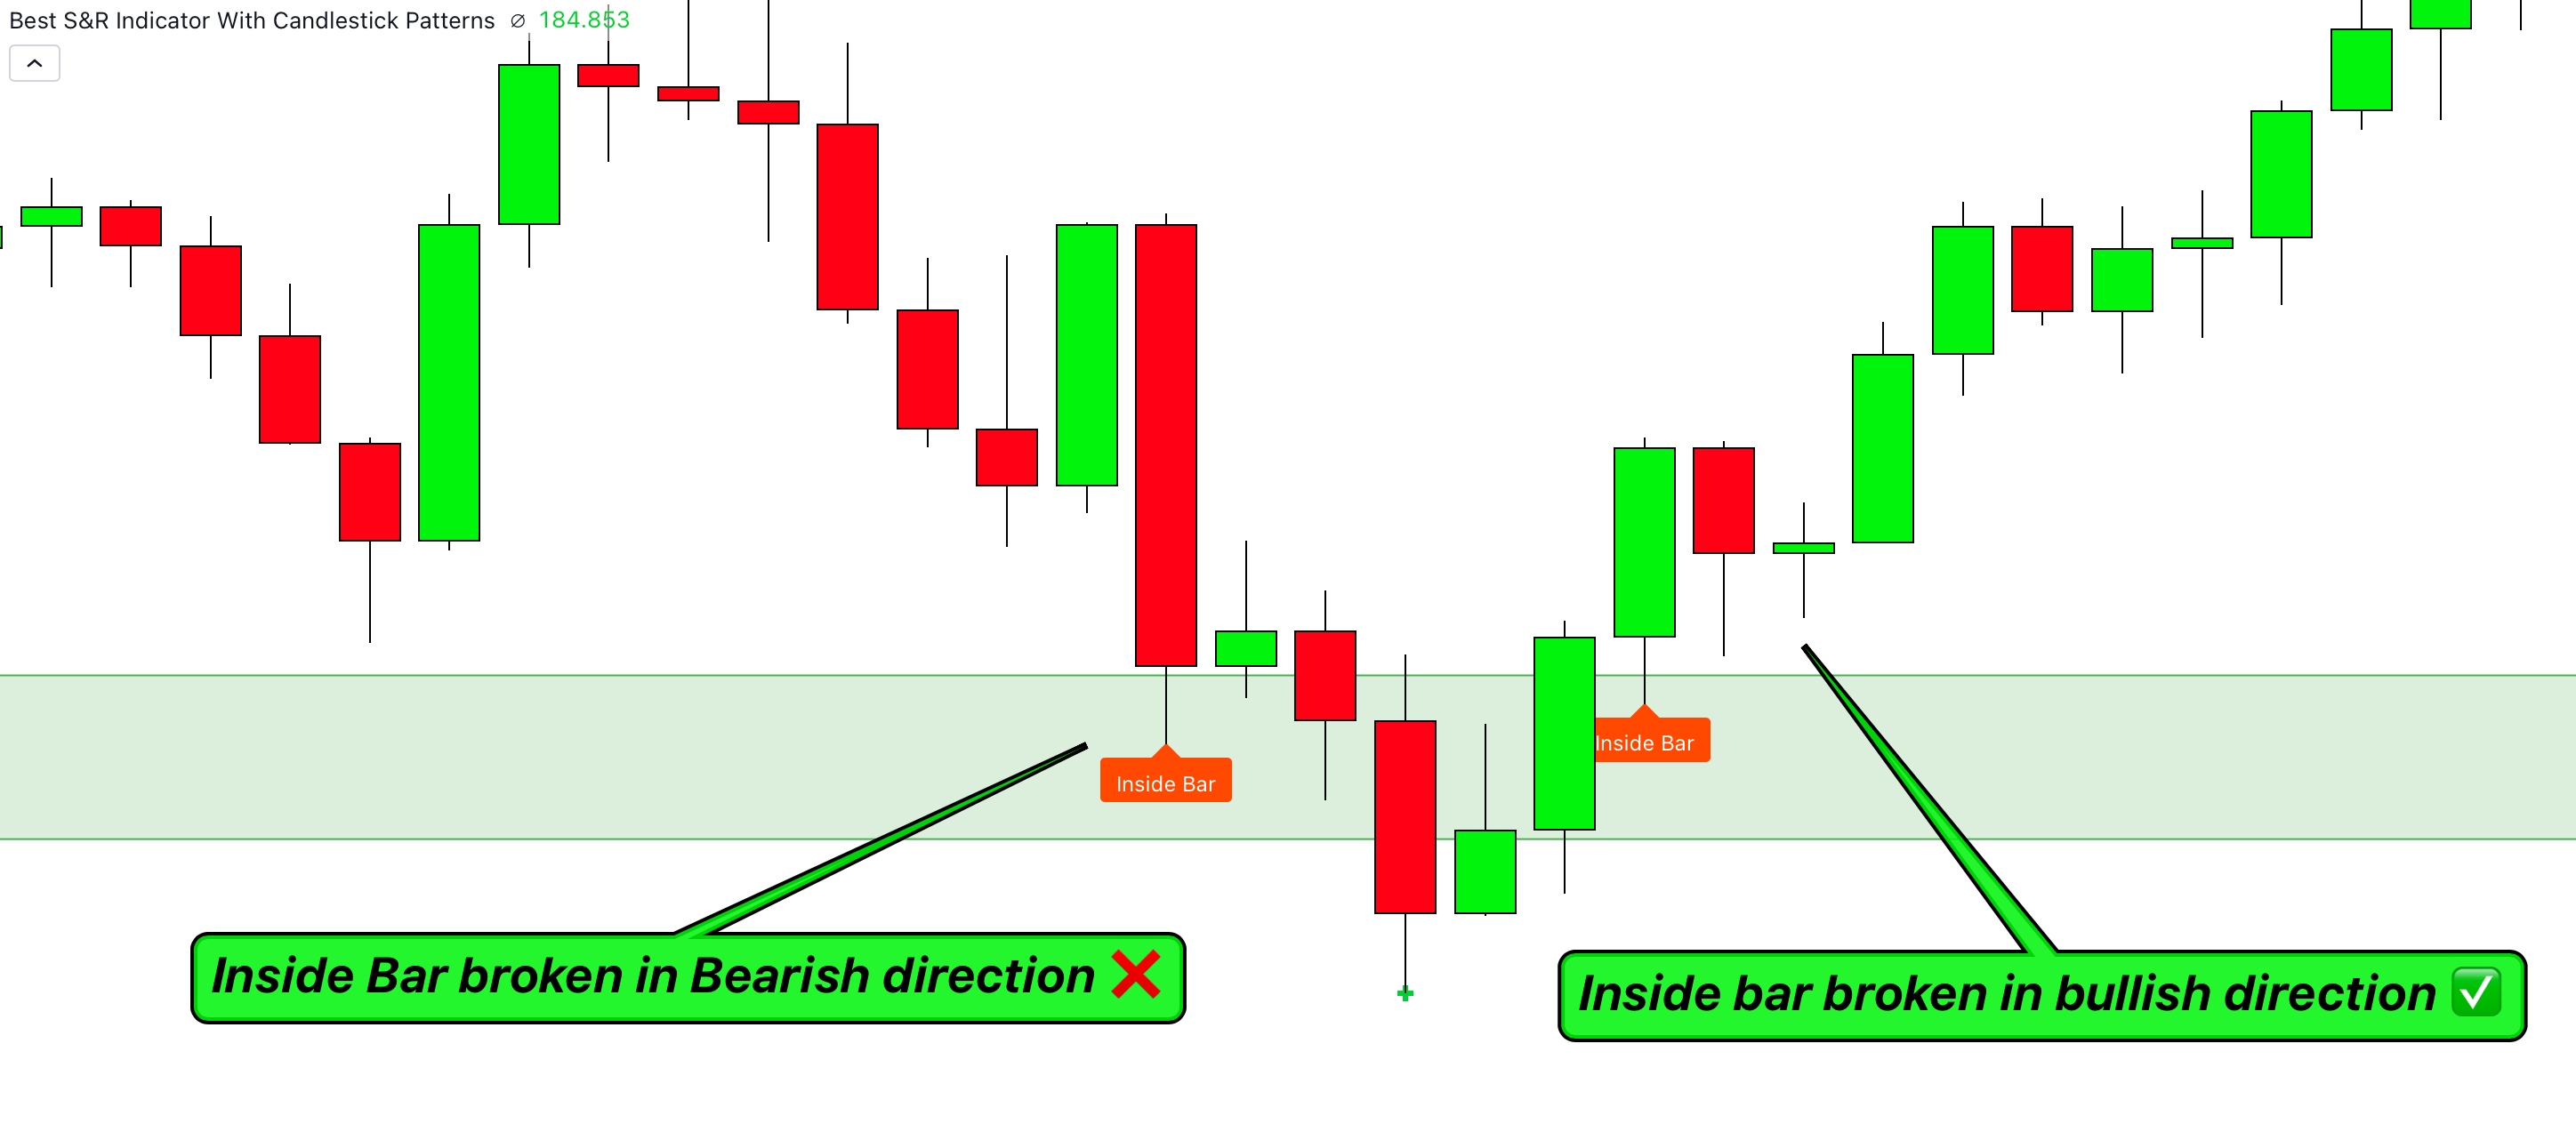
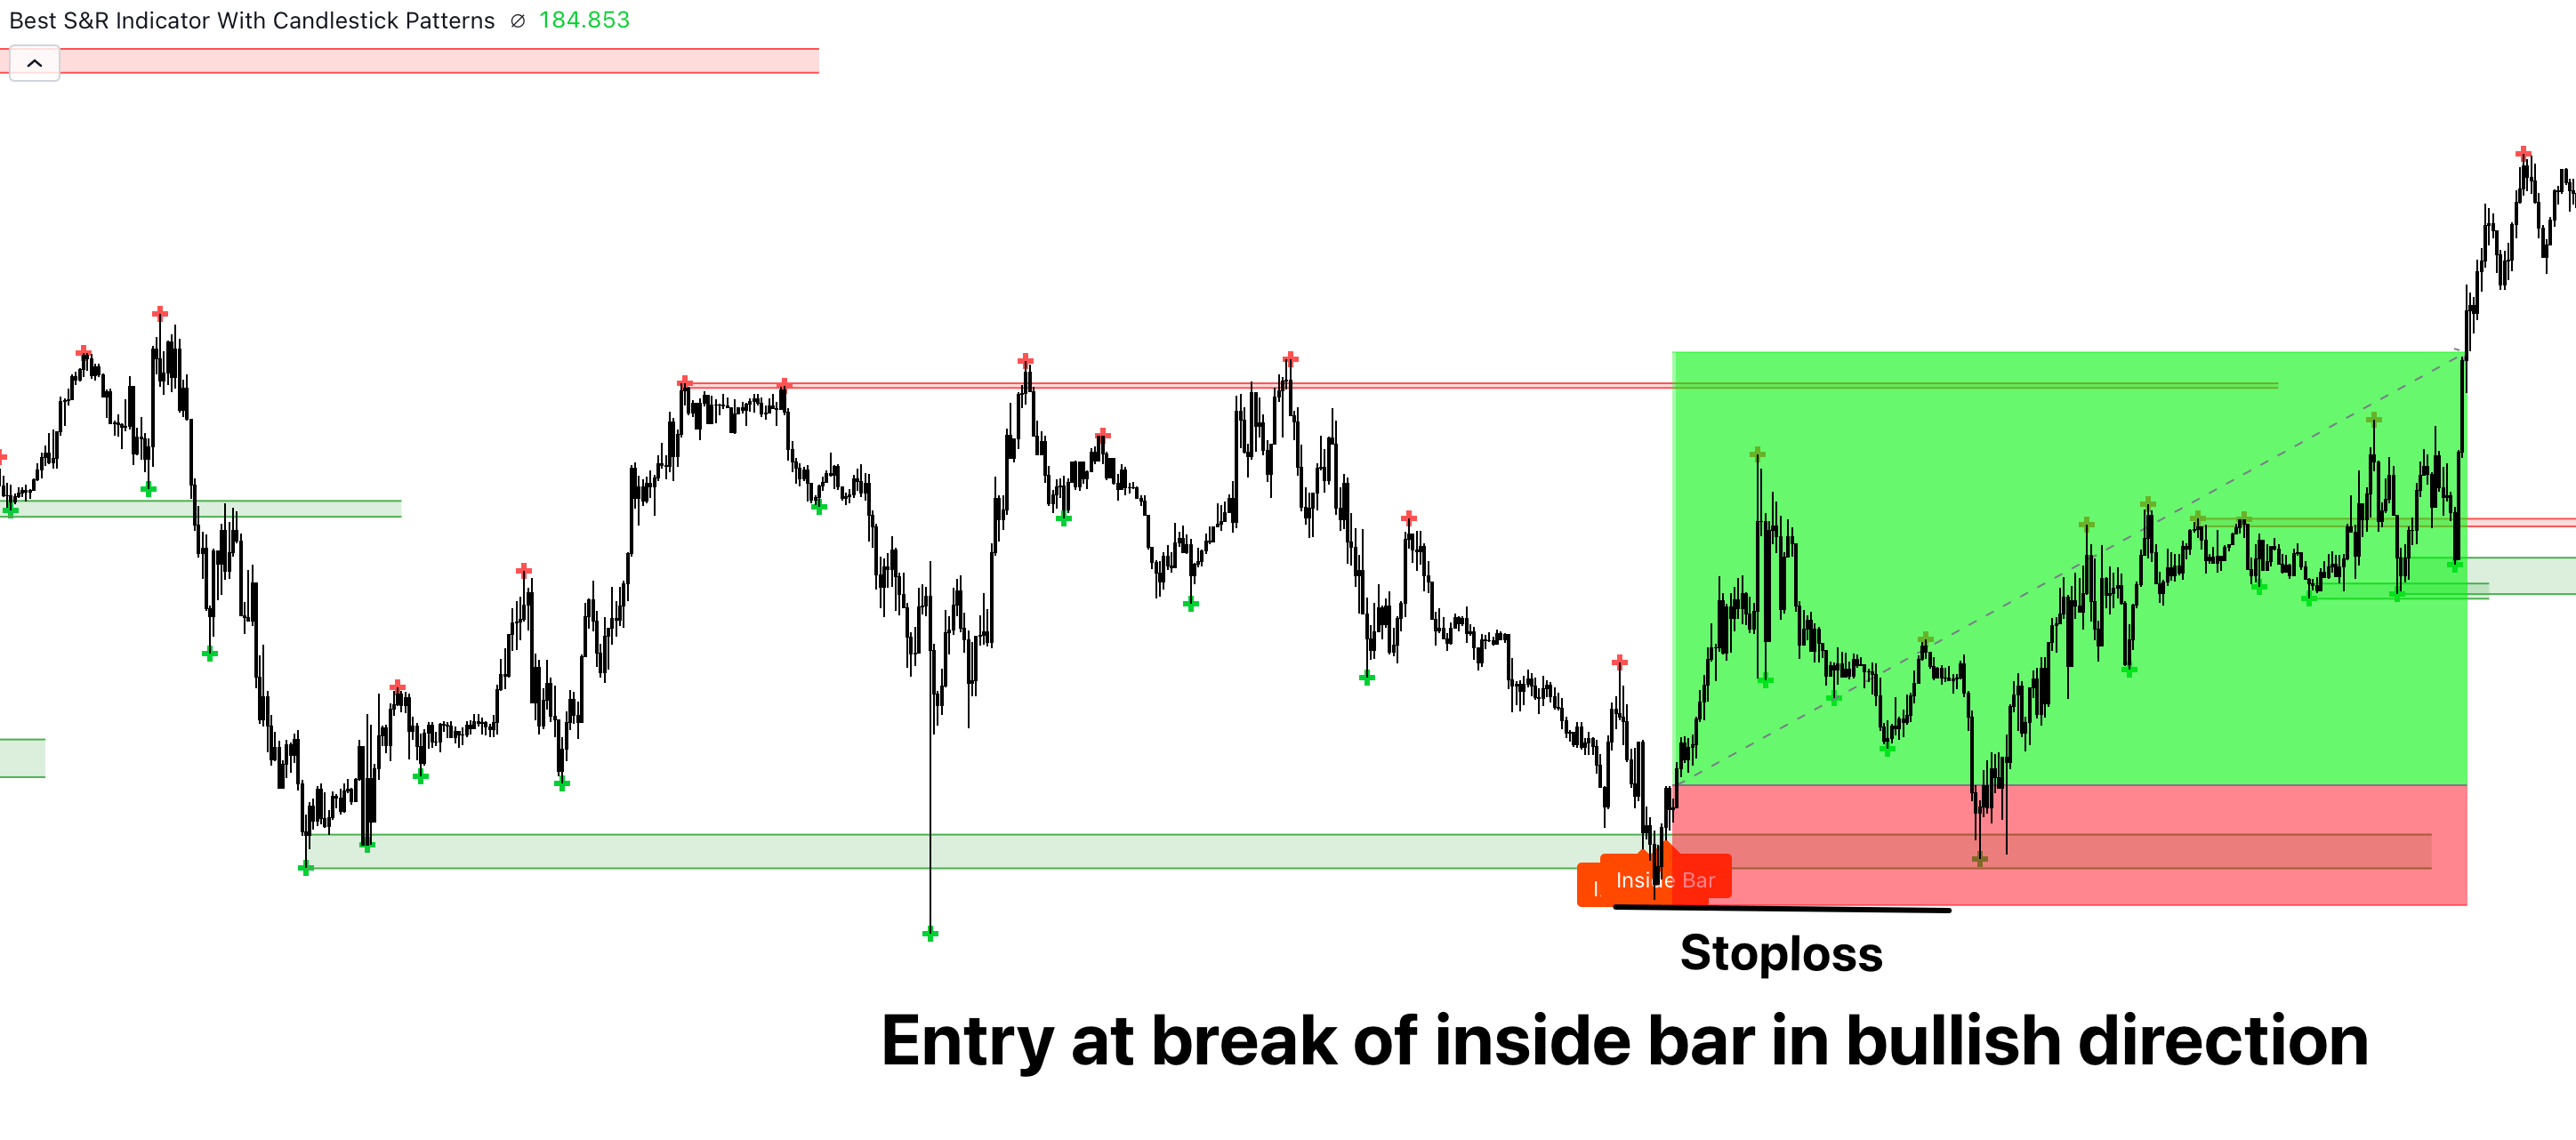
- At support zones, confirm that patterns like the inside bar break in a bullish direction. Ignore bearish breaks as they don’t align with the strategy.
- Conversely, at resistance zones, you want patterns to break bearishly. Bullish breaks are not suitable for entry.
- Executing Trades:
- Enter a trade on the breakout direction that confirms with the zone’s bias (bullish for support, bearish for resistance).
- Set your stop loss just a few pips below the support zone or above the resistance zone for safety.
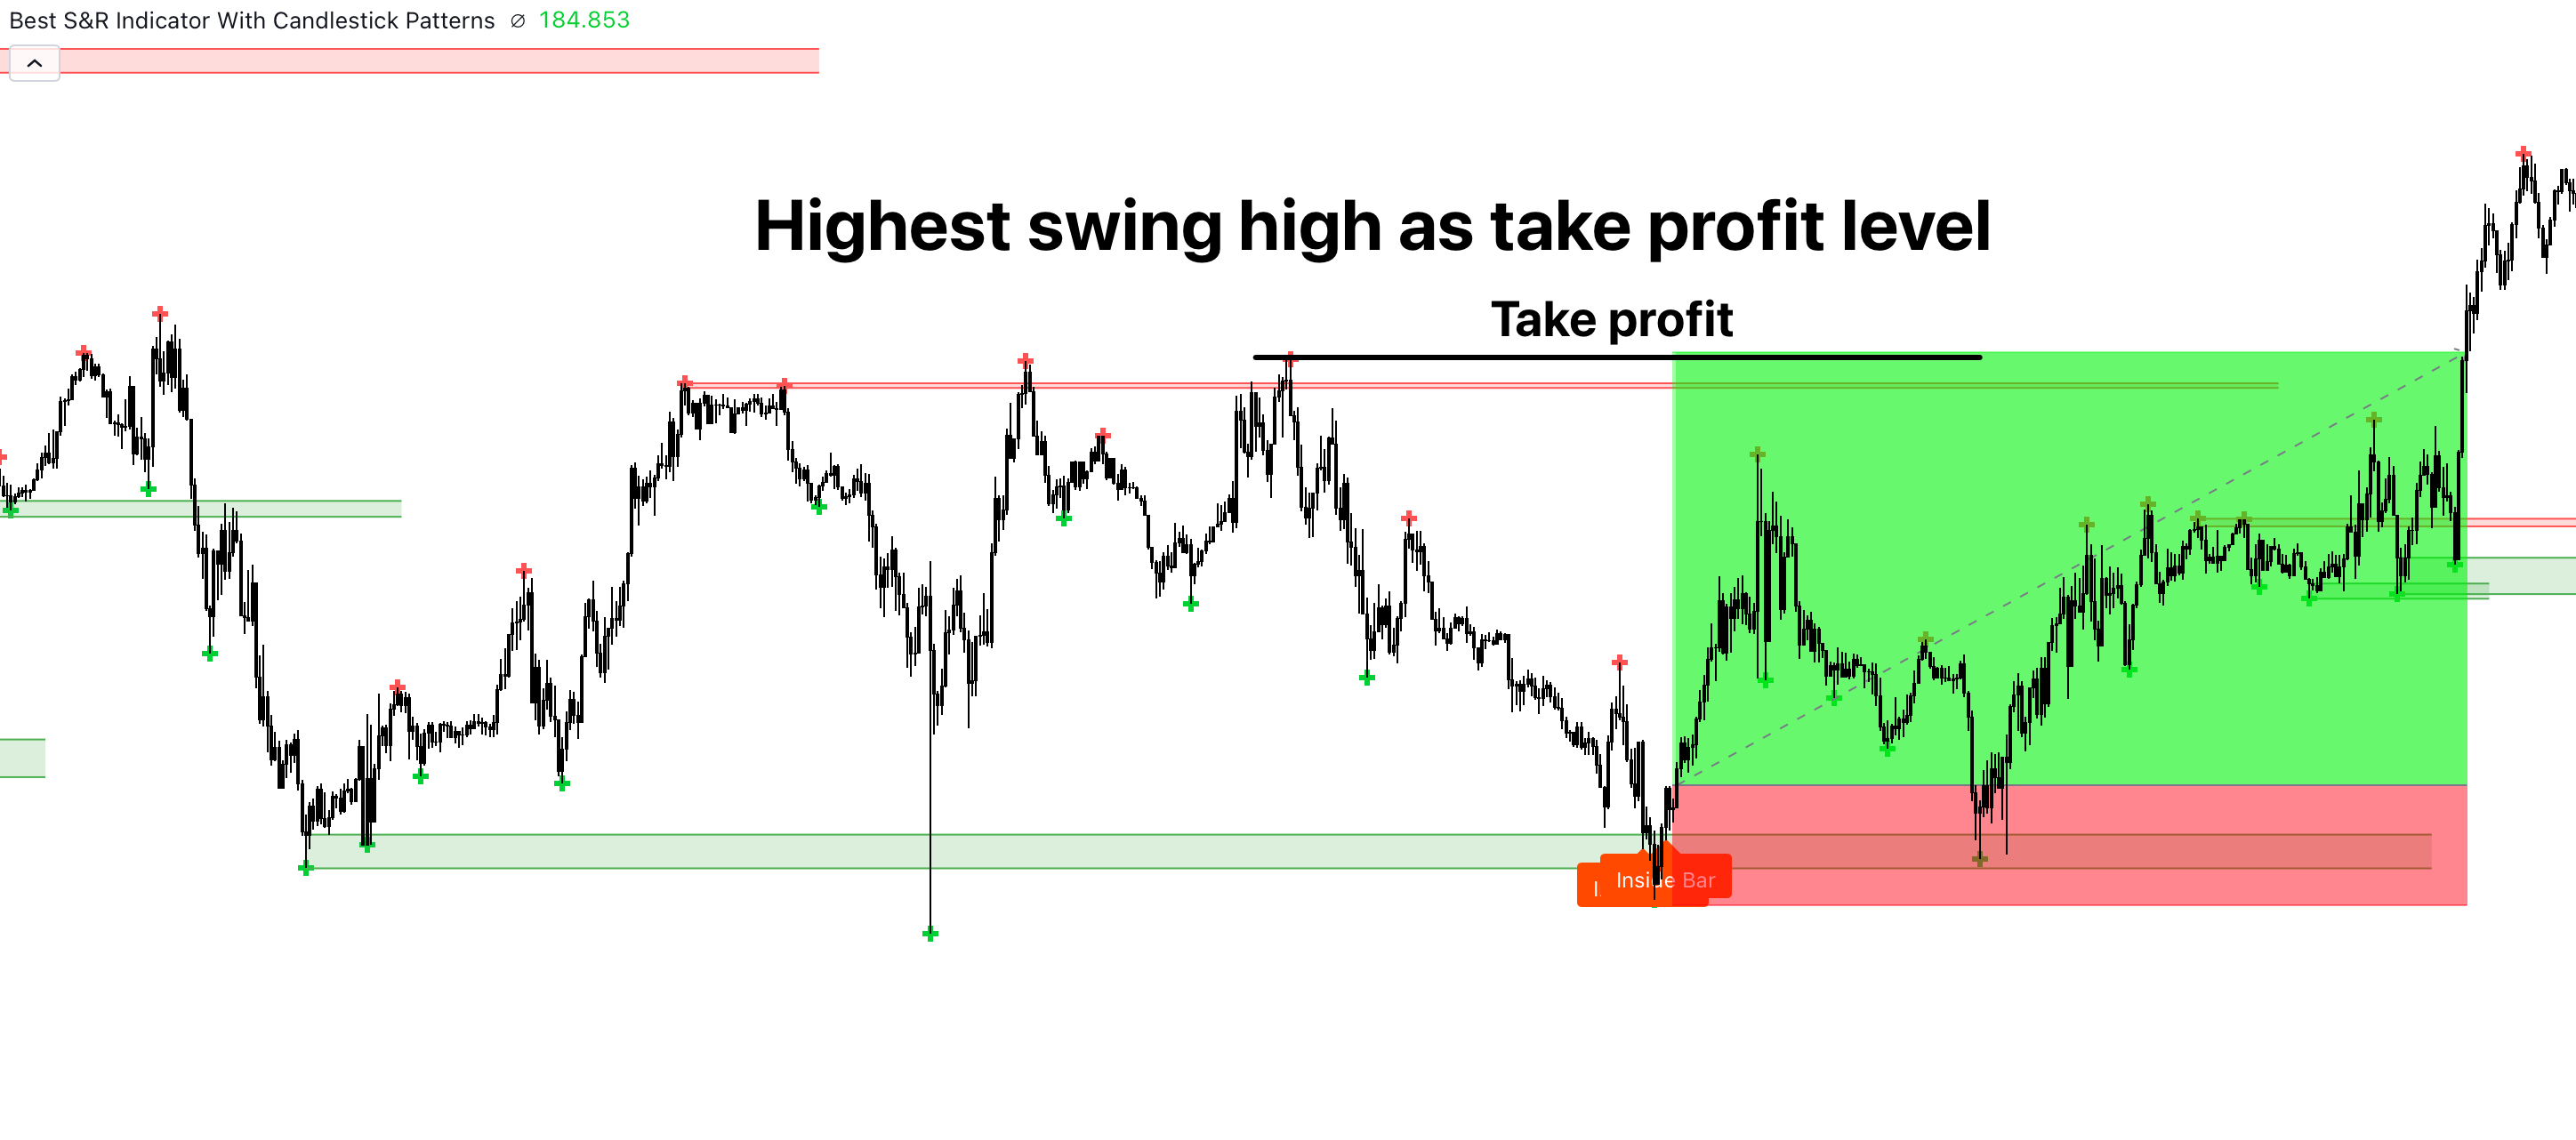
- Setting Take Profit:
- Your initial take profit can be set at the swing lower low in a resistance zone trade or the swing higher high in a support zone trade.
- Your initial take profit can be set at the swing lower low in a resistance zone trade or the swing higher high in a support zone trade.
It’s a disciplined approach that emphasizes confirmation and clear direction, which is essential for maintaining a robust trading plan.
Risk Management Plan
For effective risk management, we’ll use a fixed percentage of 2% per trade. Assuming a starting balance of $10,000, here’s how the account balance would evolve over a sequence of 9 trades with 3 losses and 6 wins:
| Trade No. | Outcome | Risk/Trade | Trade P/L | New Balance |
|---|---|---|---|---|
| 1 | Win | $200 | $400 | $10,400 |
| 2 | Win | $208 | $416 | $10,816 |
| 3 | Loss | $216 | -$216 | $10,600 |
| 4 | Win | $212 | $424 | $11,024 |
| 5 | Loss | $220 | -$220 | $10,804 |
| 6 | Win | $216 | $432 | $11,236 |
| 7 | Win | $224 | $448 | $11,684 |
| 8 | Loss | $233 | -$233 | $11,451 |
| 9 | Win | $229 | $458 | $11,909 |
Note: The profit/loss (P/L) for winning trades is assumed to be double the risk, hence the 2:1 reward to risk ratio. The risk per trade increases as the balance increases, sticking to the 2% rule. After 9 trades, with a strategy that maintains a positive expectancy and disciplined risk management, the balance has increased to $11,909.
Optimizing Your Trading Strategy
To ensure that your trading strategy is as effective as possible, consider the following optimization techniques:
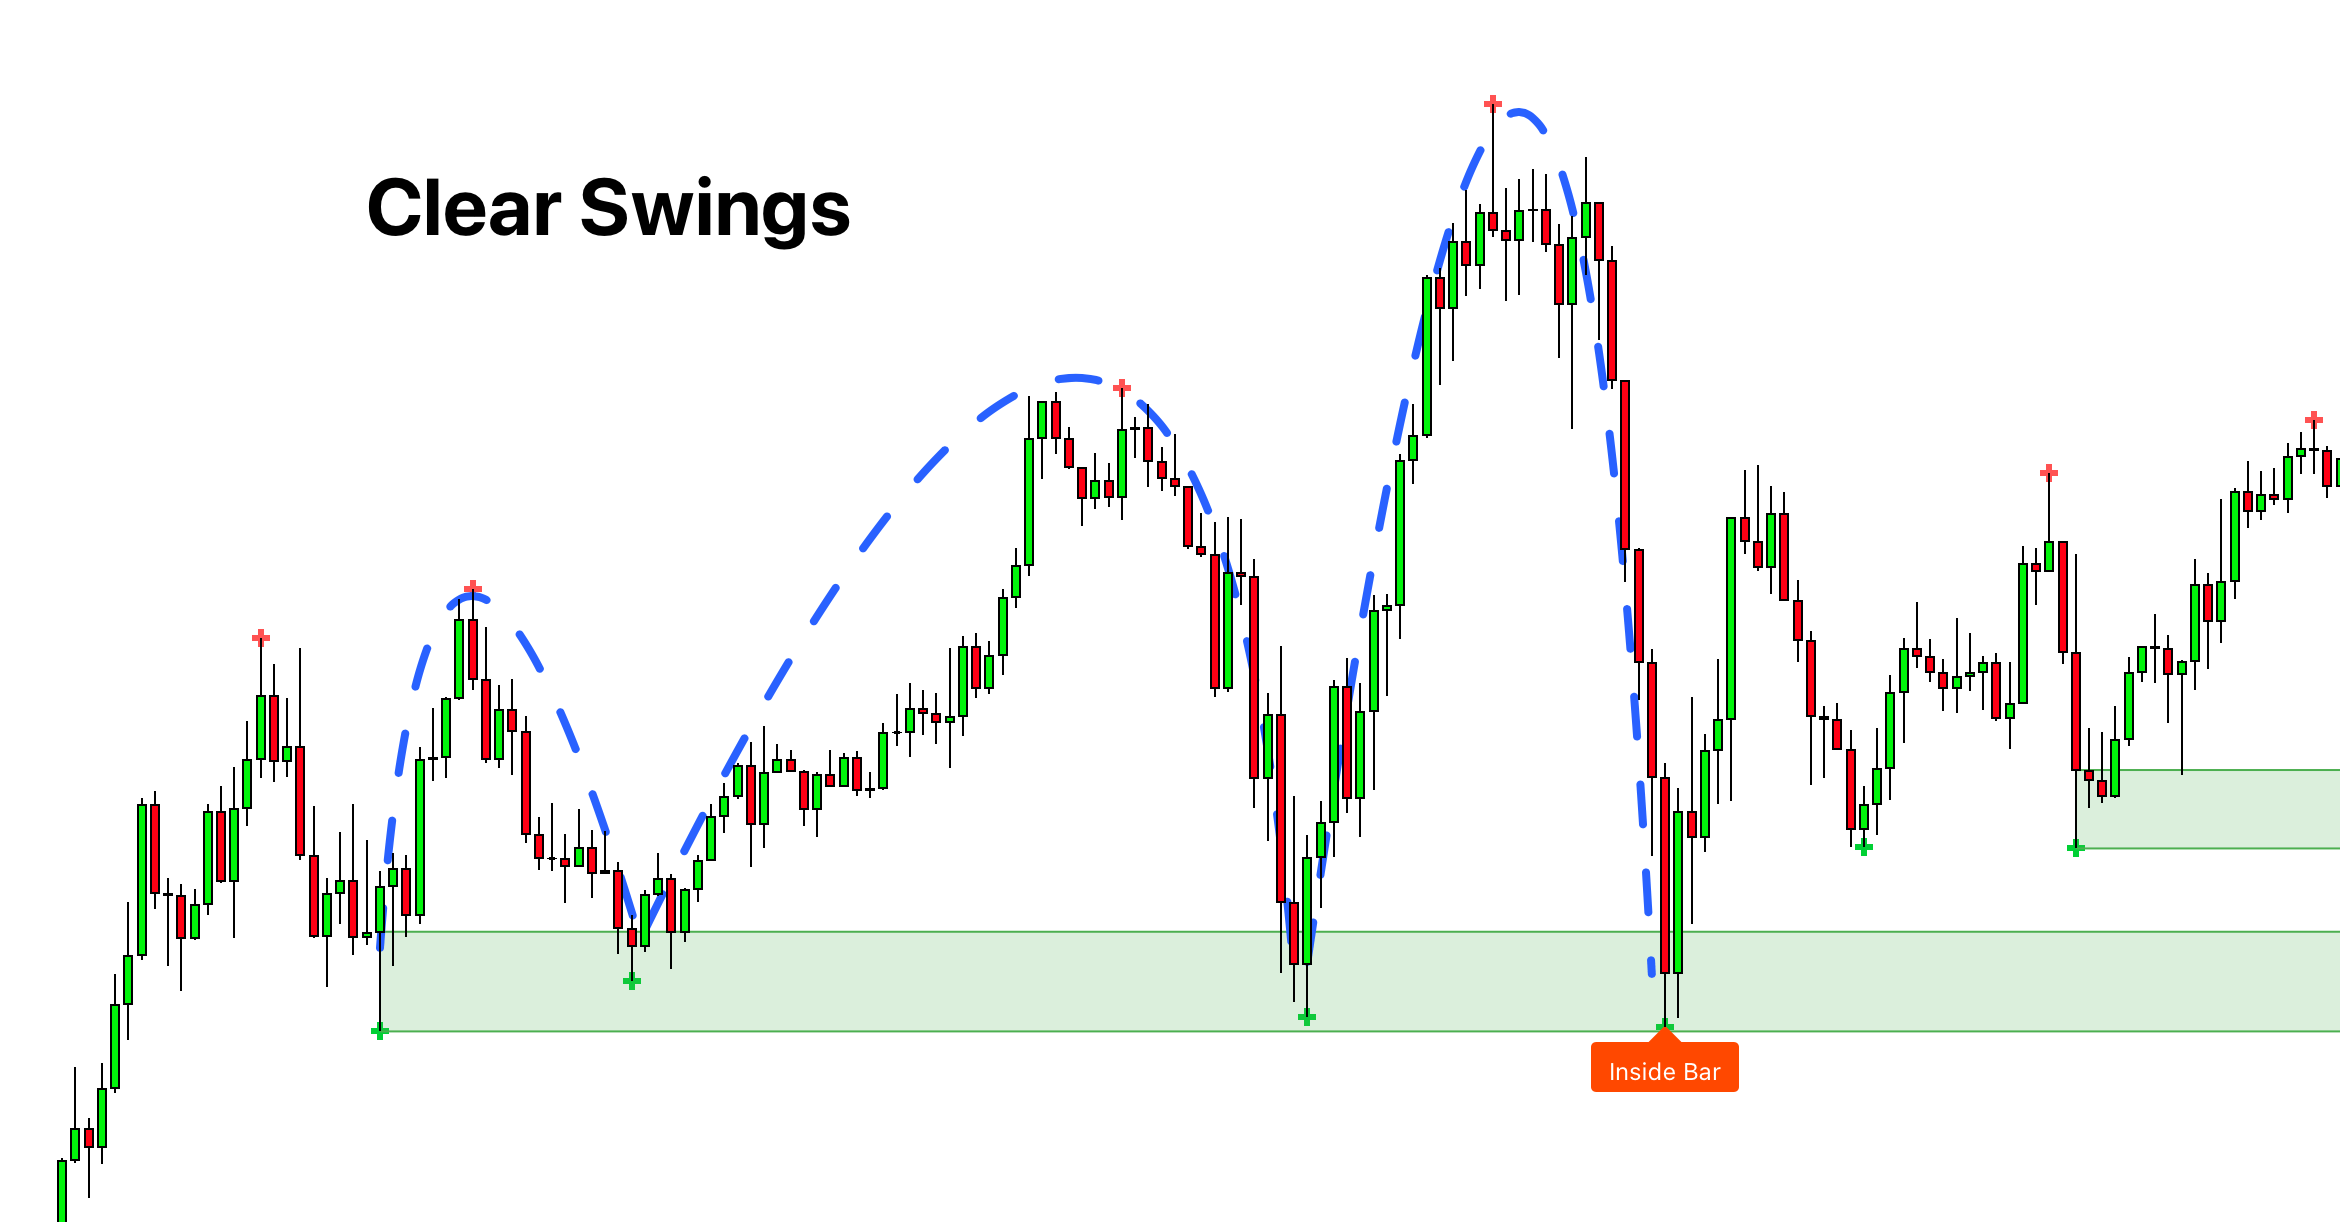
- Clarity of Price Swings:
- A clearer swing in the price means a more reliable indication of where the market is heading. In choppy market conditions, the noise increases, and the reliability decreases. Aim to trade when the swings are pronounced and clear.
- A clearer swing in the price means a more reliable indication of where the market is heading. In choppy market conditions, the noise increases, and the reliability decreases. Aim to trade when the swings are pronounced and clear.
- Optimal Timeframes:
- The chosen timeframes can have a significant impact on the effectiveness of the Support and Resistance Indicator. Recommended timeframes for this strategy are 30 minutes, 1 hour, 4 hours, and daily. These periods provide a good balance between short-term insight and long-term perspective.
- Swing Consideration:
- At least two price swings should be used for the best results when drawing support and resistance levels. This establishes a more robust zone of interest. However, you can adjust this number based on your strategy and trading style for better optimization.
By focusing on these aspects, you can refine your trading strategy, leading to potentially higher win rates and more significant opportunities for profit.
Conclusion
In simple terms, our Support and Resistance Indicator is like having an expert by your side telling you where to look for the best trading spots. It finds important zones and uses candle patterns to tell you when things might be about to change in the market. It’s easy to use and helpful whether you’re looking at the market throughout the day or just checking in once in a while.
For traders who want to keep things straightforward and focus on what the market is doing, this indicator can be really helpful. It’s about seeing the signs clearly and making trading less complicated.