
MACD is a moving averages indicator that uses the phenomenon of convergence and divergence for trend identification. This indicator shows the relationship between two moving averages. This indicator is a basic yet very effective indicator that helps generate the buy/sell signals.
The MACD indicator is a real-time indicator that uses divergence and convergence. Sometimes the simple MACD is also known as the MACD divergence indicator. Some traders prefer to use the convergence and divergence of this indicator as different entities. I will further explain this concept in the article below.
Purpose
The basic purpose of this indicator is as follows.
- To identify the market trend and its bullish/bearish nature.
- To generate the sell and buy signals.
Significance
The MACD indicator is a solid and modern, well-equipped indicator with the following significances.
- It is a real-time indicator that provides a better picture of the market.
- It provides significant information about the market trend and its nature.
- It helps in generating buy/sell signals.
- A trader can find suitable entry and exit points with the help of the MACD indicator.
- It can provide information about an overbought and oversold situation in a trading market.
Types of MACD indicator
Two basic MACD lines behave according to the price change in the market. On the basis of price repulsion and attraction to the central line. We can divide the MACD lines into two types.
MACD divergence
If the prices move away from the central line, we call it MACD divergence. The divergence of the prices indicates a bullish trend. It is the time when the market is gaining bullish power, and the number of buyers is on the higher side. The bullish trend is stronger as the divergence distance from the mean MACD line increases. The bullish sentiments of the MACD convergence provide the opportunity to find the appropriate buy signals.
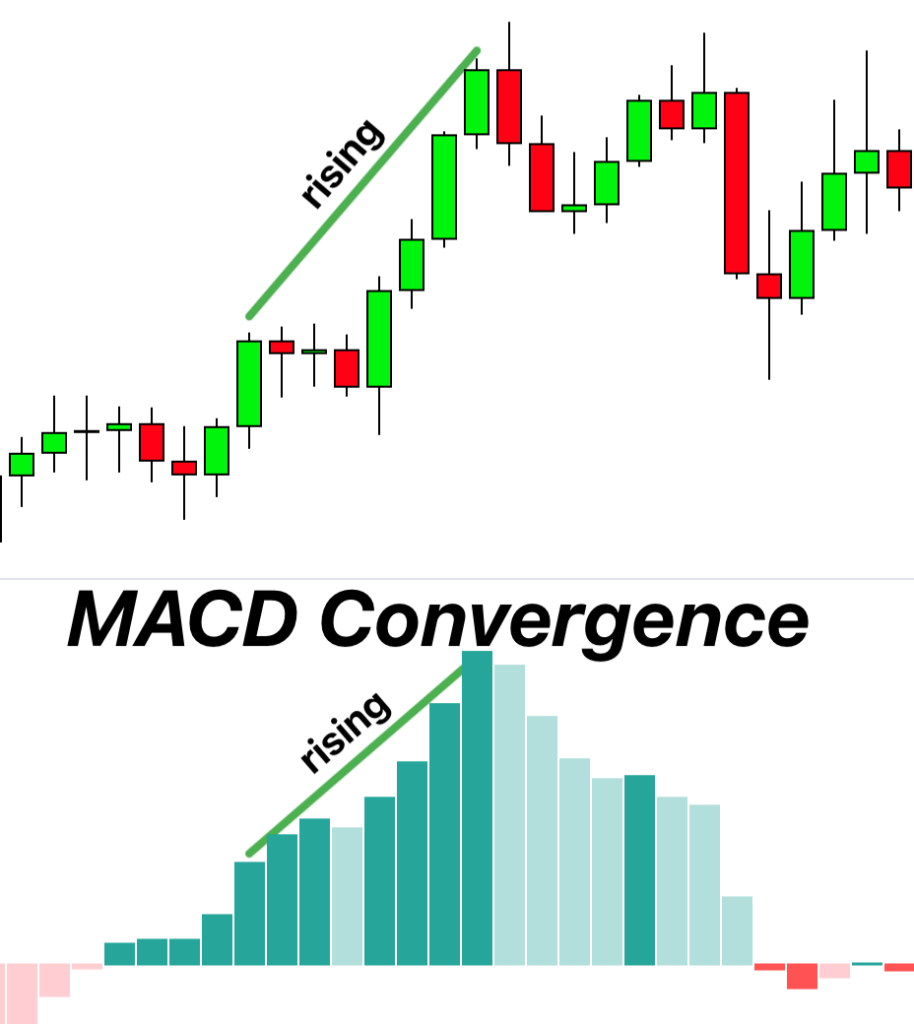
MACD convergence
As the prices move towards the mean MCAD line, it is the convergence of the prices. The convergence of the prices indicates a bearish trend in the market. It provides an opportunity to sell the asset.
Working of MACD
The working of the MACD is as follows.
Calculations
The calculation of the MACD line includes the subtraction of the 26-period EMA from the 12-period estimated moving average.
MACD line = (12-period EMA) – (26-period EMA)
A MACD line is further divided into a slow-moving and fast-moving lines.
Representation of MACD
The MACD or MACD divergence indicators use a histogram to represent a trading chart. The histogram tells the story of the convergence and divergence of the indicator. It helps in finding the bullish/bearish sentiment of the market.
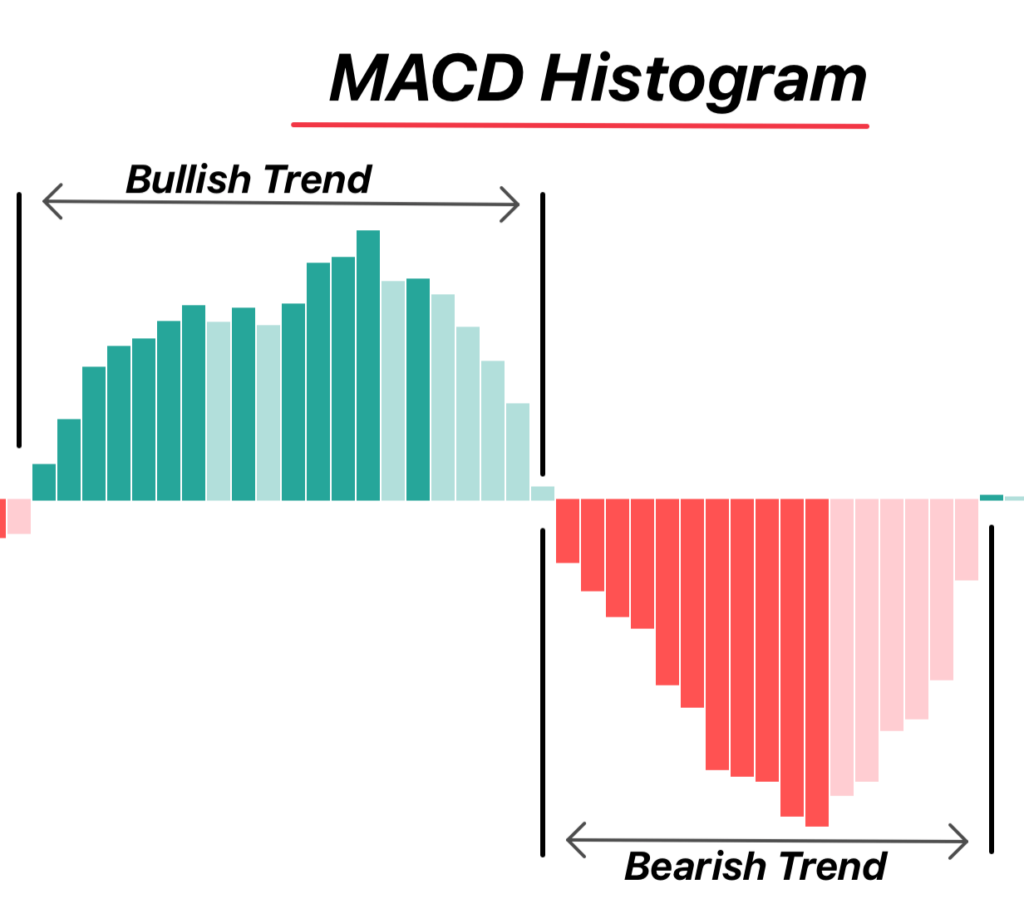
MACD histogram
The modern trading chart offers different representation methods for the MACD indicator. The most common and preferred method is to display this indicator as a histogram. In a traditional MACD setup, a histogram uses two colors. The area of the histogram above the zero line represents a bullish trend. On the other hand, the area below the zero line is a bearish one.
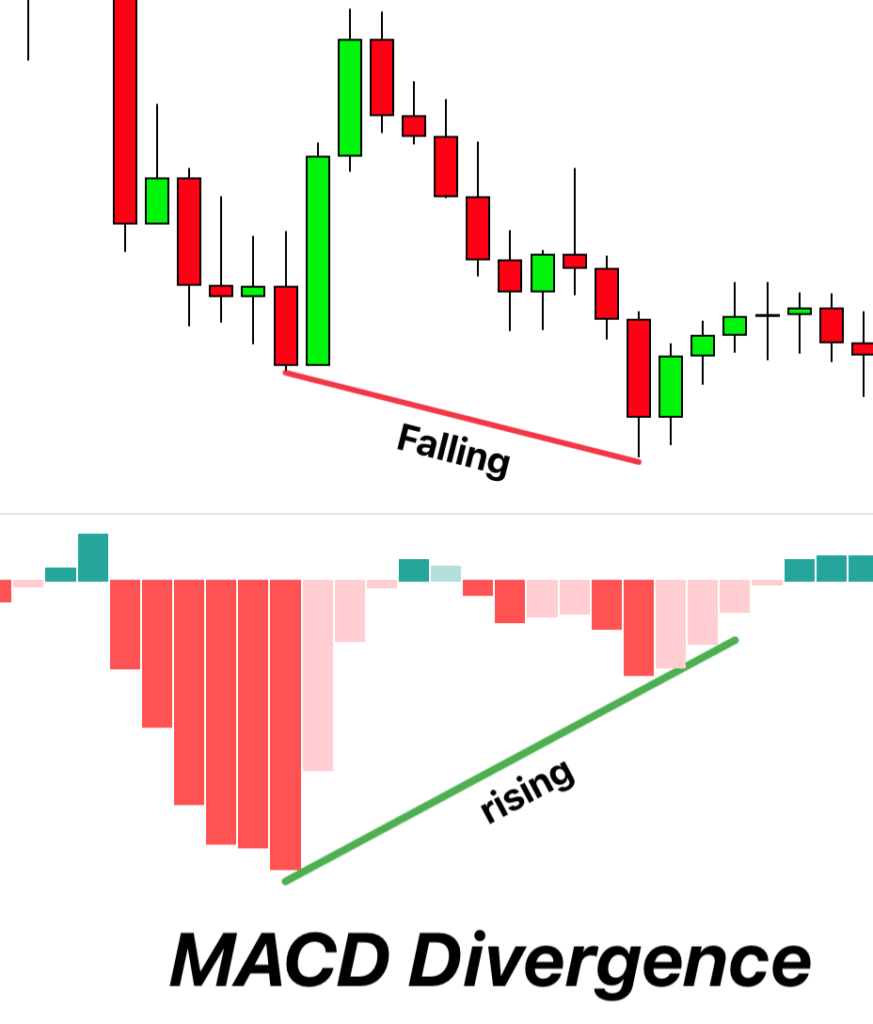
Convergence and divergence
As the prices move away from the central MACD line, there is a divergence of the prices. The greater the peak of the histogram, the bigger the divergence of the prices. It represents an overbought phenomenon and helps in generating the buy signals.
As the prices dip below the MACD line, it is a bearish divergence. The greater the bearish divergence, the bigger the lower the histogram. It represents an oversold phenomenon of the market.
When the histogram makes the smaller peaks near the MACD line, it means the prices are moving towards a mean point. It is the convergence of the prices.
Trading strategy
We can formulate a trading strategy with the help of the MACD or MACD divergence indicator.
The trading strategy is as follows.
Entry
For an appropriate entry with the MACD indicator, the best time to enter a trade is when the prices begin to diverge from the MACD line. It is the time when the prices usually begin to rise, so you can enter a trade to facilitate the future higher prices. The other way to make an entry in the market is when the slow-moving and fast-moving MACD lines overlap each other.
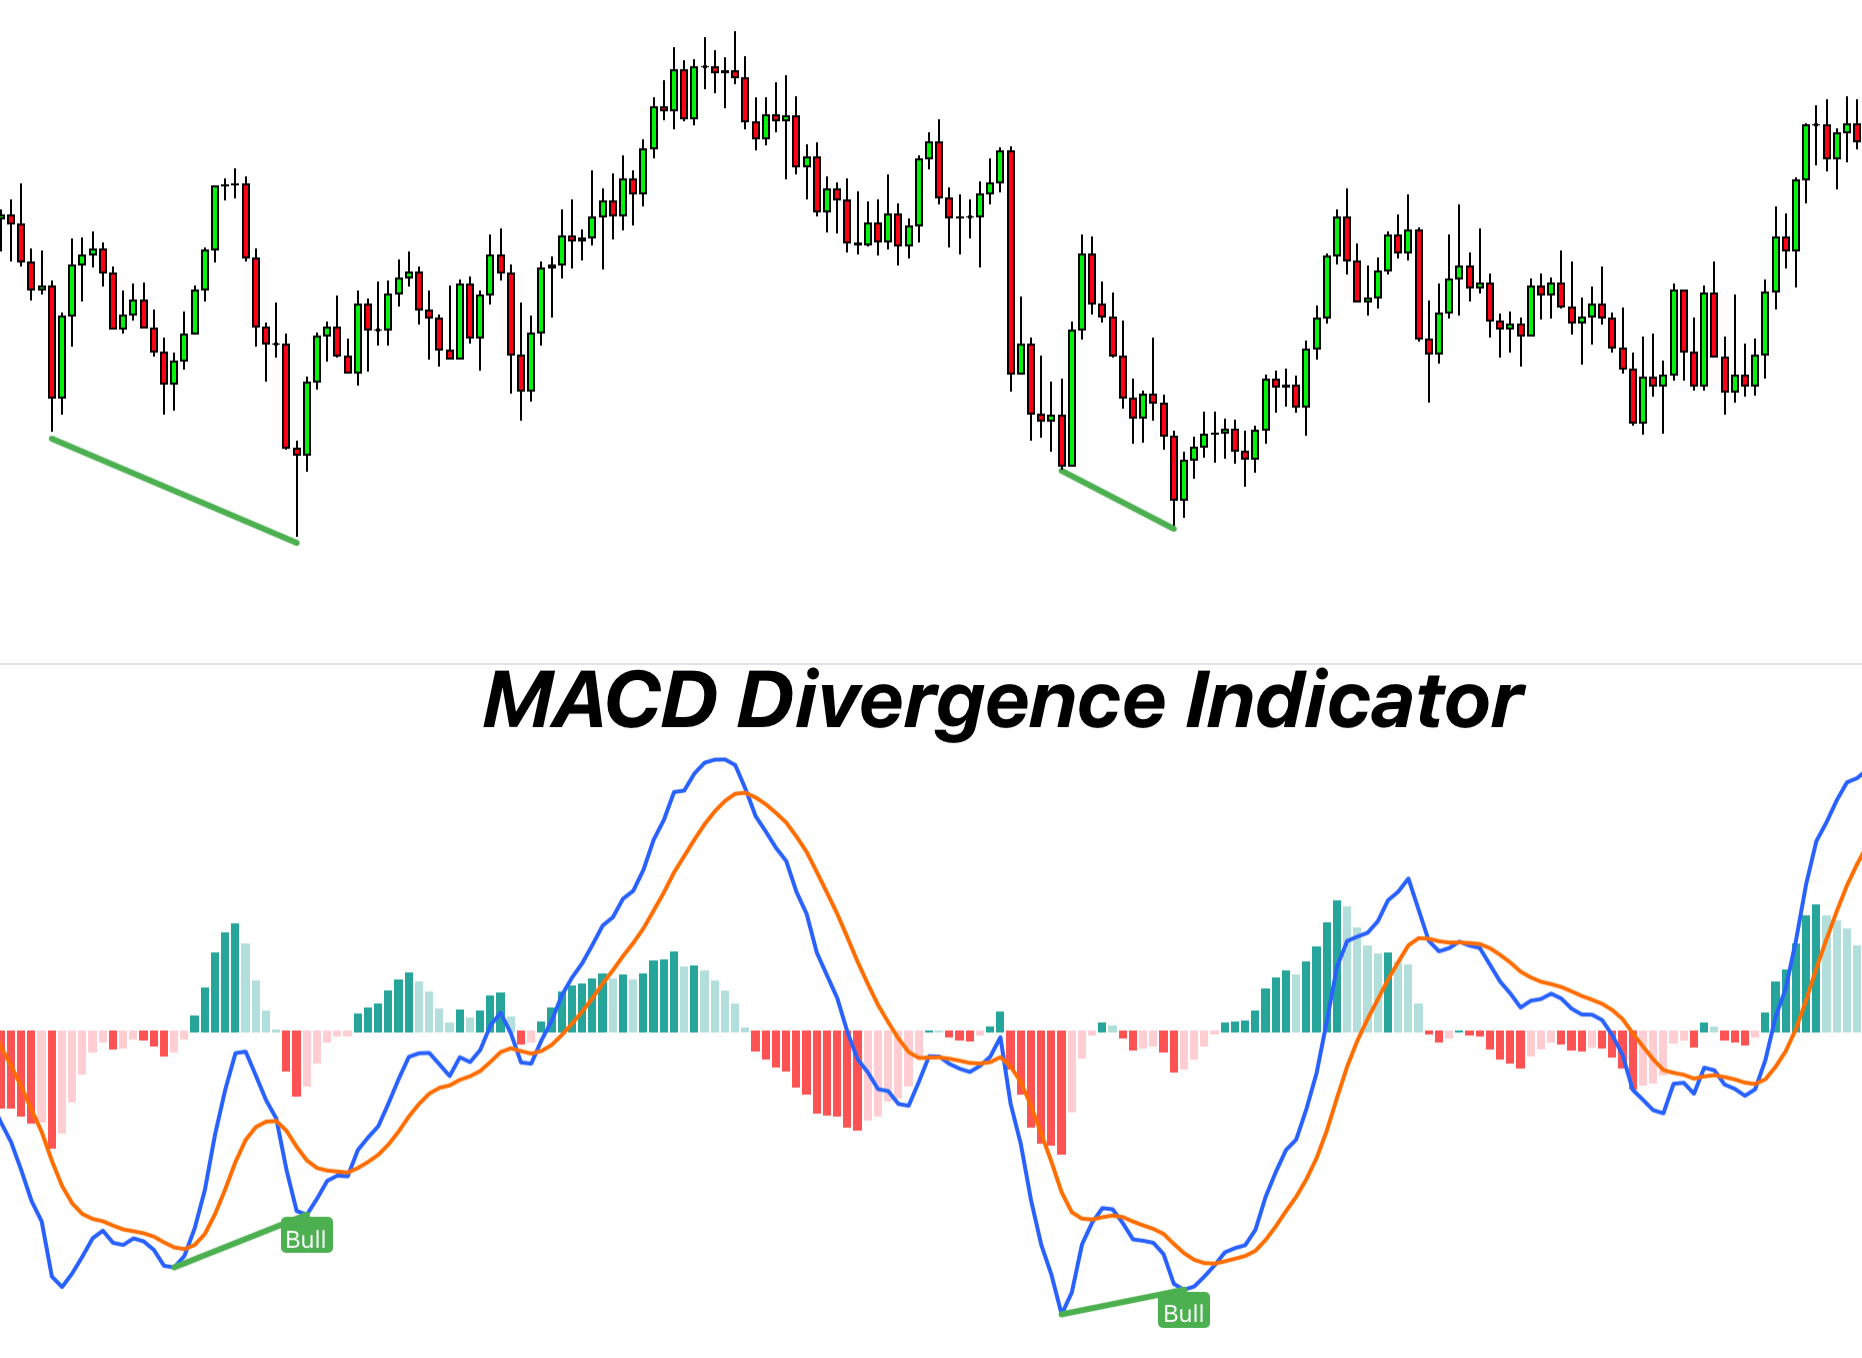
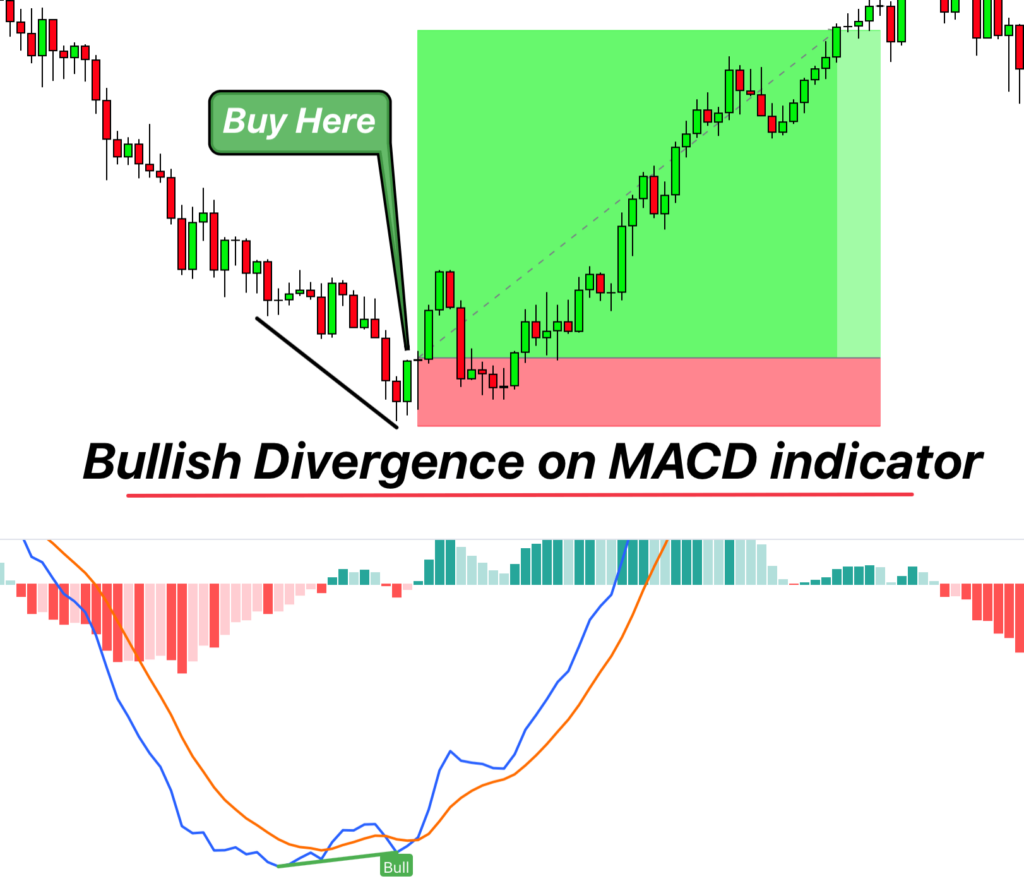
Bullish MACD divergence
When the macd indicator shows the higher lows while the price is showing divergence in the form of lower lows then open a buy trade on confirmation of a candlestick pattern or a big bullish candlestick.
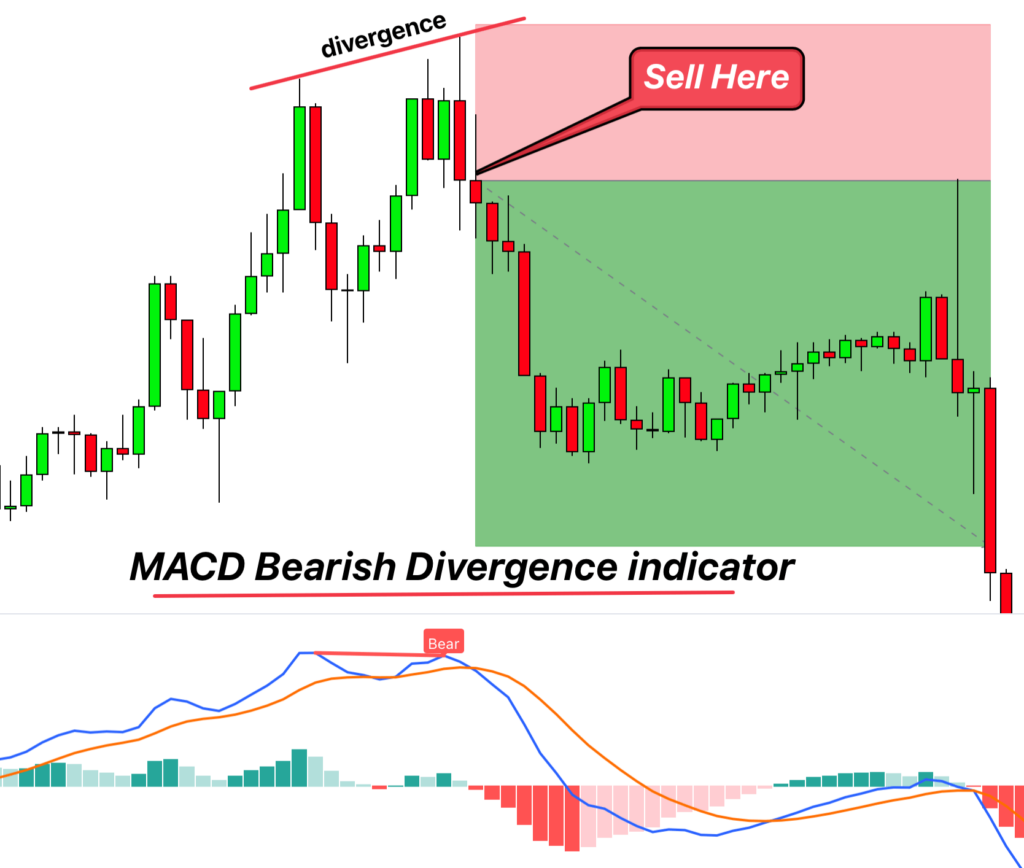
Bearish MACD Signal
Open a sell trade when the indicator forms lower highs while the price is making higher highs. Make sure to confirm the signal with the help of a bearish candlestick pattern.
Risk management
It is very vital to manage your risks while placing a trade. Always use stop loss at appropriate positions. The use of resistance and support zones also helps in managing the risk.
Take profit
Once you enter a trade, you must keep an eye on the divergence and trend reversal. The prices usually begin to reverse after exhibiting a maximum reversal. It is the best time to exit your trade and make a handsome profit.
Best settings
The MACD indicator provides the luxury of default settings. The user can change the settings according to his personal choices, preferences, trading experience, and trading goals. The most common inputs for this indicator are as follows
| Function | Value |
|---|---|
| Fast EMA length | 12 |
| Slow EMA length | 26 |
| Signal length | 9 |
| MA length 1 | 10 |
| MA length 2 | 15 |
| MA length 3 | 30 |
Success ratio
This indicator is a decent indicator with more than 50% success ratio. To achieve the trading goals and increase your chances of success, you need to find the confluence of this indicator. The Bollinger band and RSI offer one of the best confluence with the MACD indicator.
| Pros | Cons |
|---|---|
| It is a very easy and simple-to-understand indicator. | It is a real-time indicator that can lag at times. |
| It provides an attractive and user-friendly representation. | The lagging of this indicator leads a trader to miss important trading opportunities. |
| It helps in identifying a bullish/bearish trend. | It can generate false signals. |
| It is a well-calculated and advanced form of modern-day technical trading tool. | It requires the confluence of other technical trading tools for a better success ratio. |
| MACD explains the overbought and oversold market phenomenon. | |
| It helps in formulating a trading strategy. |
Variation of MACD indicator
There is a more advanced and latest form of the traditional MACD indicator. It is known as the MACD-4C indicator. The MACD-4C indicator works on the same principles but provides a better representation. The MACD-4C indicator uses four different colors for the representation of the histogram. These colors enhance a better understanding of the trading picture, which helps make better decisions.
Conclusion
The MACD or MACD divergence indicator is a well-equipped modern-day technical trading tool. It mainly helps in identifying the bullish/bearish nature of the market. This indicator provides a decent representation and helps make a more confident trading experience. The good of this indicator is there, yet you need to use this indicator very carefully in confluence with other trading tools. Otherwise, you might face mixed results in your trading sessions.