
Definition
Keltner channels are bands which base on volatility and help find the direction of a trend in a market. They tell us about the continuation of a market.
These channels are based on the average true range (ATR). This indicator is also capable of identifying a trend in a volatile market. The founder of this indicator is Chester Keltner, who used this indicator in 1960. The traditional formula of this indicator was a simple moving average (SMA). Later on, the average true range (ATR) is used in the formula of the Keltner channel.
Purpose
The purpose of using this indicator is as follows.
- To find the price direction in a volatile market.
- To identify a bullish/bearish trend
- To predict the continuation of a price market.
Significance
This is a good modern-day technical analysis trading tool that offers several benefits to a technical trader. The main benefits of using the Keltner channel indicator are as follows.
- This indicator is very effective in a volatile market where the prices of an asset move very rapidly.
- This indicator helps in finding the trend in a trading market.
- You can predict whether the prices move in a continuation pattern or follow a trend.
- Keltner channel helps in formulating a trading strategy.
- It can signal a strong uptrend and downtrend.
Components of Keltner channel indicator
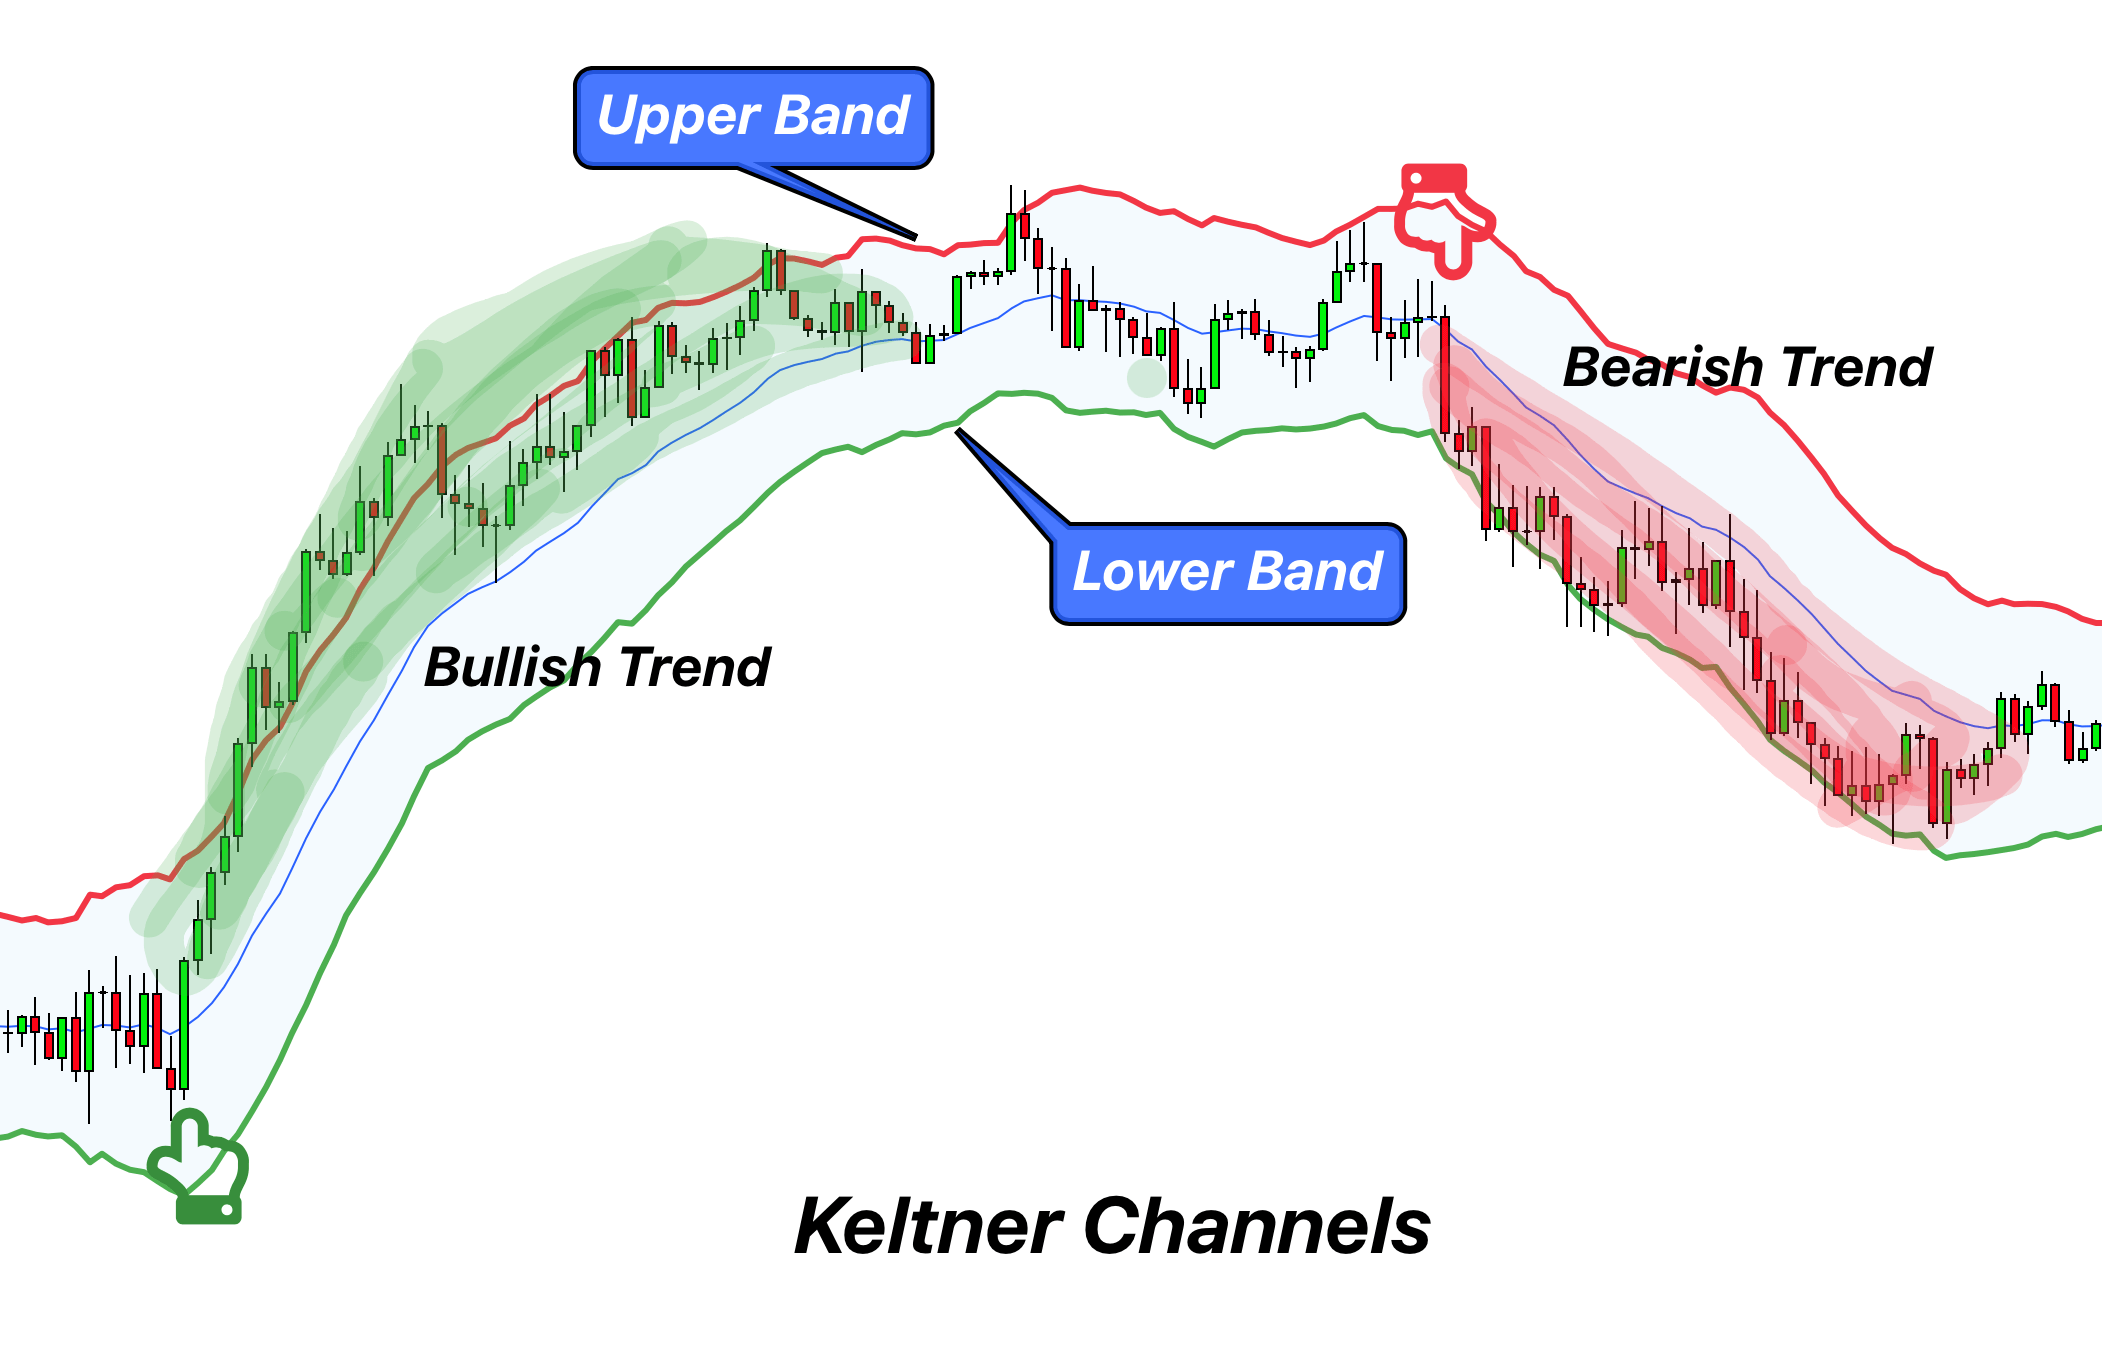
The working of the Keltner channel is very easy and user-friendly. The preview of this indicator contains three bands.
- Upper band
- Middle band
- Lower band
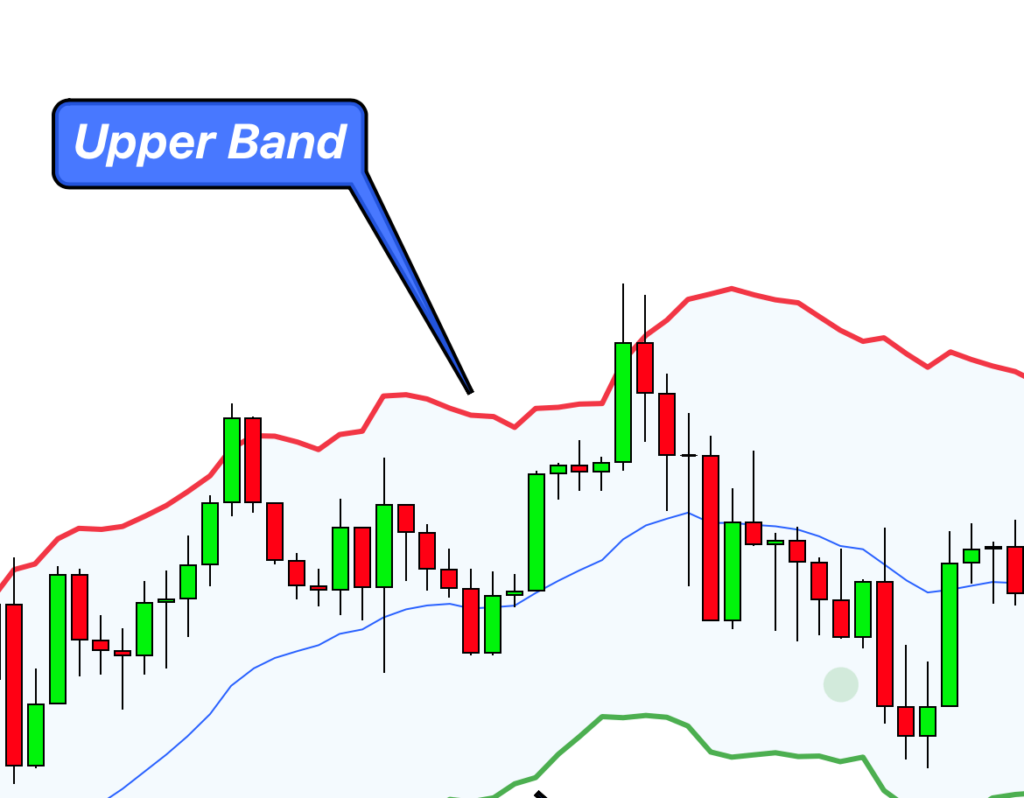
Upper Band
The upper band of the Keltner Channels is typically calculated by taking the Exponential Moving Average (EMA) of a security’s price (often a 20-day EMA) and then adding a multiple of the Average True Range (ATR) to it. The formula can be represented as:
Upper Band = EMA(price, n days) + (m times ATR(n days))
EMA(price, n days)is the Exponential Moving Average of the price over ‘n’ days.ATR(n days)is the Average True Range over ‘n’ days.mis a multiplier (often 2).
Middle band
This band is located in the middle of the indicator. It usually stays stable and doesn’t deviate much from its course. One compares the bullish and bearish markets with the help of this middle band. If the prices rise above the middle band, the market is facing a bullish trend. The market faces a bearish trend as the prices move below the middle band.
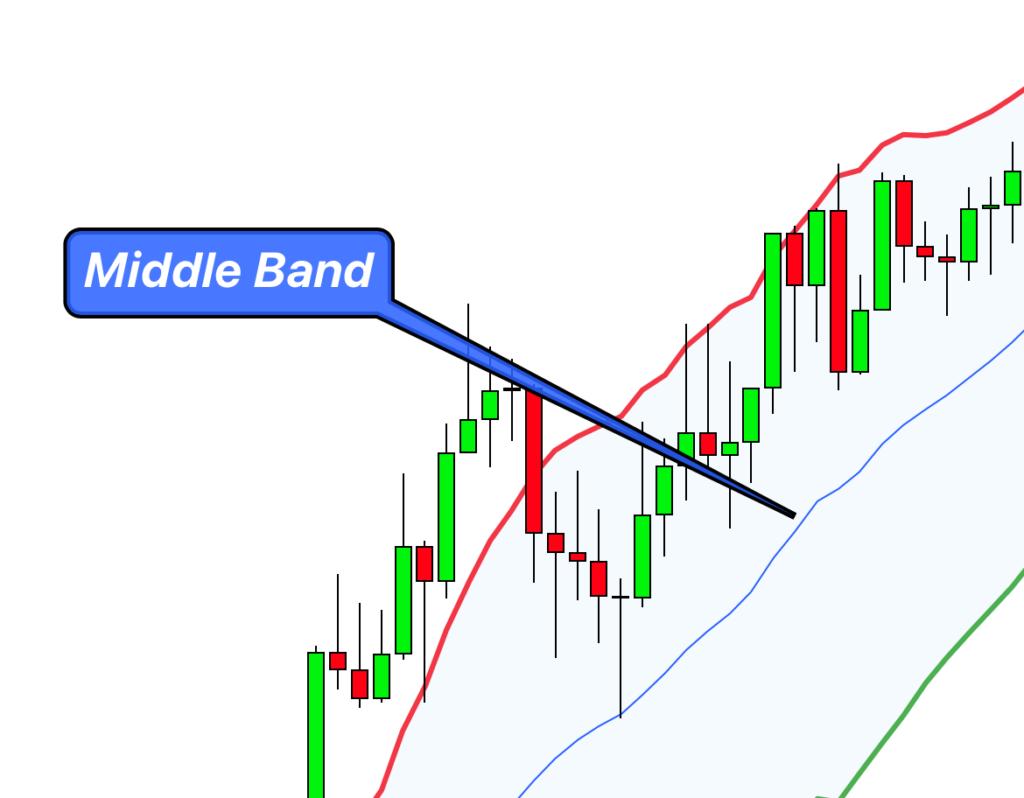
You can also use the middle band of the Keltner channel as a pivot to observe the divergence and convergence of the prices.
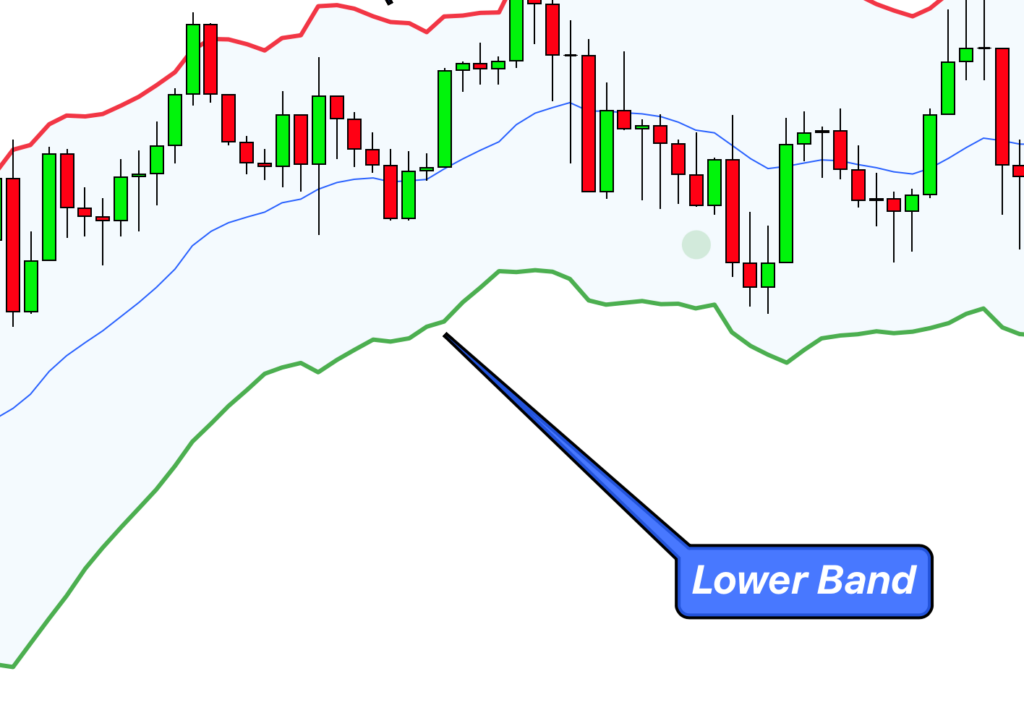
Lower band
The Lower Band of the Keltner Channels offers insight into potential oversold conditions in the market. It is computed by subtracting a multiple of the Average True Range (ATR) from the Exponential Moving Average (EMA) of a security’s price.
Lower Band = EMA(price, n days) – (m times ATR(n days))
EMA(price, n days)is the Exponential Moving Average of the price over ‘n’ days.ATR(n days)is the Average True Range over ‘n’ days.mis a multiplier (often 2).
Identify the trend using the Keltner Channels
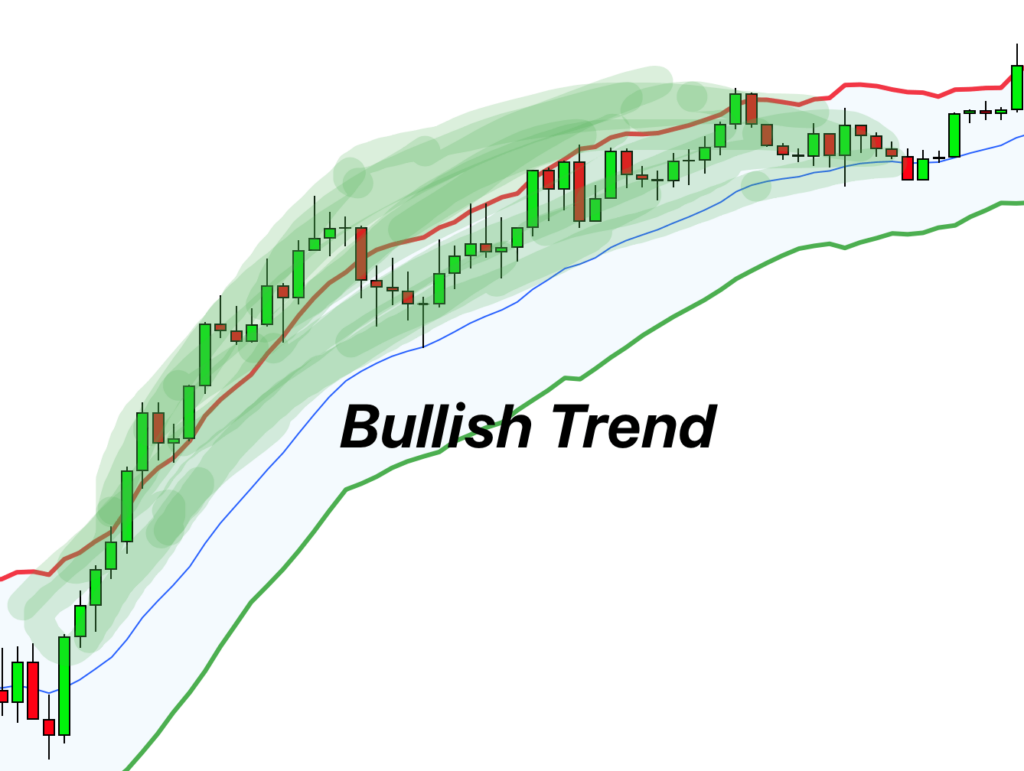
Bullish Trend
Think of the middle line as a sort of reference point. If you’re seeing the price not just staying above this line, but also getting cozy with the upper line, you’ve got a classic sign of a bullish market. It’s like the market’s giving a thumbs up, saying things are looking up. So, if you’re tracking the movement and see the price sticking up there, close to that upper band, it’s a good hint that the market’s feeling positive and prices could continue to rise.
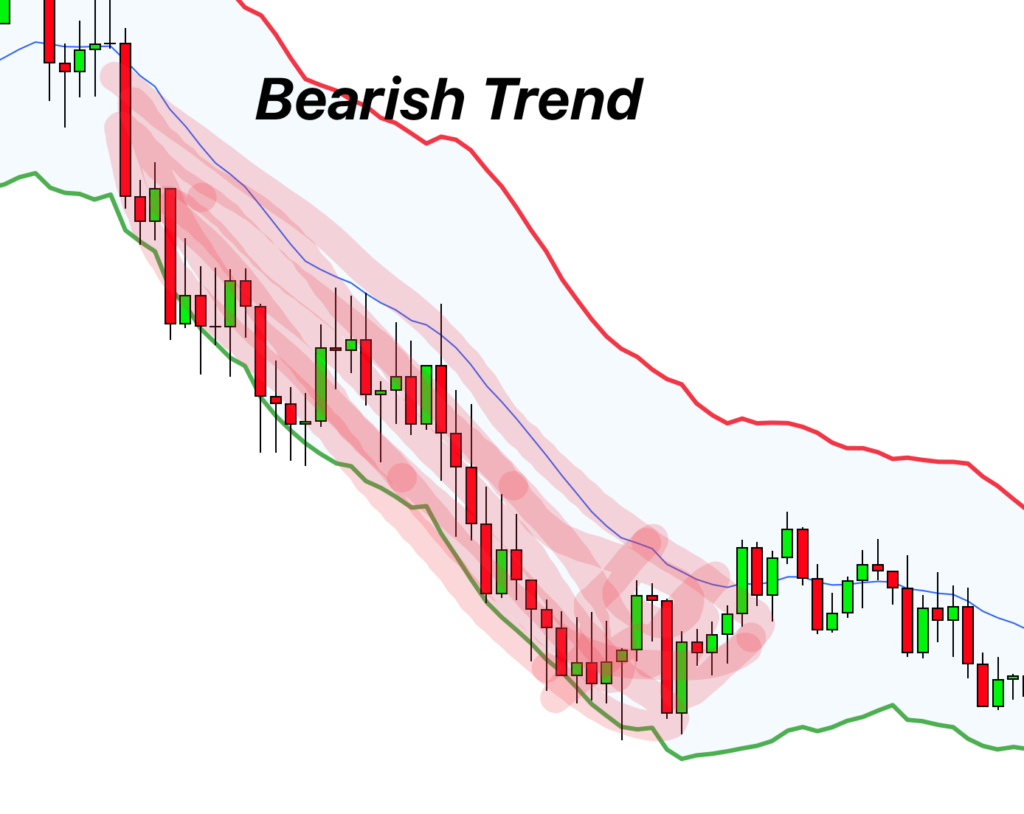
Bearish Trend
Now, if we flip the situation, things are a bit different. If the price is hanging out below our reference point, the middle line, and seems to be making friends with the lower band, it’s a sign the market isn’t doing too hot. This is a bearish indicator. It’s like the market’s waving a little red flag, suggesting things are on a downward slope. If prices keep lingering near that lower line, it’s a heads up for traders that the market sentiment is negative, and prices might continue to drop.
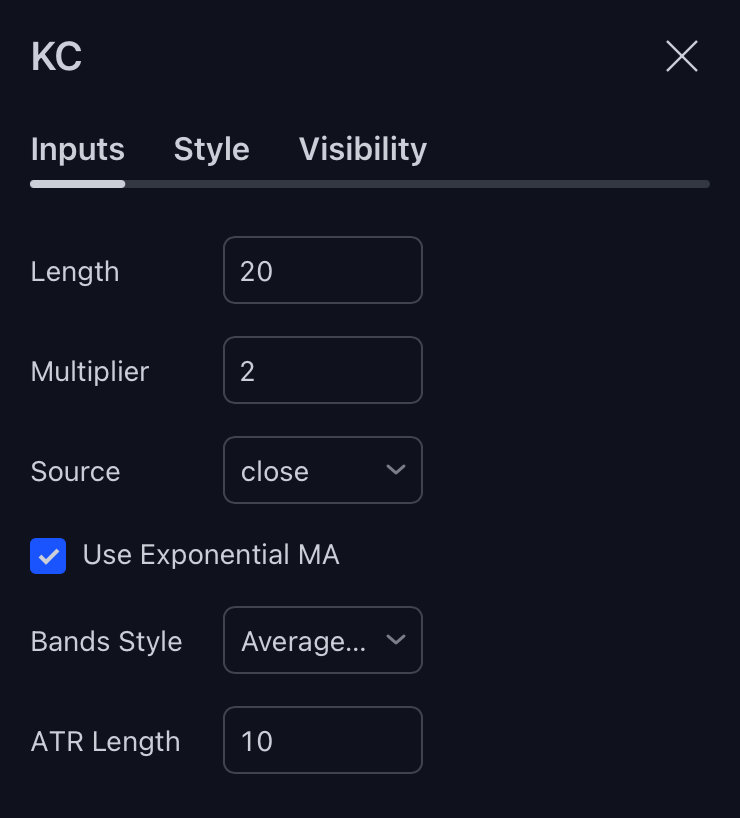
The best settings for KC
Keltner channel allows you to change its setting according to your choices and trading experience. The default setting for KC is as follows.
The length is 20, and the multiplier is set at 2. The ATR length is 10 for most of the trades, but you can always adjust it according to your trading goals.
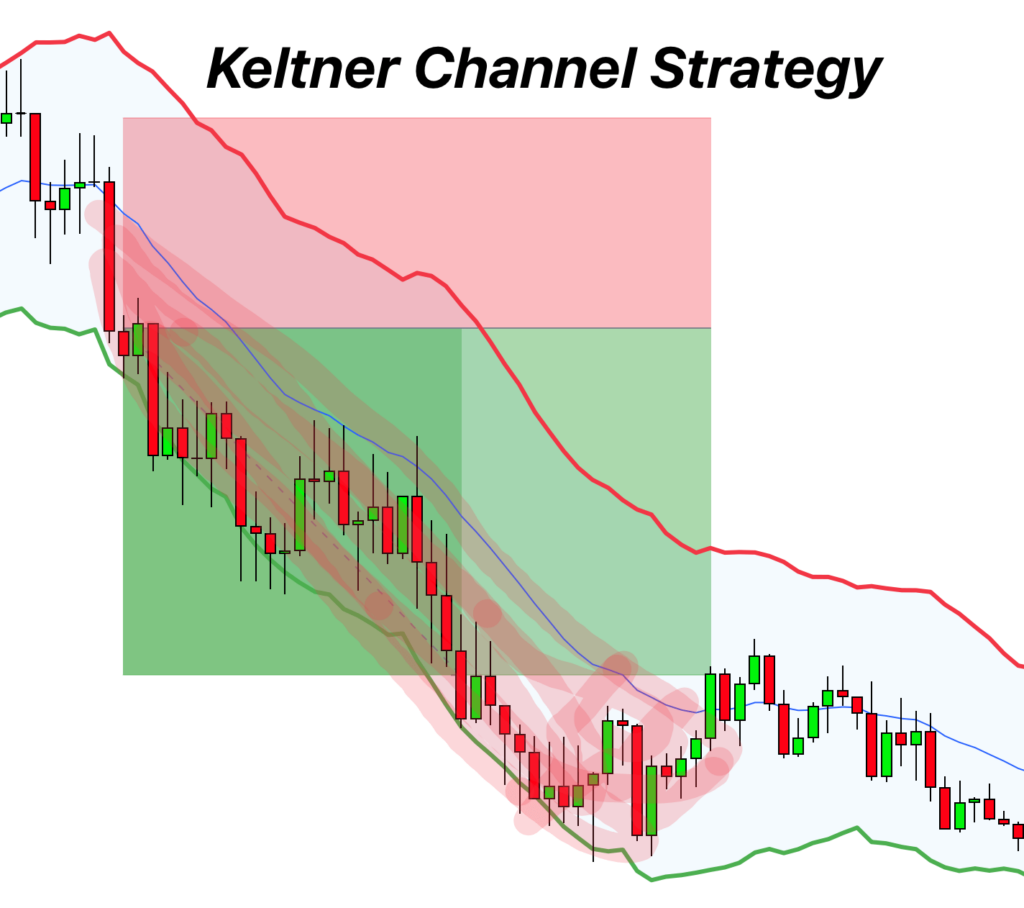
Trading strategy
The Keltner channel is a decent indicator that helps you to find a good trading strategy. The positioning of the prices with reference to bands of the Keltner channel can signal the buy and sell signals. The following trading strategy is effective when you are dealing with the Keltner channel indicator.
Entry and Exit
The upper and lower bands are based on deviation from the average value. When price will touch the upper band then it will tocuh the middle average line. because it is natural that price always want to achieve the balance and balance is the average line.
In case of a good trading entry, you need to observe the upper band of the Keltner channel. As the band begins to rise and continuously move at a higher level, it is time to enter into a trade. You should also keep an eye on the divergence of the upper and middle bands. The greater the divergence, the better the entry point.
Open sell trade when price will form any bearish candlestick patterns at the upper band or break the middle band with big bullish candlestick.
Open the buy trade when price will form any bullish candlestick pattern at the lower band or break the middle band with big bearish Candlestick.
Stoploss should be adjusted above or below the last swing high or above the upper or lower band.
Risk management
Risk management is one of the most vital steps in a trading strategy. You need to place the stop loss at the prior high point to the entry of the trade. In case of a bearish trade, place the stop loss below the prior low point of the entry.
Take profit
To take a profit, you can keep an eye on the uptrend and downtrend of the market.
On sell trade, close the trade when price will touch the lower band.
On buy trade, close the trade when price will touch the upper band.
Moreover, use the RSI indicator in the confluence of the Keltner channel to make the maximum profit from your trades.
Success ratio
It is a high success ratio indicator as 80% of the time, the prices of the market stay between the upper and lower band of the Keltner channel. Yet you need to use this indicator smartly with well-optimized confluence to enhance your chances of success.
Pros and Cons of using Keltner Channels indicator
| Pros | Cons |
|---|---|
| This indicator works great in a volatile market where the prices move very rapidly. | It is a moving averages indicator so it can lag at times. |
| It can help you to identify a market trend. | The lagging of this indicator can lead you to some miss-opportunities. |
| Keltner channel provides information about the continuation of the prices. | It can generate false signals. |
| This indicator helps you to find the buy/sell signals. | 10% of the time, prices don’t follow the upper and lower band of the Keltner channel. |
| The Keltner channel helps in formulating a good trading strategy. | It requires the confluence of other technical trading tools for its full working. |
| It is a high success ratio indicator. | |
| The preview of this indicator is very user-friendly and easy to eyes. |
Conclusion
The Keltner channel is a very user-friendly and easy to eyes indicator that helps work in a volatile market. This indicator gives you an opportunity to find the market trend and formulate a good technical trading strategy. This indicator’s confluence with RSI can positively impact your trading experience.